DOI: 10.12928/TELKOMNIKA.v16i3.6722 1193
Integration Method of Local-global SVR and Parallel
Time Variant PSO in Water Level Forecasting for Flood
Early Warning System
Arief Andy Soebroto, Imam Cholissodin*, Maria Tenika Frestantiya, Ziya El Arief Faculty of Computer Science, Universitas Brawijaya, Malang 65145 , Indonesia
*Corresponding author, e-mail: [email protected], [email protected]*2, [email protected], [email protected]
Abstract
Flood is one type of natural disaster that can’t be predicted, one of the main causes of flooding is the continuous rain (natural events). In terms of meteorology, the cause of flood is come from high rainfall and the high tide of the sea, resulting in increased the water level. Rainfall and water level analysis in each period, still not ab le to solve the existing prob lems. Therefore in this study, the proposed integration method of Parallel Time Variant PSO (PTVPSO) and Local -Glob al Support Vector Regression (SVR) is used to forecast water level. Implementation in this study comb ine SVR as regression method for forecast the water level, Local-Glob al concept take the role for the minimization for the computing time, while PTVPSO used in the SVR to ob tain maximum performance and higher a ccurate result b y optimize the parameters of SVR. Hopefully this system will b e ab le to solve the existing prob lems for flood early warning system due to erratic weather.
Keywords: local glob al support vector regression; water level; parallel time variant particle swarm optimization
Copyright © 2018 Universitas Ahmad Dahlan. All rights reserved.
1. Introduction
Natural disasters become one topics that globally discussed by people nowadays, one of these disasters are flood which has major influence and a massive loss [1]. In many country, it become a common problem because this natural disaster can’t predicted. So far, flood caused by processes associated with sea level and water flow [2-3]. Surabaya’s Government started an analysis of rainfall data and water level in each period [4], but these efforts still not able to solve the existing problems. Departing form this problems, it takes a rational solution from various viewpoints. Aside from the human side, the solution in terms of technology is also expected to settle this problem.
The object used in this study is water level. The higher the water level would be one of the factors leading to the potential of flooding. The tropical storm “Nock-ten” and “Heima” causing a massive flood occurred in Thailand. For five months from July to November 2011, flood down from the northern part of Thailand, it encourages Youngjoo to conduct a research on the estimation of the volume water in the river [5]. Whereas in the State of China, in the past 20 year on the Huahei River (the 6th largest river in China), a massive flood occurs three times, in 1991, 2003 and 2007. The increase of water level in this river is causing severe flooding and waterlogging, so as to encourage research to make a monitoring flood in Huahei River [6]. A study has been conducted for infiltration water volume in Moleng River in the State of Mongolia [7], which had a thickness of the edge of the river from upstream to downstream in general 2m to 5.3m, and reached a maximum value of 7.5m with flood flow amounted to 90% each year.
Current technology has been developed in various aspects of human life, one technology in the computer field where a computerized system is currently developed as an alternative to help solve problems and assist in the decision making process in order to improve performance, using the technology in the field of computer, data processing and the provision of accurate information can be obtained efficiently and effectively. Estimation of watershed is important to determine the fundamental danger in the risk of flooding [5]. The technology for the
flood detection by forecast the water level will be needed by the various parties to obtain a lot of weather conditions more quickly and accurately.
Forecasting is the estimation process based on past historical data to estimate in the future [8]. Various forecasting methods have been developed nowadays. The approach developed include stochastic and deterministic approach. Forecasting models mostly using a deterministic approach, which is a condition when t or t-1 and t+1, with a daily period [9]. The usual method for predicting linear data such as exponential smoothing models, moving average (MA) and autoregressive integrated moving average (ARIMA). While the methods used to forecast the data is non-linear threshold autoregressive (TAR), autoregressive conditional heteroskedasticity (ARCH), artificial neural networks (ANN) and Support Vector Regression (SVR) [8].
In the previous studies, using comparison of two methods: multivariate adaptive regression splines (MARS) with support vector regression (SVR) to predict the sales of IT products, SVR gives the root mean squared error (RMSE) which is smaller in the amount of 9:36 in sales Notebook, compared with MARS method that gives RMSE value of 293.3 [10]. In addition, according to research [11], a comparative study of the K -Means method and SVR prove that on 6 opinions sector use of the internet hotspot, SVR gives much better results in 5 sectors than K-Means.
In order to obtain optimal performance of SVR, many methods used to perform the optimization of SVR. Several methods of optimization variables are algorithms cross entropy (CE), bee colony, ant algorithm and particle swarm optimization (PSO). A study by the method of adaptive fuzzy k-nearest neighbor optimized by using parallel time variant particle swarm optimization for prediction of bankruptcy automatically shown to have higher accuracy, which amounted to 81.67% compared to the method FKNN in the amount of 78.75% [12], where PTVPSO approach aimed at search optimization coefficients in the calculation of SVR.
Mentioned in his research that the hybrid SVR-PSO can choose the appropriate input discriminatory features, reducing the average time execution and improve the accuracy of forecasting [13]. Therefore, in this study the proposed integration method of parallel time variant PSO (PTVPSO) and support vector regression (SVR) is used to forecast water level. Implementation in this study combine SVR as regression method for forecast the water level, while PTVPSO used in the SVR to obtain maximum performance and higher acc urate result. Hopefully this system will be able to solve the existing problems for flood detection due to erratic weather. The structure of this paper is as follows. In section 2, some important definitions are given. Section 3 describes the details of our improvement on the SVR-PTVPSO algorithm for forecasting water level. Section 4 presents some simulation results and compares the improved method. The final section provides conclusion.
2. Definitions and Preliminaries
Kernel method is a class of algorithms for analysis or pattern recognition, which elements are known best are the SVM. General assignment pattern analysis is to find and study the common types of relationships such as clusters, classification, and ranking. Kernel methods mapped data into a higher dimensional space with the hope that in the higher space, the dimensions of the data can be structured. The most frequent type of kernel used is Gaussian's Kernel, which is one implementation of Radial Basis Function kernel [14].
( ) . (‖ ‖)
/ (1)
SVM has been efficiently applied for classification and regression [15]. In this paper we used SVM for regression (SVR) [16]. One of the simplest methods used to obtain the line or field of optimal hyperplane SVM algorithm is very complex sequential method developed by [17]. The following steps:
1. Initialize parameter values used. Eg set,
,
(learning rate), C=1
(regularization parameter),
IterMax
= 100000 and
(epsilon).
2. Set the parameter, , then compute the Matrix Hessian. l is the number of
data.
( ) (2)
* , ( ) - +, (3)
and * , ( ) - + (4)
(5)
and (6)
4. Go back to the third step, until the condition IterMax or ( (| |) and (| |) ) Support vector, if the data has value ( )
5. The forecast function is:
( ) ( )( ( ) ) (7)
6. End
PSO (Particle Swarm Optimization) is one of optimization techniques based on the metaphor of social interaction and communication as groups of birds or fish. This model will be simulated in space with specific dimensions with a number of iterations so that in each iteration, the particle's position will increasingly lead to the intended target (minimizing or maximizing functions). This is done until the maximum iteration or other termination criteria [18]. PSO is added by inertia weight and acceleration coefficient to improves performance. Each particle has position and velocity, and updates that in every iterating [19]. Below is a translation of PSO approach [12]:
( ) ( ) (8)
j=1,2,…,d (9)
Where in the vector Pi represents the best positions of the particles prior to i which gives the best value, which is known as pbest. Vector is the vector particles Pg best among all the particles in the population, which is known as gbest. r1 and r2 are random numbers generated between the
values [0,1]. Variables that exist in SVR methods used for forecasting water level, at -where to get this purpose, PTVPSO (Parallel Time Variant PSO) continuously coupled to dynamically conducts parameter optimization and feature selection simultaneously. Features obtained from optimizing the use as input into the SVR models applied in parallel so that a method that is optimized SVR. For the inertia weight, which is used to balance the local exploitation and global exploration, a large inertia weight used for global search, while small inertia weight is used for local search [20], the inertia weight is update according to following equation:
( ) .
/ (10)
Where wmin and wmax predefined as maximum weight and minimum weight which initialize before
training models, in the other side tmax is maximum iterations of PSO, and t is current iterations.
Usually the value of wmin is 0.4 and the value of wmax is 0.9 because the value provide a good
results [12]. This equation is also-known-as time varying inertia weight (TVIW). In the other hand, c1 and c2 are coefficients acceleration that has function for balancing the global exploration and
local exploitation for better performance of PSO, time varying acceleration coefficient (TVAC) is update according to following equation:
( ) .
/ (11)
( ) .
Where c1f, c1i, c2f, and c2i are constants, tmax is maximum iterations of PSO, and t is current
iterations. The value which is used for c1i is 2.5, c1f is 0.5, c2i is 0.5 and c2f is 2.5 because the
value provide with a good results [12].To check the errors from the forecasting method, it can be determined by calculating the difference between the original value of the water level data with the value of forecasted data. Common methods used in the measurement accuracy of forecasting, there are several kinds of method. Many researcher prefer to use MAPE (mean absolute percentage error) because MAPE is easy to understand, MAPE use percentage value to show the error value [21]:
MAPE = |̂ | (13)
Besides MAPE we also use MAE (mean absolute error) to show the error value [22], the formula of MAE is according to following equation:
MAE |( ̂ )| (14)
Where ̂ is the forecasted data of water level and is the actual data of water level. n is the amount of predicted data.
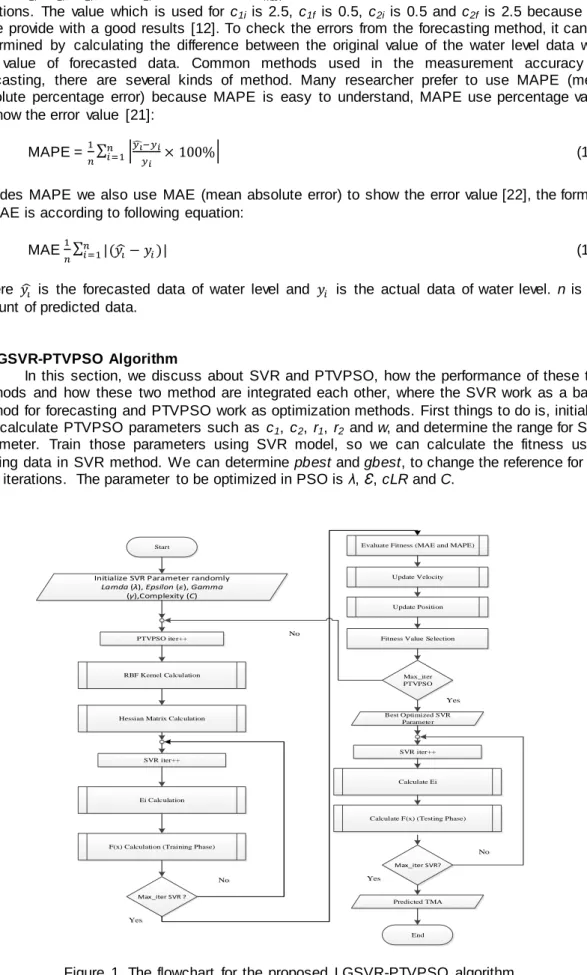
3. LGSVR-PTVPSO Algorithm
In this section, we discuss about SVR and PTVPSO, how the performance of these two methods and how these two method are integrated each other, where the SVR work as a basic method for forecasting and PTVPSO work as optimization methods. First things to do is, initialize and calculate PTVPSO parameters such as c1, c2, r1, r2 and w, and determine the range for SVR
parameter. Train those parameters using SVR model, so we can calculate the fitness using training data in SVR method. We can determine pbest and gbest, to change the reference for the next iterations. The parameter to be optimized in PSO is λ, Ɛ, cLR and C.
RBF Kernel Calculation Start
PTVPSO iter++
Hessian Matrix Calculation
SVR iter++
Ei Calculation
F(x) Calculation (Training Phase)
Evaluate Fitness (MAE and MAPE)
Update Velocity
Update Position
Fitness Value Selection
Max_iter PTVPSO Best Optimized SVR Parameter SVR iter++ Calculate Ei
Calculate F(x) (Testing Phase)
Max_iter SVR? Predicted TMA End Yes No Yes No
Initialize SVR Parameter randomly
Lamda (λ), Epsilon (ε), Gamma
(γ),Complexity (C)
Max_iter SVR ?
Yes
No
It can be said that for the training phase, the SVR methods are inside PTVPSO methods, but after we get the optimal parameters with the biggest fitness value for training data, we can use the parameters for testing phase. To do testing phase, we only use SVR method itself to forecast the water level. Kernel method has been used in this study is RBF Gaussian. Figure 1 shows the proposed method we used LGSVR-PTVPSO (Local Global SVR-PTVPSO), Global SVR can be interpreted in testing phase we use a large iterat ions to find the optimal parameters for SVR, in the other hand Local SVR can be interpreted in training phase we use a small amount of iterations to find the optimal parameters.
4. Experiment And Analysis
This section discussed the experiments have been performed as well as analysis of the experiment. Several trial test has been conducted for SVR features that used to optimize water level forecasting, where the variations of SVR feature are 3, 4 and 5 days feature. The data in Table 1 expressed in meters (m), we can clearly see to forecast the 1st day, it takes the value of F1 to F5 which is the actual value of the 5 days prior to day 1 which is amount of the Y, for forecasting the 2nd day. Actual value on the 1st day was used as the last feature or F5 to make the forecast, as well as for the next day.
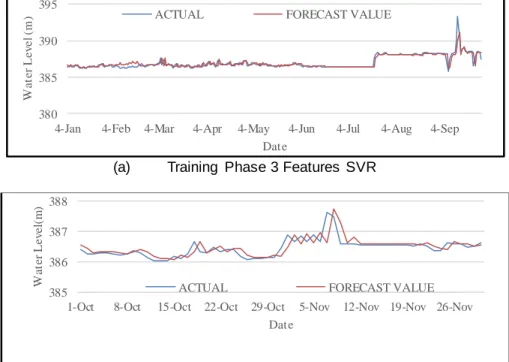
(a) Training Phase 3 Features SVR
(b) Testing Phase 3 Features SVR
Figure 2. Visualization Water Level Forecasting using 3 features of SVR where (a) is the best result of training phase and (b) is the best result of testing phase.
The visualization prediction experiment using 5 features or using 5 days in advance wi ll be presented in Table 1:
Table 1. Forecast Experiment Visualization using 5 Features SVR
Day F1 F2 F3 F4 F5 Y Day 1 387.216 386.794 386.888 386.927 386.843 387.095 Day 2 386.794 386.888 386.927 386.843 387.095 386.989 Day 3 386.888 386.927 386.843 387.095 386.989 386.794 Day 4 386.927 386.843 387.095 386.989 386.794 386.905 Day 5 386.843 387.095 386.989 386.794 386.905 387.045 380 385 390 395
4-Jan 4-Feb 4-Mar 4-Apr 4-May 4-Jun 4-Jul 4-Aug 4-Sep
W a te r L e v e l (m ) Date
ACTUAL FORECAST VALUE
385 386 387 388
1-Oct 8-Oct 15-Oct 22-Oct 29-Oct 5-Nov 12-Nov 19-Nov 26-Nov
W a te r L e v e l( m ) Date
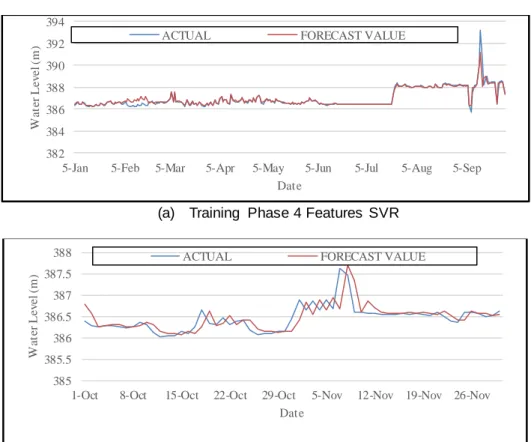
The second experiment of SVR feature is using four features or by using the value of 4 days prior to actual days to forecast the water level. Figure 2 is the best result of training and testing using 4 days features of SVR, the best trials that have been performed, obtained MAPE value which is amount to 0.0459 and MAE value which is amount to 0.177882 for training phase and MAPE value which is amount to 0.03708 and MAE value which is amount to 0.14336 for testing phase.
(a) Training Phase 4 Features SVR
(b) Testing Phase 4 Features SVR
Figure 3. Visualization Water Level Forecasting using 4 features of SVR where (a) is the best result of training phase and (b) is the best result of testing phase.
The third experiment of SVR feature is using five features or by using the value of 5 days prior to actual days to forecast the water level. Figure 3 is the best result of training and testing using 5 days features of SVR, the best trials that have been performed, obtained MAPE value which is amount to 0.04706 and MAE value which is amount to 0.18088 for training phase and MAPE value which is amount to 0.039335 and MAE value which is amount to 0.15208 for testing phase.
Table 2 describes the comparison of execution time and error rate some variation of features SVR used in this experiment, for training result the best value obtained from using 4 days features of SVR or using the value of 4 days prior to actual days to forecast, we can clearly see the data on the result of the prediction is very precise with the actual data on the training phase, while for the testing phase the best value obtained from using 3 days features of SVR or using the value of 3 day prior to actual days to forecast, it appears that the predicted result and the actual data of water level is very precise using 3 days features of SVR, while the fastest execution time of the experiment using 3 days features of SVR for training phase and 5 days features of SVR for testing phase, the factors that affect the speed of computation time/running time (RT) is the tabulated data used in this experiment, due to the data used in training phase more numerous compared with the data in the testing phase.
382 384 386 388 390 392 394
5-Jan 5-Feb 5-Mar 5-Apr 5-May 5-Jun 5-Jul 5-Aug 5-Sep
W a te r L e v e l (m ) Date
ACTUAL FORECAST VALUE
385 385.5 386 386.5 387 387.5 388
1-Oct 8-Oct 15-Oct 22-Oct 29-Oct 5-Nov 12-Nov 19-Nov 26-Nov
W a te r L e v e l (m ) Date
Table 2. Experiment Result Features of SVR both (a) testing and (b) training phase (a) Training Result
Features of SVR Training MAPE MAE RT(s) 3 Features 0.047635 0.185639 481.6667 4 Features 0.046216 0.179107 516.3333 5 Features 0.047141 0.181965 512.3333 (b) Testing Result Features of SVR Testing MAPE MAE RT(s) 3 Features 0.036016 0.13925 22 4 Features 0.037257 0.14404 22 5 Features 0.039695 0.15324 20.6
It appears when the testing phase and training phase on the forecasting process which obtain the best value when using 3 days until 4 days in advance, it does give an indication that the water level ranging from 3 to 4 days give the significant influence on the actual day, either the water level are going to increase or decrease, but when using 5 days in advance the data may be too far away to predicted the actual days.
5. Conclusion
In this paper we propose the algorithm Local-Global SVR with Parallel Time Variant PSO which is successfully used for forecast the water level for flood early waring system. For SVR, input feature are crucial problems, we get 3 days feature optimum for training phase and 4 days feature optimum for testing phase. The results indicate that the more we used days for feature didn’t made the forecasting more accurate, the water level was highly influenced by 3 to 4 days before the actual days. In this algorithm PTVPSO was us ed to optimize the parameters of SVR such as λ, ε, cLR and C and this method can obtain suitable parameters of SVR to improve the forecasting performance of the proposed model. In the future we will study other water level forecasting using some attributes that influenced this object.
Acknowledgment
I would like to thank the Badan Meteorologi Klimatologi dan Geofisika (BMKG) for the data that has been proved to improve this paper.
References
[1] Ma, D., Ding, N., Wang, J. and Cui J. Research on Flood Sub mergence Analysis System Based on ArcEngine Component Lib rary, in Ministry of Construction P.R.China Science & Technology Planning Project (2010-K9-24), 2010.
[2] Meesuk, V., Vojinovic, Z. & Mynett, A.E. Using Multidimensional Views of Photographs for Flood Modelling, in Hydro and Agro Informatics Institute, Ministry of Science and Technology, 2012 IEEE. [3] Wadey, M.P., Cope, S.N., Nicholls, R.J. & Mchugh, K. Coastal Flood Analysis and Visualization for A
Small Town. Ocean & Coastal Management 116. 2015.
[4] Saud, I. Kajian Penanggulangan Banjir di Wilayah Pematusan Surabaya Barat. Application Journal. 2007; 3(1). ISSN: 1937-753X.
[5] Youngjoo, K., Jonggeol, P., Atsuhiro Y. & Kazuhiko F. Estimation Of Flood Volume in Chao Phraya River Basin, Thailand, From Modis Images Coupled with Flood Inundation Level. International Centre for Water Hazard and Risk Management (ICHARM) under the auspices of UNESCO, Public Works Research Institute (PWRI), 2012 IEEE.
[6] Zheng, W. The Flood Monitoring Information System Framework Based on Multi-source Satellite Remote Sensing Data. 2012 International Conference on System Science and Engineerin g June 30-July 2, 2012, Dalian. 2012
[7] Zhao, B., Ding, X. & Cao, H. The Recognition of River Channel Flood Infiltration Capacity Based on
Numerical Simulation. Xi'an Research Institute of China Coal Technology & Engineering Group Corp
Xi’an, China 978-1-61284-34 0-7/11/$26.00 ©2011 IEEE. 2012.
[8] Alwee, R., Mariyam, S. & Sallehuddin R. Hybrid Support Vector Regression and Autoregressive Integrated Moving Average Models Improved by Particle Swarm Optimization for Property Crime
Rates Forecasting with Economic Indicators. Hindawi Pub lishing Corporation The Scientific World Journal 2013. 2013.
[9] Sutikno, Bekti, R., Susanti, P. & Istriana. Prakiraan Cuaca Dengan Metode Autoregressive Integrated Moving Average, Neural Network, dan Adaptive Splines Threshold Autoregression di Stasiun Juanda Surabaya. Jurnal SAINS Dirgantara. 2010.
[10] Lu, C., Lee T. & Lian, C. Sales Forecasting of IT Products using A Hyb rid MARS and SVR Model. 2010 IEEE International Conference on Data Mining Workshops. 2010.
[11] Liu, H. Internet Pub lic Opinion Hotspot Detection and Analysis Based on KMEANS and SVM Algorithm. 2010 International Conference of Information Science and Management Engineering. 2010.
[12] Chen, H., Yang, B. & Wang, G. A Novel Bankruptcy Prediction Model Based on an Adaptive Fuzzy K-Nearest Neighb or Method. College of Computer Science and Technology, Jilin University, Changchun 130012, China. 2011.
[13] Guo, Y. An Integrated PSO for Parameter Determination and Feature Selection of SVR and its Application in SLTF. Proceedings of the Eighth International Conference on Machine Learning and Cybernetics, Baoding. 2009
[14] Javed, F., Gregory, S.H.C., Savkin A.V. RBF Kernel Based Support Vector Regression to Estimate The Blood Volume and Heart Rate Responses During Hemodialysis. 31st Annual International Conference of the IEEE EMBS Minneapolis, Minnesota. 2009.
[15] Saipunya, S., Theera-Umpon,N., Cross-Sub station Short-Term Load Forecasting Based on Types of Customer Usage Characteristics. The 4th Joint International Conference on Information and Communication Technology, Electronic and Electrical Engineering (JICTEE-2014). 2014.
[16] Sanusi, Buono, A., Sitanggang I. S., Faqih A. Downscaling Modeling Using Support Vector Regression for Rainfall Prediction. TELKOMNIKA Indonesian Journal of Electrical Engineering. 2014. 12(8): 6423 – 6430.
[17] Vijayakumar, S., Wu S. Sequential Support Vector Classifiers and Regression. RIKEN Brain Science Institute 1999. 1999; 610 – 619.
[18] Krisnawati, M. Perbandingan Performansi Algoritma Cross Entropy (CE) dan Algoritma Particle Swarm Optimization (PSO) pada Penyelesaian Permasalahan Flowshop Scheduling. Dinamika Teknik. 2011; 5(2): 53 – 63.
[19] Novitasari D., Cholissodin I., Mahmudy W. F. Hybridizing PSO with SA for Optimizing SVR Applied to Software Effort Estimation. TELKOMNIKA Indonesian Journal of Electrical Engineering. 2016; 14(1): 245 – 253.
[20] Ratnaweera, A., Saman, K., Halgamuge. Self-Organizing Hierarchical Particle Swarm Optimizer With Time-Varying Acceleration Coefficients. IEEE Transactions On Evolutionary Computation. 2004; 8(3).
[21] Swanson, D.A., Tayman, J., Bryan, T.M. MAPE-R Rescaled Measure of Accuract for Cross-Sectional Forecasts. Department of Sociology, University of California Riverside, USA. 2008.
[22] Chai, T., Draxler R.R. Root Mean Square Error (RMSE) or Mean Ab solute Error (MAE)? –Arguments against Avoiding RMSE in the Literature. Copernicus Publications on behalf of the European Geosciences Union, Geosci. Model Dev. 2014; 7: 1247–1250.