Some pages of this thesis may have been removed for copyright restrictions.
If you have discovered material in Aston Research Explorer which is unlawful e.g. breaches
copyright, (either yours or that of a third party) or any other law, including but not limited to
those relating to patent, trademark, confidentiality, data protection, obscenity, defamation,
libel, then please read our
Takedown policy
and contact the service immediately
1
A MULTI-ORGANISATIONAL APPROACH FOR DISASTER PREPAREDNESS AND RESPONSE: THE USE OF OPTIMISATION AND GIS FOR FACILITY LOCATION, STOCK
PRE-POSITIONING, RESOURCE ALLOCATION AND RELIEF DISTRIBUTION
OSCAR ESTEBAN RODRIGUEZ ESPINDOLA Doctor of Philosophy
ASTON UNIVERSITY September 2015
© Oscar Esteban Rodríguez Espíndola, 2015
Oscar Esteban Rodríguez Espíndola asserts his moral right to be identified as the author of this thesis
This copy of the thesis has been supplied on condition that anyone who consults it is
understood to recognise that its copyright rests with its author and that no quotation from the thesis and no information derived from it may be published without appropriate permission or acknowledgement.
2
ASTON UNIVERSITY
A MULTI-ORGANISATIONAL APPROACH FOR DISASTER PREPAREDNESS AND RESPONSE
OSCAR ESTEBAN RODRIGUEZ ESPINDOLA Doctor of Philosophy
2015 Thesis Summary
From 1992 to 2012 4.4 billion people were affected by disasters with almost 2 trillion USD in damages and 1.3 million people killed worldwide. The increasing threat of disasters stresses the need to provide solutions for the challenges faced by disaster managers, such as the logistical deployment of resources required to provide relief to victims. The location of emergency facilities, stock prepositioning, evacuation, inventory management, resource allocation, and relief distribution have been identified to directly impact the relief provided to victims during the disaster. Managing appropriately these factors is critical to reduce suffering. Disaster management commonly attracts several organisations working alongside each other and sharing resources to cope with the emergency. Coordinating these agencies is a complex task but there is little research considering multiple organisations, and none actually optimising the number of actors required to avoid shortages and convergence. The aim of the this research is to develop a system for disaster management based on a combination of optimisation techniques and geographical information systems (GIS) to aid multi-organisational decision-making. An integrated decision system was created comprising a cartographic model implemented in GIS to discard floodable facilities, combined with two models focused on optimising the decisions regarding location of emergency facilities, stock prepositioning, the allocation of resources and relief distribution, along with the number of actors required to perform these activities.
Three in-depth case studies in Mexico were studied gathering information from different organisations. The cartographic model proved to reduce the risk to select unsuitable facilities. The preparedness and response models showed the capacity to optimise the decisions and the number of organisations required for logistical activities, pointing towards an excess of actors involved in all cases. The system as a whole demonstrated its capacity to provide integrated support for disaster preparedness and response, along with the existence of room for improvement for Mexican organisations in flood management.
Keywords
Disaster management, multi-objective optimisation, GIS, floods, coordination and collaboration
3
To my parents, my brother and my wife for being my
strength, motivation and inspiration every step of the
way.
“Deserve your dream.” Octavio Paz
4 Acknowledgments
I would like to express my gratitude to Dr. Pavel Albores and Dr. Christopher Brewster for believing in me and guiding me through this process. Their mentoring and support was fundamental for the development of this work and for my growth as a researcher, for which I am deeply grateful.
I want to thank my family for their help and support during this endeavour. My parents, Oscar and Adriana, have been my examples in life and the foundation of everything I have accomplished. My wife Hilda, for patiently being at my side and always encouraging me to be the best version of myself. Manuel and Lorena for being an inspiration of hard work. And to my nephews, Santiago and Mariel, for being a constant motivation for me.
I would also like to thank my friends and colleagues from the PhD and the office for their support, and the wonderful experiences we lived together.
I want to acknowledge the support from the Mexican government to gather the information used as part of this research. Thank you to CENAPRECE and SEDENA for the insights obtained from the conversations and the information offered. Also I want to recognize the support from DICONSA, National System of Family Development, Social Security Mexican Institute, Civil Protection of Veracruz, Guerrero and Tabasco, National Health Ministry, State Health Ministry of Veracruz, Guerrero and Tabasco, National Defence Secretariat, Social Development Secretariat of the State of Guerrero, Municipality of Centro, Social Security Institute of the State of Tabasco, Transport and Communications Secretariat, Public Security Secretariat, Mexican Red Cross, Ministry of Interior and the Navy.
I would like to thank Aston University for the Graduate Teaching Assistantship that funded this study. I also want to acknowledge CONACyT for the complementary scholarship for the completion of my PhD studies.
5 List of Contents Thesis summary ... 2 Dedication ... 3 Acknowledgments ... 4 List of Abbreviations ... 11 List of Figures ... 13 List of Tables ... 17 Chapter 1. Introduction. ... 22 1.1. Current situation ... 23 1.2. Disasters in Mexico ... 24
1.3. Flood preparedness and response ... 26
1.4. Aim and objectives ... 28
1.5. Scope of the thesis ... 29
1.6. Contribution ... 30
1.7. Thesis structure ... 31
1.8. Chapter Summary ... 32
Chapter 2. Theoretical Framework. ... 33
2.1. Disaster concept and definitions ... 33
2.2. Emergency management ... 35
2.3. Logistics for emergency management ... 37
2.3.1. Definitions ... 37
2.3.2. Framework for disaster operations ... 39
2.3.2.1. Facility location ... 40 2.3.2.2. Stock prepositioning ... 40 2.3.2.3. Evacuation... 40 2.3.2.4. Relief distribution ... 40 2.3.2.5. Casualty transportation ... 40 2.3.2.6. Inventory management ... 41 2.3.2.7. Resource allocation ... 41
2.3.3. Coordination in humanitarian logistics ... 41
2.4. Operational Research in disaster management ... 43
2.4.1. Definition ... 43
2.4.2. Optimisation ... 43
2.4.2.1. Definition ... 43
2.4.2.2. Classification based on linearity ... 44
2.4.2.3. Classification based on the number of objectives ... 44
6
2.5. Geographical information systems ... 46
2.5.1. Definition ... 46
2.5.2. Data structures ... 47
2.5.3. GIS for disaster management ... 48
2.6. Chapter Summary ... 49
Chapter 3. Literature review. ... 50
3.1. Introduction ... 50
3.2. Previous reviews ... 50
3.3. Narrative literature review ... 51
3.3.1. Facility location ... 52
3.3.1.1. Shelter location ... 52
3.3.1.2. Emergency facility location ... 57
3.3.1.3. Location of supply facilities ... 58
3.3.2. Relief distribution ... 62
3.3.3. Stock prepositioning ... 66
3.3.4. Inventory management ... 67
3.3.5. Resource allocation ... 69
3.3.6. Location of supply facilities and prepositioning ... 71
3.3.7. Location of supply facilities and relief distribution ... 72
3.3.8. Facility location, stock prepositioning and relief distribution ... 75
3.3.9. Research gap ... 79
3.4. Mexican disaster management framework ... 80
3.4.1. National Civil Protection System ... 81
3.4.2. SINAPROC structure ... 81
3.4.3. Disaster response procedure ... 82
3.4.4. National Disaster Fund ... 83
3.4.5. Gap in practice ... 84 3.5. Chapter Summary ... 84 Chapter 4. Methodology ... 85 4.1. Management research ... 85 4.2. Research paradigm ... 85 4.2.1. Positivism ... 86 4.2.2. Interpretivism ... 87 4.2.3. Selection of paradigm ... 88 4.3. Research design ... 89 4.3.1. Modelling ... 89
4.3.1.1. Geographical Information Systems Modelling ... 90
7
4.3.2. Case studies... 92
4.4. Data collection ... 98
4.5. Data analysis ... 99
4.6. Verification and validation ... 100
4.7. Ethical considerations ... 100
4.8. Chapter summary ... 101
Chapter 5. System design. ... 102
5.1. Geographical procedure ... 102
5.1.1. Identification of suitable facilities ... 103
5.1.1.1. Shelter standards ... 104
5.1.1.2. Standards for distribution centres ... 105
5.1.2. Digitization ... 105
5.1.3. Cartographic model ... 106
5.1.3.1. Data pre-processing ... 106
5.1.3.2. Macro on IDRISI ... 107
5.1.3.3. Network analysis ... 108
5.2. Preparedness optimisation model... 110
5.2.1. Model assumptions... 110
5.2.2. Data requirements ... 111
5.2.3. Model justification ... 111
5.2.4. Design rationale ... 114
5.2.5. Notation and definitions ... 116
5.2.6. Model formulation ... 118
5.2.7. Model solution ... 120
5.2.8. Verification and validation ... 121
5.3. Response optimisation model ... 123
5.3.1. Model assumptions... 123
5.3.2. Data requirements ... 124
5.3.3. Model justification ... 125
5.3.4. Design rationale ... 126
5.3.5. Notation and definitions ... 128
5.3.6. Model formulation ... 131
5.3.7. Model solution ... 133
5.3.8. Verification and validation ... 133
5.4. Chapter summary ... 135
Chapter 6. Case studies. ... 136
8
6.1.1. Conditions of the flood of 2010 ... 137
6.1.2. Application on the GIS procedure on Veracruz ... 138
6.1.2.1. Layers used for the case of Veracruz ... 138
6.1.2.2. GIS procedure for the case of Veracruz ... 141
6.1.2.3. Results of the GIS procedure applied to Veracruz ... 141
6.1.3. Preparedness optimisation model applied on Veracruz ... 142
6.1.3.1. Data collection for scenarios on Veracruz ... 142
6.1.3.2. Application of the preparedness model to the three scenarios at Veracruz ... 149
6.1.3.3. Discussion of the results of the preparedness scenarios at Veracruz ... 150
6.1.3.4. Solutions selected for the three preparedness cases in Veracruz ... 151
6.1.4. Response optimisation model applied on Veracruz ... 151
6.1.4.1. Data collection for the response scenarios on Veracruz ... 151
6.1.4.2. Application of the response model to the three scenarios at Veracruz ... 154
6.1.4.3. Discussion of the results of the three response scenarios at Veracruz ... 155
6.1.4.4. Solutions selected for the three response cases in Veracruz ... 155
6.2. Acapulco, Guerrero ... 156
6.2.1. Conditions of the flood of 2013 ... 157
6.2.2. Application on the GIS procedure on Acapulco ... 157
6.2.2.1. Layers used for the case of Acapulco ... 157
6.2.2.2. GIS procedure for the case of Acapulco ... 159
6.2.2.3. Results of the GIS procedure applied to Acapulco ... 160
6.2.3. Preparedness optimisation model applied on Acapulco ... 161
6.2.3.1. Data collection for the scenarios on Acapulco ... 161
6.2.3.2. Application of the preparedness model to the scenarios at Acapulco ... 165
6.2.3.3. Discussion of the results of the three preparedness scenarios at Acapulco ... 166
6.2.3.4. Solutions selected for the three preparedness cases in Acapulco ... 167
6.2.4. Response optimisation model applied on Acapulco ... 167
6.2.4.1. Data collection for the response scenarios on Acapulco ... 167
6.2.4.2. Application of the response model to the three scenarios at Acapulco ... 169
6.2.4.3. Discussion of the results of the three response scenarios at Acapulco ... 170
6.2.4.4. Solutions selected for the three response cases in Acapulco ... 170
6.3. Villahermosa, Tabasco ... 171
6.3.1. Flood of 2007 in Villahermosa ... 172
6.3.2. Application on the GIS procedure on Villahermosa ... 173
6.3.2.1. Layers used for the case of Villahermosa ... 173
6.3.2.2. GIS procedure for the case of Villahermosa ... 176
6.3.2.3. Results of the GIS procedure applied to Villahermosa ... 177
9
6.3.3.1. Data collection for the scenarios on Villahermosa... 178
6.3.3.2. Application of the preparedness model to the three scenarios at Villahermosa ... 181
6.3.3.3. Discussion of the results of the three preparedness scenarios at Villahermosa .... 182
6.3.3.4. Solutions selected for the three preparedness cases in Villahermosa ... 183
6.3.4. Response optimisation model applied on Villahermosa ... 183
6.3.4.1. Data collection for the response scenarios on Villahermosa ... 183
6.3.4.2. Application of the response model to the three scenarios at Villahermosa ... 186
6.3.4.3. Discussion of the results of the three response scenarios at Villahermosa ... 187
6.3.4.4. Solutions selected for the three response cases in Villahermosa ... 188
6.4. Final remarks about the results of the chapter ... 188
6.5. Chapter Summary ... 189
Chapter 7. Evaluation and discussion... 190
7.1. Results from the geographical procedure ... 190
7.1.1. GIS for the case of Veracruz ... 190
7.1.2. GIS for the case of Acapulco ... 192
7.1.3. GIS for the case of Villahermosa ... 194
7.1.4. Discussion and summary of the results from the geographical procedure ... 196
7.2. Assessment of the preparedness model ... 196
7.2.1. Impact of the geographical analysis ... 197
7.2.1.1. Veracruz ... 197
7.2.1.2. Acapulco ... 198
7.2.1.3. Villahermosa ... 200
7.2.1.4. Summary and discussion ... 202
7.2.2. Value of the integrated model ... 202
7.2.3. Value of the multi-organisational perspective... 205
7.2.3.1. Veracruz ... 205
7.2.3.2. Acapulco ... 206
7.2.3.3. Villahermosa ... 207
7.2.3.4. Summary and discussion ... 208
7.2.4. Assessment of the preparedness model under real circumstances ... 208
7.2.4.1. Real case in Veracruz ... 209
7.2.4.2. Real case in Acapulco ... 211
7.2.4.3. Real case in Villahermosa ... 213
7.2.5. Summary and discussion... 215
7.3. Assessment of the response model ... 220
7.3.1. Value of the multi-organisational perspective... 220
7.3.2. Assessment of the response model under real circumstances ... 223
10
7.4. Chapter Summary ... 228
Chapter 8. Conclusions and future work ... 229
8.1. Research questions review... 229
8.1.1. RQ1: Is the system adequate to aid decision-making on floods in different regions in Mexico? ... 229
8.1.2. RQ2: How does the use of geographical analysis affect the policy applied for disaster management? ... 230
8.1.3. RQ3: Is there a difference for disaster preparedness and response between having coordinated agencies and independent agencies? ... 231
8.1.4. RQ4: Can a methodology based on GIS and optimization be built to determine the location of emergency facilities, stock prepositioning and allocation of resources improve the activities currently performed by Mexican authorities? ... 232
8.2. Contribution ... 233 8.3. Practical implications ... 236 8.4. Limitations ... 237 8.5. Future research ... 239 8.6. Chapter Summary ... 240 References ... 241
Appendix A – Verification of the preparedness optimisation model ... 268
Appendix B – Verification of the response optimisation model ... 270
Appendix C – Information requests made for the case studies ... 272
Appendix D – Available facilities used for the case studies ... 299
Appendix E – Results from the GIS for the three case studies ... 325
Appendix F – Relief products delivered in Mexico ... 345
Appendix G – Metrics from the efficient points obtained from the three cases ... 350
Appendix H – Demand per period for the application of the response model in the three cases ... 408
Appendix I – Relief from non-governmental organisations provided for the flood of Villahermosa ... 430
Appendix J – Photographs of the floods in the three regions of Mexico ... 432
Appendix K – Results from the iterations for independent agencies in preparedness activities . ... 438
11 List of Abbreviations ACTI ADH ADRA AGEB SRAD CENAPRED CENTRO DC DEM DIF FONDEN GIS INEGI IFRCRCS IMSS ISSET LSCP MAEViz MCLP MS MTI MXN OCHA OR PC PMA REDCROSS SP SCT SEDENA SEDESOL SEGOB SEMAR SGUERRERO SMEXICO SRE
Action by Churches Together International Aktion Deutschland Hilft
Adventist Development and Relief Agency Basic Geo-Statistical Area
Search and Rescue Assistance in Disasters National Centre For Disaster Prevention Municipality of Centro
Distribution Centre Digital elevation model
National System of Family Development Natural Disaster Fund
Geographical information system
National Institute of Geography and Statistics
International Federation of Red Cross and Red Crescent societies Social Security Mexican Institute
Social Security Institute of the State of Tabasco Location set covering problem
Mid-America Earthquake Center Seismic Loss Assessment System
Maximal covering location problem Management Science
Medical teams international Mexican pesos
Office for the Coordination of Humanitarian Affairs Operational Research
Civil Protection
Presbyterian Mission Agency Mexican Red Cross
Samaritan’s purse
Transport and Communications Secretariat National Defence Secretariat
Social Development Secretariat Ministry of Interior
Navy
State Health Ministry of Guerrero National Health Ministry
12 SSP SSPPC STABASCO SVERACRUZ UNISDR USGS VRP WFP WV
Public Security Secretariat
Civil Protection and Public Security Secretariat of Guerrero State Health Ministry of Tabasco
State Health Ministry of Veracruz
United Nations Office for Disaster Risk Reduction United States Geological Survey
Vehicle Routing Problem World Food program World Vision
13 List of Figures
Figure 1.1. Damage caused by disasters (1975-2011) ... 23
Figure 1.2. Number of climate-related disasters around the world (1980-2011) ... 23
Figure 1.3. Top 10 countries by number of reported events in 2011 ... 24
Figure 1.4. Organisations involved in large-scale disasters ... 28
Figure 2.1. Natural disasters classification ... 35
Figure 2.2. Phases of the comprehensive disaster management ... 36
Figure 2.3. Components of Humanitarian Logistics ... 38
Figure 2.4. Framework for disaster operations ... 39
Figure.2.5. Pareto frontier ... 45
Figure 2.6. Components of GIS ... 47
Figure 2.7. GIS Data structures ... 48
Figure 3.1. Process of governmental response in disaster situations ... 83
Figure 4.1. Research ‘onion’ ... 86
Figure 4.2. Seven-step modelling process ... 89
Figure 4.3. The Five Stage Research Process Model ... 92
Figure 4.4. Hazard exposure ... 94
Figure 4.5. Lack of coping capacity ... 94
Figure 4.6. Probability of flood in different areas in Mexico ... 95
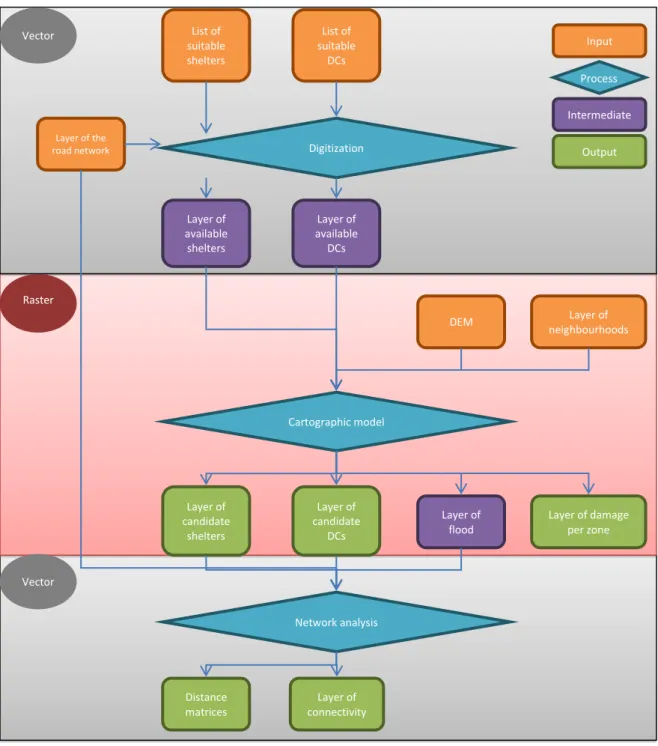
Figure 5.1. Geographical procedure ... 103
Figure 5.2. Cartographic model ... 107
Figure 5.3. Floyd-Warshall algorithm ... 109
Figure 6.1. Location of the case studies in Mexico ... 136
Figure 6.2. Region Veracruz-Boca del Río ... 137
Figure 6.3. Aerial image from Hurricane Karl ... 137
Figure 6.4. Storm total precipitation associated to hurricane Karl ... 138
Figure 6.5. Road network of theregion Veracruz-Boca del Río ... 138
Figure 6.6. AGEBs of the region Veracruz-Boca del Río ... 139
Figure 6.7. Digital elevation model of the region Veracruz-Boca del Río ... 139
Figure 6.8. Facilities available in the region of Veracruz-Boca del Río ... 140
Figure 6.9. Flood of 0.5 meters, 1.5 meters and 2.5 meters at Veracruz ... 141
Figure 6.10. Surviving facilities for floods of 0.5 meters, 1.5 meters and 2.5 meters at Veracruz ... 141
Figure 6.11. Pareto frontier of the three scenarios for preparedness in Veracruz ... 149
Figure 6.12. Pareto frontier of the three scenarios for response in Veracruz ... 154
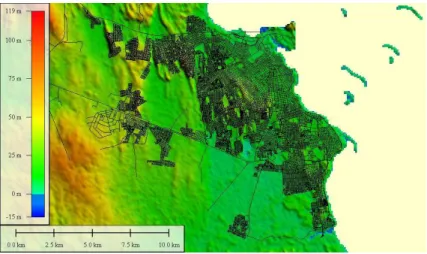
Figure 6.13. Study region and topography of Acapulco, Guerrero ... 156
Figure 6.14. Total rainfall in Mexico from 12th-20th of September 2013 ... 157
14
Figure 6.16. AGEBs of the city of Acapulco ... 158
Figure 6.17. Digital elevation model of Acapulco city ... 158
Figure 6.18. Available facilities for Acapulco city ... 159
Figure 6.19. Flood of 0.5 meters, 1.5 meters and 2.5 meters at Acapulco ... 159
Figure 6.20. Surviving facilities for floods of 0.5 meters, 1.5 meters and 2.5 meters at Acapulco ... 160
Figure 6.21. Pareto frontier of the three scenarios for preparedness in Acapulco ... 165
Figure 6.22. Pareto frontier of the three scenarios for response in Acapulco ... 169
Figure 6.23. Villahermosa, Tabasco ... 171
Figure 6.24. Rivers in Tabasco ... 172
Figure 6.25. Comparison between the historical averages of rainfall in the month on October between 1946-2006 and October 2007 ... 172
Figure 6.26. Flood of Villahermosa ... 173
Figure.6.27. Road network of Villahermosa ... 173
Figure 6.28. AGEBs existent on Villahermosa ... 174
Figure 6.29. Digital elevation model of Villahermosa ... 174
Figure 6.30. Facilities available in the region of Villahermosa ... 176
Figure 6.31. Flood of 1 meter, 2 meters and 4 meters at Villahermosa ... 176
Figure 6.32. Surviving facilities for floods of 1 meter, 2 meters and 4 meters at Villahermosa ... 177
Figure 6.33. Pareto frontier of the three scenarios for preparedness in Villahermosa ... 181
Figure 6.34. Pareto frontier of the three scenarios for response in Villahermosa ... 186
Figure 7.1. Flood mask provided by Mexican authorities about the disaster of 2010 in Veracruz ... 190
Figure 7.2. MODIS image from the Terra Satellite of the southeast region of Mexico on September 20th, 2010 ... 191
Figure 7.3. Comparison of the flood map obtained and the real flood in Veracruz, 2010 .... 191
Figure 7.4. Flood mask provided by Mexican authorities about the disaster of 2013 in Acapulco ... 192
Figure 7.5. MODIS image of Acapulco on December 18th, 2013 ... 192
Figure 7.6. Comparison of the flood of 2013 in Acapulco and the image obtained by the GIS procedure ... 193
Figure 7.7. Damage caused by the floods in Acapulco ... 193
Figure 7.8. Flooded areas near Villahermosa on November 6th, 8th and 10th of 2007 ... 194
Figure 7.9. Satellite image from November 3rd 2007 compared to the area under normal conditions ... 194
Figure 7.10. Overlap of the images from authorities with the GIS result for Villahermosa .. 195 Figure 7.11. Comparison representation of the flood from the Health Ministry and the image
15
from the GIS for the flood of 2007 in Villahermosa ... 195
Figure 7.12. Comparison between the results for Veracruz-Boca del Río with and without GIS ... 197
Figure 7.13. Comparison between the results for Acapulco with and without GIS ... 199
Figure 7.14. Comparison between the results for Villahermosa with and without GIS ... 200
Figure 7.15. Comparison of the results from the integrated model and the sequential approach in Veracruz ... 203
Figure 7.16. Comparison of the results from the integrated model and the sequential approach in Acapulco ... 204
Figure 7.17. Comparison of the results from the integrated model and the sequential approach in Villahermosa ... 204
Figure 7.18. Comparison between the results of the system and independent agencies in Veracruz ... 206
Figure 7.19. Comparison between the results of the system and independent agencies in Acapulco ... 207
Figure 7.20. Comparison between the results of the system and independent agencies in Villahermosa ... 207
Figure 7.21. Facilities used for the flood in Veracruz in 2010 ... 210
Figure 7.22. Comparison between the real activities performed by authorities and the results from the system for the flood in Veracruz in 2010 ... 211
Figure 7.23. Facilities used for the flood in Acapulco in 2013 ... 212
Figure.7.24. Comparison between the real activities performed by authorities and the results from the system for the flood in Acapulco in 2013 ... 213
Figure 7.25. Facilities used for the flood in Acapulco in 2013 ... 214
Figure 7.26. Comparison between the real activities performed by authorities and the results from the system for the flood in Villahermosa in 2007 ... 215
Figure 7.27. Comparison of the results for individual agencies for the case of Veracruz ... 221
Figure 7.28. Comparison of the results for individual agencies for the case of Acapulco ... 222
Figure 7.29. Comparison of the results for individual agencies for the case of Villahermosa ... 222
Figure 7.30. Comparison of the real response activities with the Pareto frontier of the response model for the case of Veracruz ... 224
Figure 7.31. Comparison of the real response activities with the Pareto frontier of the response model for the case of Acapulco ... 224
Figure 7.32. Comparison of the real response activities with the Pareto frontier of the response model for the case of Villahermosa ... 225
Figure A.1. GAMS code of the last version of the preparedness model ... 268
Figure B.1. GAMS code of the last version of the response model ... 270
16
Figure J.2. Images obtained from the flood in Boca del Río ... 433
Figure J.3. Images obtained from the flood in Veracruz and Boca del Río ... 434
Figure J.4. Damage of the flood of 2010 in the region Veracruz-Boca del Río ... 435
Figure J.5. Images obtained from Flickr® of the flood in Acapulco in 2013 ... 436
17 List of Tables
Table 2.1. Scale of disaster ... 34
Table 2.2. Types of disaster ... 34
Table 3.1. Previous literature reviews ... 50
Table 3.2. Civil protection regulations ... 81
Table 3.3. Agencies involved in SINAPROC for a hydro-meteorological disaster ... 82
Table 4.1 Views of Management ... 85
Table 4.2 Contrasting implications of positivism and interpretivism ... 88
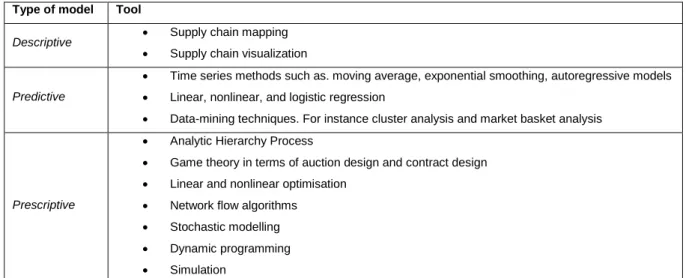
Table 4.3. Techniques used in supply chain management ... 90
Table 4.4. Cases studies selected in Mexico. ... 96
Table 4.5. Validation of the models ... 100
Table 4.6. Summary of the proposed methodology ... 101
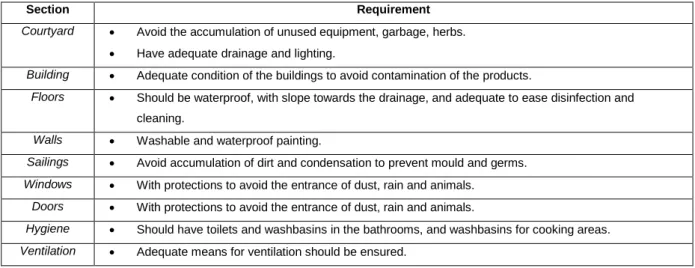
Table 5.1 Living requirements for shelters ... 104
Table 5.2. Minimum requirements for storage facilities in Mexico ... 105
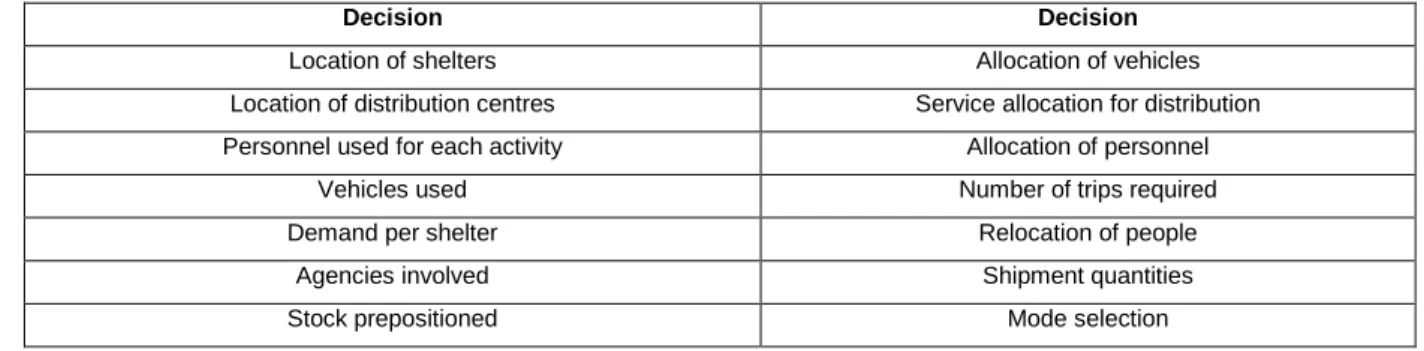
Table 5.3. Set of decisions determined by the preparedness optimisation model ... 115
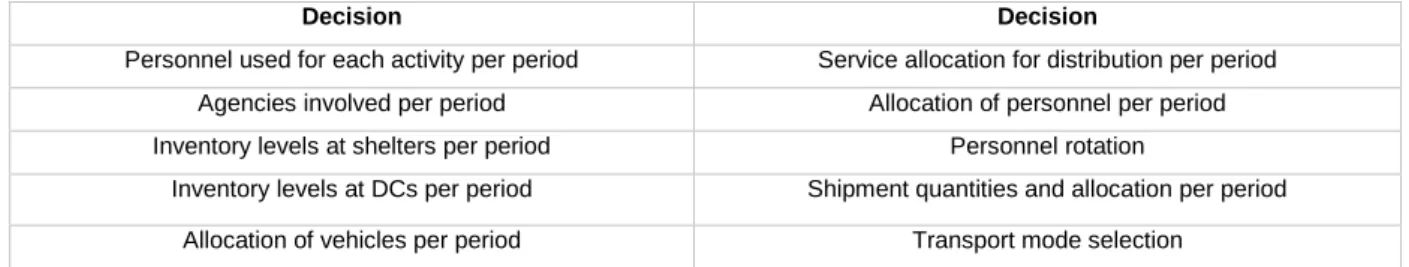
Table 5.4 Decisions taken by the response model ... 127
Table 6.1. Number of AGEBs affected per percentage of damage. ... 142
Table 6.2. Features of the products used on the preparedness model ... 143
Table 6.3. Vehicles available on Veracruz ... 145
Table 6.4. Characteristics of the vehicles considered for Veracruz ... 146
Table 6.5. Number of personnel required per transportation mode ... 147
Table 6.6. Personnel available per organisation per activity ... 148
Table 6.7. Wages per organisation for a flood in Veracruz ... 148
Table 6.8. Overview of the results of the efficient points of the three preparedness scenarios in Veracruz ... 149
Table 6.9. Metrics of the solutions chosen for the three cases in Veracruz ... 151
Table 6.10. Characteristics of the relief products included for the response model ... 153
Table 6.11. Performance measures of the results obtained for response for the three scenarios in Veracruz ... 154
Table 6.12. Metrics of the solutions chosen for the three response scenarios in Veracruz 156 Table 6.13. Number of AGEBs affected per percentage of damage for the three scenarios in Acapulco ... 160
Table 6.14. Vehicles available in Acapulco ... 163
Table 6.15. Characteristics of the vehicles considered for Acapulco ... 163
Table 6.16. Personnel available for the case of Acapulco ... 164
Table 6.17. Wages per organisation for a flood in Acapulco ... 164
Table 6.18. Overview of the results of the efficient points of the three scenarios in Acapulco ... 165
18
Table 6.19. Metrics of the solutions chosen for the three cases in Acapulco ... 167
Table 6.20. Contributions from Red Cross for the flood in Acapulco ... 168
Table 6.21. Performance measures of the results obtained for response for the scenarios in Acapulco ... 169
Table 6.22. Metrics of the solutions chosen for the three response scenarios in Acapulco 170 Table 6.23. Summary of level of damage caused by the three scenarios in Villahermosa . 177 Table 6.24. Vehicles available in Villahermosa ... 179
Table 6.25. Number of employees per activity available in Villahermosa ... 180
Table 6.26. Wages per organisation for a flood in Villahermosa ... 180
Table 6.27. Overview of the results of the efficient points of the three scenarios in Villahermosa ... 182
Table 6.28. Metrics of the solutions chosen for the three cases in Villahermosa ... 183
Table 6.29. Resources provided by Red Cross for the flood of 2007 ... 184
Table 6.30. Relief products provided by International Organisations for the flood of 2007 . 185 Table 6.31. Performance measures of the results obtained for response for the three scenarios in Villahermosa ... 187
Table 6.32. Metrics of the solutions chosen for the three response scenarios in Villahermosa. ... 188
Table 7.1. Floodable number of facilities selected per scenario in Veracruz ... 198
Table 7.2. Floodable number of facilities selected per scenario in Acapulco ... 199
Table 7.3. Floodable number of facilities selected per scenario in Villahermosa. ... 201
Table 7.4. Metrics of the solutions using a combination of a location and an allocation model for the three case studies ... 203
Table 7.5. Set of decisions of the preparedness model provided by authorities ... 209
Table 7.6. Sources of information about governmental decisions on the flood of 2010 in Veracruz ... 209
Table 7.7. Efficient points from the optimisation of the use of resources for the real case in Veracruz in 2010 ... 210
Table 7.8. Sources of information about governmental decisions on the flood of 2013 in Acapulco ... 211
Table 7.9. Efficient points from the optimisation of the use of resources for the real case in Acapulco in 2013 ... 212
Table 7.10. Sources of information about governmental decisions on the flood of 2007 in Villahermosa ... 213
Table 7.11. Efficient points from the optimisation of the use of resources for the real case in Villahermosa in 2007 ... 214
Table 7.12. Comparison of preparedness results for the case of Veracruz-Boca del Río ... 217
Table 7.13. Comparison of preparedness results for the case of Acapulco ... 218
19
Table 7.15. Ideal points for each one of the response cases under real circumstances in
Villahermosa ... 223
Table 7.16. Comparison of solutions for the response case in Veracruz-Boca del Río ... 226
Table 7.17. Comparison of solutions for the response case in Acapulco ... 227
Table 7.18. Comparison of solutions for the response case in Villahermosa ... 228
Table A.1. Sets of the numerical example for the preparedness model ... 268
Table B.1 Sets of the numerical example for the response model ... 270
Table C.1 Regional enquiries for Veracruz ... 272
Table C.2. National enquiries for Veracruz ... 274
Table C.3 Regional enquiries ... 279
Table C.4. National requests for Acapulco ... 283
Table C.5. Regional enquiries for the case of Villahermosa ... 288
Table C.6. National enquiries for the case of Villahermosa ... 293
Table D.1. Shelters available in Veracruz ... 299
Table D.2. Features of the DCs considered for the case of Veracruz ... 301
Table D.3. Available shelters in Acapulco in 2013 ... 302
Table D.4. DCs available for Acapulco city ... 306
Table D.5. Available shelters in Villahermosa in 2007 ... 307
Table D.6. Available DCs in Villahermosa ... 324
Table E.1. Candidate shelters for the three scenarios in Veracruz ... 325
Table E.2. Candidate distribution centres for the three scenarios in Veracruz ... 326
Table E.3. Damage to the AGEBS for the three scenarios in Veracruz ... 326
Table E.4. Analysis of available shelters for the three scenarios in Acapulco ... 330
Table E.5. Analysis of candidate DCs for the three scenarios in Acapulco ... 331
Table E.6. Damage to the AGEBS for the three scenarios in Acapulco ... 332
Table E.7. Candidate shelters for the three scenarios in Villahermosa ... 338
Table E.8. Candidate distribution centres for the three scenarios in Villahermosa ... 342
Table E.9. Damage to the AGEBS for the three scenarios in Villahermosa ... 343
Table F.1. Relief items delivered in Mexico ... 345
Table F.2. Products delivered on the food pantry in Mexico ... 345
Table F.3. Relief items distributed in Mexico before the legislation change in 2012 ... 346
Table F.4. Medicine kit used by Mexican authorities ... 346
Table F.5. Selection of relief products included for the response model ... 347
Table F.6. Products included in the cleaning kit ... 348
Table F.7. Personal kit ... 349
Table G.1. Metrics of the efficient points for the preparedness scenario of 0.5 meters in Veracruz ... 350
Table G.2. Metrics of the efficient points for the preparedness scenario of 1.5 meters in Veracruz ... 351
20
Table G.3. Metrics of the efficient points for the preparedness scenario of 2.5 meters in
Veracruz ... 354
Table G.4. Metrics of the efficient points for the response scenario of 0.5 meters in Veracruz.. ... 358
Table G.5. Metrics of the efficient points for the response scenario of 1.5 meters in Veracruz.. ... 362
Table G.6. Metrics of the efficient points for the response scenario of 2.5 meters in Veracruz.. ... 367
Table G.7. Metrics of the efficient points for the preparedness scenario of 0.5 meters in Acapulco ... 373
Table G.8. Metrics of the efficient points for the preparedness scenario of 1.5 meters in Acapulco ... 375
Table G.9. Metrics of the efficient points for the preparedness scenario of 2.5 meters in Acapulco ... 377
Table G.10. Metrics of the efficient points for the response scenario of 0.5 meters in Acapulco ... 381
Table G.11. Metrics of the efficient points for the response scenario of 1.5 meters in Acapulco ... 385
Table G.12. Metrics of the efficient points for the response scenario of 2.5 meters in Acapulco ... 387
Table G.13. Metrics of the efficient points for the preparedness scenario of 1 meter in Villahermosa ... 389
Table G.14. Metrics of the efficient points for the preparedness scenario of 2 meters in Villahermosa ... 392
Table G.15. Metrics of the efficient points for the preparedness scenario of 4 meters in Villahermosa ... 394
Table G.16. Metrics of the efficient points of the response model applied to a flood of 1 meter in Villahermosa ... 400
Table G.17. Metrics of the efficient points of the response model applied to a flood of 2 meters in Villahermosa ... 403
Table G.18. Metrics of the efficient points of the response model applied to a flood of 4 meter in Villahermosa ... 405
Table H.1. Demand per period for the three scenarios in Veracruz ... 408
Table H.2. Demand per period over time for the three scenarios in Acapulco ... 410
Table H.3. Demand per shelter per period in the flood of Villahermosa ... 415
Table I.1. International aid provided to the Mexican government for the flood of 2007 ... 430
Table K.1. Set of efficient points obtained from the application of the preparedness model to the nine agencies in Veracruz ... 438
21
Table K.2. Set of efficient points obtained from the application of the preparedness model to the ten agencies in Acapulco ... 440 Table K.3. Set of efficient points obtained from the application of the preparedness model to the ten agencies in Villahermosa ... 442
22 1. INTRODUCTION
Natural disasters are a constant threat for many countries, affecting an average of over 200 million people per year between 2000 and 2014 (CRED, 2015). It only takes one victim to begin to grasp the relevance and complexity of the activities required to provide care to and to support affected people. As a research assistant for a research project during my MSc, I had the opportunity to travel to three areas affected by floods in Mexico, talking to affected people and governmental authorities to get a better understanding of their experiences. Those conversations shed some light on the complexities related to disaster management and the relevance of informed decision-making. In this context, the focus of the activities performed is the well-being of the victims, beyond objectives used in industry. The decisions to support flood victims should contemplate fairness to avoid discrimination and political bias. There are several activities to be undertaken to protect the people affected by disasters. Poor decision making has a large impact on disaster victims. For instance, the selection of floodable shelters, shortage of relief items, absence of human resources because of poor allocation or duplication of efforts in distribution can greatly affect the level of service provided. How to improve that decision-making is not that evident. From different discussions with authorities I realised that even though negligence plays a significant role, in several cases the problem is more related to the absence of support for guidance. Mexico is a country commonly affected by floods (Garcia, 2008), and as a result it has both a National System for Civil Protection (SEGOB, 2006a) and a dedicated budget for disaster management (Rodríguez Esteves, 2004). Despite the resources available, several issues have been identified in major disasters recently (Reyes and Beard, 2011, Santos-Reyes et al., 2010) stressing the need for the development of tools for disaster management applicable to the Mexican context. Thus, the motivation for this work is related to the tangible impact, or lack of it, of the activities performed, particularly when resources are actually available.
One technique that has been commonly used for disaster management is optimisation (Altay and Green, 2006), but the models available in the literature do not easily fit to the Mexican disaster management structure. The large number of participants, all with different resources, can create a considerable challenge to overcome if added to the complexities inherent to logistical activities such as facility location, stock pre-positioning, relief distribution and resource allocation.
The purpose of this research is to develop a tool that can be used to aid decision-making in flood situations in Mexico, so as to enable the provision of appropriate service for people at risk by incorporating multi-organisational coordination. This chapter provides an entry point for the research performed including the objectives pursued, followed by the research justification and the scope of the analysis. It concludes with the outline of the dissertation.
23 1.1 Current situation
According to the United Nations Office for Disaster Risk Reduction (UNISDR), from 1992 to 2012 around 4.4 billion were affected by disasters with almost 2 trillion USD in damages and 1.3 million people killed worldwide (UNISDR, 2012). But the situations are getting worse recently. According to the World Bank, approximately 2.6 billion people were affected by natural disasters from 1994-2003, more than the 1.6 billion affected in the previous decade (IEG, 2006). Similarly, the reported economic damage caused by disasters shows an increasing trend in recent years (CRED, 2013), as it can be seen on Figure 1.1 comparing events from 1975 to 2011 scaling the damage to US dollars in 2014. Just in 2011, the total value of damage caused by disasters globally was around US$ 366.1 billion, the highest ever registered (Guha-Sapir et al., 2012).
Source: CRED (2013) Figure 1.1. Damage caused by disasters (1975-2011)
Hydrological disasters are the most frequent and harmful (Haddow et al., 2008), as shown by Figure 1.2 by plotting the number of climate-related disasters occurred recently globally. Over 100 floods occur on average per year, and more than 150 of them occurred each year between 2007 and 2012.
Source: UNISDR (2012) Figure 1.2. Number of climate-related disasters around the world (1980-2011)
0 50 100 150 200 250 3455 Floods 2689 Storms 470 Droughts 395 Extreme temps
24
These changes have been reflected to some extent in the academic literature, attracting the attention of researchers (Kunz and Reiner, 2012), leading to many journal publications (Caunhye et al., 2012) and even the creation of journals focused on the topic (Kovács and Spens, 2011). However, research in this area for developing countries is only now beginning to be undertaken, while over 70% of disasters between 1970 and 2009 have occurred in such countries (Julca, 2012).
The impact of disaster events can vary widely between developed and developing countries (Julca, 2012). The lack of resources, poor urban planning, and high vulnerability are reasons behind the steep impact of disasters on these countries. For that reason, more research regarding the challenges faced by developing countries is required (Kovács and Spens, 2011). For instance, in 2011 over 57% of the reported damage by disasters was due to the earthquake and Tsunami in Japan. That represented a financial impact of 3.9% of the country's GDP, whereas disasters in the same year in El Salvador and Cambodia had an impact corresponding to 4.7% and 4.6% of the countries' GDPs respectively (Guha-Sapir et al., 2012).
1.2 Disasters in Mexico
Figure 1.3 shows the ten countries with the greatest number of disaster events reported in 2011, with Mexico in sixth place with eleven events. The majority of disasters in that country were caused by meteorological and hydrological phenomena. The future holds something similar. According to estimations, between 20 and 50 years from now one of the most flood-affected states of Mexico, Tabasco state, could be covered by water (Hernández, 2013, Pérez, 2009).
Source: Guha-Sapir et al. (2012) Figure 1.3. Top 10 countries by number of reported events in 2011
0 5 10 15 20 25 30 35 N u m b e r o f e ve n ts Country Meteorological Hydrological Geophysical Climatological
25
The number of people affected by disasters is an even greater concern. In 2011, Mexico had the tenth highest number of victims caused by disasters worldwide with 3.7 million (Guha-Sapir et al., 2012). From 1950 to 2015 the country has suffered 241 reported large-scale disasters representing more than 7.5 percent of the total number of disasters in 47 countries analysed in the Americas (CRED, 2016a). That number makes Mexico the most affected country by disasters in the Americas after the United States (CRED, 2016a), with an average occurrence of nearly 4 large-scale disasters per year in the last 65 years.
The country has also been deeply affected financially by disasters. For instance, the State of Tabasco has experienced estimated economic damage equivalent to 192 million US dollars, $2.4 billion US dollars and $405.5 million US dollars in 1999, 2007 and 2008 respectively (Zapata et al., 2011). Just the ten top disasters in Mexico have caused an estimated damage of US $26,024,000,000 (CRED, 2016b) from a total reported damage of US $43,629,210,000 from 1950 to 2015 in the country (CRED, 2016a). That means that Mexico has suffered nearly 4.4% of total damage caused by disasters in the Americas in 65 years, the second highest value just surpassed by the United States (CRED, 2016a). That is evidence that Mexico is a country that has been deeply affected by disasters.
The case of Mexico is also interesting because it has the second largest economy in Latin America but nearly 50% of the population lives in poverty (World_Bank, 2013). It is an economically stable country but with high levels of marginalization and vulnerability. Despite the severe damage caused by disasters in Mexico, the country is not as dependent on international aid as other developing countries, as shown by the limited number of times the country has requested international aid in recent disasters situations (SRE, 2014). The country counts with the resources to actually prepare and react to floods (Rodríguez Esteves, 2004).
Experience in previous disasters has demonstrated the poor performance of current procedures used by authorities, in spite of incurring considerable costs. For instance, sheltering was a significant issue in the flood of Villahermosa in 2007, due to a lack of prepared shelters (Barbozay and Morales, 2007, Notimex, 2007, Urrutia and López, 2007), facilities flooded (Santos-Reyes et al., 2010, Santos-Reyes and Beard, 2011), and the demand exceeding the capacity provided by the authorities (OCHA, 2007b, Santos-Reyes et al., 2010, Uribe and Enriquez, 2007). This obliged the government to open government buildings to shelter some people in need (El_Universal, 2007). It is believed, however, than more than one million people affected by the disaster could not find shelters (Santos-Reyes et al., 2010, Santos-Reyes and Beard, 2011).
Relief distribution became a significant issue as well because of shortages of food (Dudley, 2007, OCHA, 2007b, Santos-Reyes et al., 2010, Santos-Reyes and Beard, 2011), medicines (Notimex, 2007) and supplementary items (Notimex, 2007). This created a fear of social
26
instability (Jiménez, 2007) and provoked episodes of looting (Santos-Reyes et al., 2010, Santos-Reyes and Beard, 2011). There was a lack of personnel to distribute relief (Barbozay and Morales, 2007) and there was evidence of uneven coverage partially due to political interference (Dudley, 2007, Hernández, 2009), impeding the provision of relief to high priority communities.
There are two main issues in current Mexican flood preparation and planning: 1) resources are not being used efficiently among different agencies, and 2) the protection provided for the affected people is poor, at best. Unsafe and unprepared facilities used to shelter people, delays in deliveries, shortages on stock, and inefficient allocation of human resources and goods are results of the absence of proper mechanisms for disaster preparedness and response.
A major goal of this research is to provide evidence than tools suited for floods in Mexico can be developed to provide better support in terms of location, allocation and distribution decisions, with the aim of providing the necessary care and protection for affected populations and ensuring the efficient use of resources by considering multiple organisations and avoiding duplication of efforts.
1.3 Flood preparedness and response
So far, we have shown that a lot of disasters occur around the world, from which floods and other hydrological disasters form a large proportion of these. Different types of disaster require different types of response (Cozzolino, 2012, De Leeuw et al., 2012) given the varying features of each type of hazard. Among all disasters, floods are one of the most common (Tehrany et al., 2013, Ajin et al., 2013) and destructive phenomenon world-wide (Patel and Srivastava, 2013, Sarhadi et al., 2012).
Unlike other sudden disasters such as earthquakes, floods can provide more time to react (Kunz and Reiner, 2012) because these are more easily predicted and prevented compared to other disasters (Chang et al., 2007).
Considering physical aspects such as geography and topography are relevant for floods. For example, hydrological analysis of regions and basins (Diaz and Isuhuaylas, 2001) makes it possible to predict floods using return periods (Ward et al., 2011), obtain probability distributions to forecast floods based on rainfall situations (Esteves, 2013) and generate mapping tools to estimate water heights and damaged zones (Liebscher et al., 2012).
Flood prevention is usually related to mitigation including the development of tools to reduce risk (Haddow et al., 2011). There are situations that cannot be prevented, calling for
27
preparedness and response measures to reduce the damage caused by disasters (El-Sergany and Alam, 2012). Flood preparedness encompasses the readiness of a region to cope with a disaster based on the decisions and activities performed before the disaster occurs (Crowther, 2010), whereas disaster response involves activities during disaster to mitigate damage (Altay and Green, 2006). Adequate planning and preparedness can significantly improve disaster response activities. For example, on the east coast of India, after a major cyclone in 1977 with a death toll around 20,000 people, an early warning system, meteorological radars and emergency plans were established. These systems proved their worth in 1996 and 2005 where the death tolls were 100 and 27 respectively (UNISDR, 2009) for similar cyclones to de one in 1977.
The relationship between preparedness and response is apparent in the close interaction between the activities undertaken on both phases. For instance, prompt relief distribution in the response stage is subject to the availability of relief supplies and the location of emergency facilities.
Research in the area is pointing towards the development of models providing efficiency and effectiveness of emergency operations in the field. Efficiency is associated to resource performance metrics aiming to seeking to cover as much as possible of system’s objectives with minimum resources, whereas effectiveness is related to output performance metrics seeking to maximise the amount of requirements satisified (Beamon and Balcik, 2008). For example, in the field of humanitarian logistics several articles are aiming to minimise the use of resources under certain requirements (e.g. Ozbay and Ozguven, 2007, Sheu, 2007b, Noyan, 2012) as a measure of efficiency, or maximising the number of people serviced with certain resources (e.g. Mete and Zabinsky, 2010, Salmeron and Apte, 2010, Altay, 2013, Najafi et al., 2013, Chang et al., 2014) as a measure of effectiveness.
Despite of the advances on the field, some of the most common challenges still encountered are related to avoid the need for re-evacuations because of the closure of damaged facilities (Santos-Reyes et al., 2010, Santos-Reyes and Beard, 2011), delays in distribution (See PAHO, 2010), relief shortages and the absence of prepared personnel to undertake distribution (OXFAM, 2012, IFRCRCS, 2012). These decisions rely on having the resources to perform them efficiently. Research in the area needs to focus on the joint participation of different organizations.
Government agencies play a major role in aiding vulnerable population. But in reality, governmental agencies are just one of the actors, as illustrated by Figure 1.4.
28
Source: Nolte et al. (2012) Figure 1.4. Organisations involved in large-scale disasters
Considering the large number of organisations involved, Perry (2006) identified elements such as coordination, culturally sensitive assessment, information sharing, local leadership, and lack of knowledge that affect the emergency logistics planning as relevant drivers for successful operations. Focusing on the use of human and material resources, coordination and collaboration are crucial for the efficient management of the actors involved for disaster preparedness and response. Even just among governmental organizations, the autonomy of many of them results in a need for coordination and cooperation to try to cope with the emergency. This is particularly important for developing countries, where resources are even scarcer (Nolte et al., 2012, Quero, 2012).
Disaster situations are so complex that the natural reaction is to send every resource available to provide support. However, having more actors involved is not bounded to get better operations. Increased complications in coordination along with underused capacity can result from that situation. Part of the challenge associated with the deployment of resources is to determine how many organisations to involve, and perhaps more importantly, which ones are needed.
1.4 Aim and objectives
The aim of the proposed research is to develop a system for disaster management based on a combination of optimisation techniques and geographical information systems (GIS) to aid multi-organisational decision-making regarding the location of shelters and distribution centres, the amount of prepositioned stock of relief items, the allocation of material and human resources, and relief distribution for floods in Mexico.
Disaster
Governmental agencies NGOs International aid Civil organizations29
To accomplish the aim, the research has undertaken the following:
An analysis of current research focused on facility location, stock pre-positioning, resource allocation and distribution, both independently and combined, so as to understand in greater depth the context of the problem, and to place the proposed research in the context of existing academic literature.
Evaluate the capabilities of the combination of raster and vector GIS to understand the impact of floods on a particular geographical location.
The development of a methodology integrating geographical analysis with optimisation for the location of emergency facilities, the amount of prepositioned stock of relief items, relief distribution and the allocation of resources.
The design of two optimisation models to integrate preparedness and response in a consistent decision-making process.
The application of the methodology to three study cases in Mexico to evaluate the results obtained from it and its performance across cases.
In order to reach the objectives, the following questions are addressed in this research:
RQ1: Is the system proposed adequate to aid decision-making on floods in different regions in Mexico?
RQ2: How does the use of geographical analysis affect the policy applied for disaster management?
RQ3: Is there a difference for disaster preparedness and response between having coordinated agencies and independent agencies?
RQ4: Can a methodology based on GIS and optimisation be built to determine the location of emergency facilities, stock prepositioning, relief distribution and allocation of resources, and improve the activities currently performed by Mexican authorities?
1.5 Scope of the thesis
The scope of this research is restricted to the location of facilities, stock pre-positioning, relief distribution and allocation of resources for cases of flood. The system developed will focus only on preparedness and response, right before the process of bringing activities back to normality.
The literature review includes only studies focused on humanitarian logistics related to the topics addressed, incorporating papers addressing natural disasters or without disaster specification. Humanitarian logistics share many similarities with commercial logistics, particularly with transient supply chains (Day et al., 2012), but there are unique features of
30
emergency situations that differ from classic logistics (See Van Wassenhove, 2006). This research is portrayed within the framework of humanitarian logistics.
Evaluation of the system developed will be undertaken using past data from real floods in Mexico. Given the chaotic nature of disaster management, some information was not recorded by the authorities, and here optimised results have been used in order to provide the best possible combination of real activities for comparison.
The development of the system has been based on the multi-agency disaster response structure used by Mexican authorities. The system is intended to be used in that country and any adaptations to other geographical areas should be address carefully.
1.6 Contribution
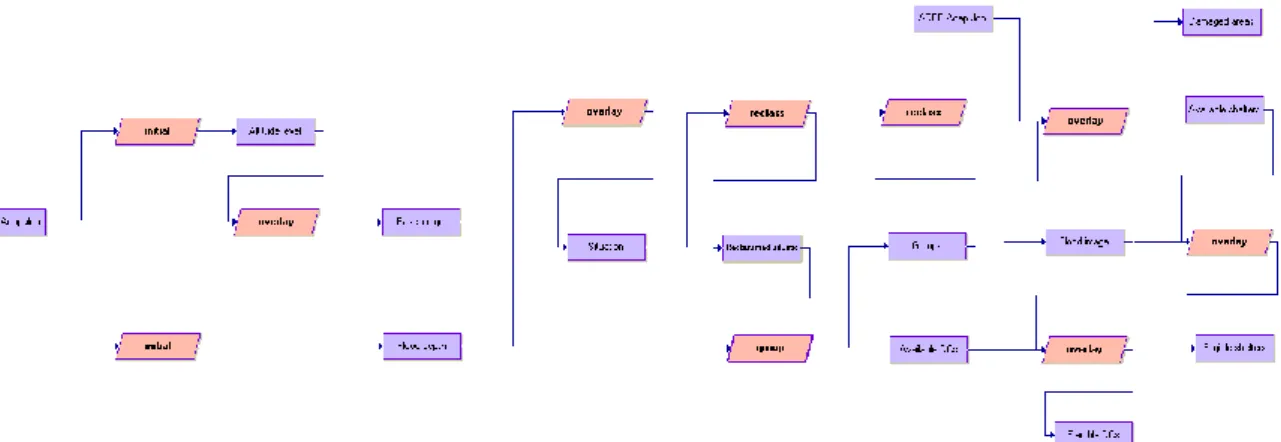
The expected outputs of the system would be: the location of emergency facilities, the allocation of people to shelters, the allocation of pre-positioned inventory, the amount of relief items to ship, the transportation mode, the allocation of shipments between emergency facilities, the number of resources required per agency, the activation of agencies required to face the situation, and the allocation of human and material resources per organisation. As noted previously, it is important to design such a methodology because currently Latin American authorities do not have an optimised mechanism for decision-making in flood episodes (Rodríguez-Espíndola and Gaytán, 2015).
The contributions of the proposed research can be summarised as follows:
The development and analysis of a system for flood management, addressing facility location, stock pre-positioning, resource allocation and relief distribution using a multi-organisational perspective; an approach never undertaken before.
Design of a system for flood preparedness and response based on the Mexican context.
Analysis of coordination and interoperability as crucial elements for disaster management.
Analysis of the value of the use of GIS for disaster preparedness.
The contributions of the system are:
The integration of vector and raster GIS capabilities as input into a system for disaster preparedness and response.
The novel multi-organisation bi-objective multi-commodity multi-modal preparedness model incorporating equity for planning before the disaster happens.
31
The novel multi-organisation bi-objective multi-commodity multi-modal response model considering equity to develop a reactive plan after the disaster occurs.
The inclusion of material and human resources as constraints for flood management.
Balance between efficiency and effectiveness in both models.
The inclusion of a performance measure for each model considering items and services provided on shelters.
The contributions to theory can be summarized as the demonstration of the advantages of a system for disaster management encompassing activities of preparedness and response, the value of the use of raster and vector GIS for flood management, and the analysis of a multi-organisational approach for disaster preparedness and response. The contributions to the practitioners are the system itself and the proof that the inclusion of this tool for decision-making holds the potential to improve current solutions.
1.7 Thesis structure
This section introduces the main content of each chapter to provide an outline of the overall dissertation. The thesis encompasses eight chapters, described as follows.
Chapter 1, Introduction, is focused on the motivation for the problems addressed, the nature of the problem and the importance of research in this area. Also the aims, objectives, scope and contribution of this research are presented.
Chapter 2, Theoretical Framework, introduces several relevant concepts for the research at hand including the clarification of basic definitions, the framework under which this research operates and the description of the main aspects of the techniques included.
Chapter 3, Literature Review, includes the analysis of the literature in humanitarian logistics. It introduces an in-depth analysis of literature focused on facility location, stock pre-positioning, resource allocation, and relief distribution within the context of humanitarian logistics. The gap existent in the literature and the opportunity areas filled by this work are identified. Finally, the Mexican disaster management framework is reviewed to use as base for the design of the models.
Chapter 4, Research Methodology, details the methodology used for the development of this work. It includes the research paradigm in which the research is positioned, the research design and the methodological choices used including the assessment methods applied to evaluate the results of this work.
Chapter 5, System Design, explains each one of the structural parts of the system developed, detailing the rationale, design and steps towards application. It also elaborates on
32
the solution methods for the models and the verification performed to ensure the appropriate functioning of each one of them.
Chapter 6, Case Studies, deals with the application of the system proposed to three case studies in Mexico. Each one of the cases is explained including details of the area and the conditions of the disaster faced, data sources and data collection, the application procedure, the results obtained and the discussion of results.
Chapter 7, Evaluation and Discussion, presents the analysis of results obtained from each one of the cases and the assessment of them, including the evaluation of the models under different instances.
Chapter 8, Conclusions and Future Work, undertakes the summary of the research developed to assess the research questions, identify the contributions provided and mention niches for future research.
1.8 Chapter Summary
This chapter has introduced the research undertaken for disaster preparedness and response. Initially the problem posed by disasters and especially floods has been described, elaborating on the value of the study for disasters in a developing country such as Mexico. Next, the aim and objectives pursued by this work are presented along with the reach of the study and contributions. Finally the content of each chapter is described.
The next chapter elaborates on the main concepts required to appreciate the content of this research; including the main features of humanitarian logistics, the classification of GIS and the characteristics of multiobjective optimisation.
33 2 THEORETICAL FRAMEWORK
The purpose of this section is to introduce and clarify the main concepts and techniques used for the development of this research. Firstly, the concept of disaster, its typology and the context associated with disaster management are introduced. Then, of the concept of humanitarian logistics is defined and the framework of logistical operations is presented. Finally, the definition and classification of the tools used in this research are explained.
2.1 Disaster concept and definitions
Drabek (2007) identified the definition of disaster as a key issue faced by many researchers at the time of providing advances on the field. The first formal definition was provided by Fritz (Perry et al., 2006, Quarantelli and Dynes, 1977), who stated a disaster occurs when “the social structure is disrupted and the fulfillment of all or some of the essential functions of the society, or its subdivision, is prevented” (Fritz, 1961). There are several studies looking into the definition of disaster and its evolution in social sciences (Fischer, 2003, Perry et al., 2006, Drabek, 2007, Quarantelli, 2005), however there seems to be little consensus about the matter. Quarantelli (2005) concluded that the definition of disaster often relies on the purpose and audience of the study (Perry et al., 2006).
Departing from the purpose of the present study, the definition considered comes from the literature on humanitarian logistics. On the Second Session held by UNISDR at Geneva in June 2009, a disaster was defined as a “serious disruption of the functioning of society, causing widespread human, material or environmental losses which exceed the ability of affected society to cope using only its own resources” (UNISDR, 2009). Based on that concept, for the purposes of this research a disaster is understood as an extreme situation that requires the deployment of resources to mitigate the effect on society.
Considering the common association of disasters with emergencies, it is important to define the latter as well. According to Oxford (2015), an emergency can be defined as “a serious, unexpected, and often dangerous situation requiring immediate action”. Commonly in the Sociology literature, authors consider two types of emergencies: everyday emergencies and severe emergencies; none of them reaching the level of disaster (Altay and Green, 2006, Fischer, 2003).
It has been be argued that emergencies and disasters vary mostly on scale, scope and time (Fischer, 2003). To bridge that gap, the concept of large-scale emergencies has been introduced as an extension of severe emergencies. Large-scale emergencies are “rare events that overwhelm local emergency responders and require regional and/or national assistance, such as natural disasters and terrorist attacks” (Jia et al., 2007a). As a result,
disaster management has been considered as a subset of emergency operations (See Haddow et al., 2008, Davis and Lambert, 2002, Schneider, 2013), with the acceptance of catastrophes as extreme disasters (Fischer, 2003). This dissertation supports that view, understanding that not every emergency is a disaster, but considering every disaster as a situation that qualifies as an emergency on large scale bases
Fischer (2003) proposed the scale showed on Table 2.1 to classify events in terms of degree of disruption, scope of the area covered and duration of the disruption. This work is relevant to the third category (DC-3) and above.
The nature of the phenomenon is also relevant, because different hazards require different planning and preparedness (Cozzolino, 2012). Disasters are commonly classified depending on its origin and its speed of development. According to their origin disasters can be natural or man-made, whereas in terms of speed of development these can be classified as sudden-onset and slow-sudden-onset. Table 2.2 exhibits some examples of disasters according to the classification introduced by Van Wassenhove (2006). The research presented here is focused on floods under the umbrella of natural sudden-onset disasters, because floods usually develop in a matter of hours or days (Haddow et al., 2008).
35
Figure 2.1 shows a taxonomy of natural disasters, from which this research will put special attention on floods. According to UNESCO (2012), floods can be defined as a “rise, usually brief, in the water level of a stream or water body to a peak from which the water level recedes at a slower rate”. Although that definition is highly accepted and accurate, it is not clearly considering urban floods caused by raining. For the terms of this research, a flood is understood as the overflow of natural water bodies and/or the accumulation of water affecting areas commonly dry.
Floods are usually caused by prolonged rainfall, onshore winds, intense thunderstorms, snowmelt, ice jams, and dam failures (Haddow et al., 2008). These features show the inherent geographical nature of floods (Armenakis and Nirupama, 2013).
Source: Guha-Sapir et al. (2012) Figure 2.1. Natural disasters classification
2.2 Emergency management
Natural phenomenon originates emergency situations which societies have to address through ’emergency management‘. Emergency management is a very broad discipline focused on the analysis of risks in order to prevent them or deal with them, encompassing natural, man-made, sudden-onset and slow-onset disasters (Haddow et al., 2008).
Similar to the case of disasters and emergencies, disaster management is understood as a subset of emergency management. Disaster management represents "the range of activities, prior to, during and after the disasters, designed to maintain control over disasters and to provide a framework for helping at-risk persons and/or communities to avoid, minimise or recover from the impact of the disasters" (Singh, 2008). The difference between both concepts is related to scale, scope and time, but emergency management is a broader concept and this research will focus only on disaster management working within the umbrella of emergency management.