Visual attention modelling and applications. Towards
perceptual-based editing methods
Olivier Le Meur
To cite this version:
Olivier Le Meur. Visual attention modelling and applications. Towards perceptual-based
edit-ing methods. Image Processedit-ing. University of Rennes 1, 2014.
<
tel-01085936
>
HAL Id: tel-01085936
https://hal.inria.fr/tel-01085936
Submitted on 21 Nov 2014
HAL
is a multi-disciplinary open access
archive for the deposit and dissemination of
sci-entific research documents, whether they are
pub-lished or not.
The documents may come from
teaching and research institutions in France or
abroad, or from public or private research centers.
L’archive ouverte pluridisciplinaire
HAL
, est
destin´
ee au d´
epˆ
ot et `
a la diffusion de documents
scientifiques de niveau recherche, publi´
es ou non,
´
emanant des ´
etablissements d’enseignement et de
recherche fran¸
cais ou ´
etrangers, des laboratoires
publics ou priv´
es.
HABILITATION
´
A DIRIGER DES RECHERCHES
pr´esent´ee devant
L’universit´e de Rennes 1
Sp´ecialit´e : informatique
par
Olivier
Le Meur
Visual attention modelling and applications.
Towards perceptual-based editing methods
soutenue le 18/11/2014 devant le jury compos´e de :
PatrickBouth´emy, Directeur de recherche INRIA, France Pr´esident AnneGu´erin-Dugu´e, Professeur, Univ. de Grenoble, France Rapporteur PhilippeSalembier, Professeur, Univ. de Catalogne, Espagne Rapporteur LaurentItti, Professeur, Univ. de Californie du Sud, USA Rapporteur ´
EricMarchand, Professeur, Univ. de Rennes 1, France Examinateur PatrickLe Callet, Professeur, Univ. de Nantes, France Examinateur Fr´ed´ericDufaux, Directeur de recherche CNRS, France Examinateur
Contents
Detailed Curriculum Vitae vi
Introduction 1
I
Computational models of visual attention
4
1 Computational models 5
1.1 Introduction. . . 5
1.2 Taxonomy . . . 6
1.3 Our cognitive model for still images . . . 9
1.3.1 Global architecture . . . 10
1.3.2 Using prior knowledge: dominant depth and horizon line. 12 1.3.3 Time-dependent model for static pictures . . . 13
1.3.4 Robustness . . . 14
1.4 Model for video sequences . . . 16
1.5 Conclusion . . . 19
1.6 Contribution in this field. . . 20
2 Eye tracking datasets 22 2.1 Introduction. . . 22
2.2 Protocol . . . 23
2.2.1 Pixel Per Degree of visual angle. . . 23
2.2.2 Visual content . . . 24
2.2.3 With or without a task? . . . 26
2.2.4 Observers . . . 27
2.2.5 Viewing duration . . . 30
2.3 Comparative study of existing datasets. . . 30
2.3.1 Qualitative analysis . . . 30
2.3.2 Quantitative analysis. . . 33
2.3.3 Choosing appropriate test images . . . 40
3 Similarity metrics 44
3.1 Introduction. . . 44
3.2 Methods for comparing scanpaths. . . 44
3.2.1 String edit metric . . . 45
3.2.2 Mannan’s metrics. . . 46
3.2.3 Vector-based metrics . . . 47
3.3 Methods for comparing saliency maps . . . 48
3.3.1 Correlation-based measures . . . 49
3.3.2 The Kullback-Leibler divergence . . . 49
3.3.3 Receiver Operating Characteristic Analysis . . . 50
3.4 Hybrid method . . . 51
3.4.1 Receiver Operating Characteristic Analysis . . . 51
3.4.2 Normalized scanpath saliency . . . 53
3.4.3 Percentile . . . 54
3.4.4 The Kullback-Leibler divergence . . . 54
3.5 Benchmarking computational models . . . 56
3.6 Conclusion . . . 57
3.7 Contribution in this field. . . 58
II
Attention-based applications
59
4 Quality assessment 60 4.1 Introduction. . . 604.2 Visual attention and quality assessment . . . 60
4.3 Do video coding artifacts influence our visual attention? . . . 61
4.4 Free-viewing vs quality-task? . . . 62
4.5 Saliency-based quality metric . . . 62
4.6 Conclusion . . . 64
4.7 Contributions in this field . . . 65
5 Memorability 66 5.1 Introduction. . . 66
5.2 Memorability and eye-movement . . . 66
5.2.1 Method . . . 66
5.2.2 Results . . . 67
5.3 Memorability prediction . . . 70
5.3.1 Saliency map coverage . . . 71
5.3.2 Structures (visibility) . . . 72
5.4 Results. . . 73
5.5 Conclusion . . . 73
6 Inter-Observer Visual Congruency (IOVC)-based attractiveness.
Application to image ranking 75
6.1 Introduction. . . 75
6.2 System overview . . . 76
6.3 Measuring the inter-observer congruency . . . 76
6.4 Visual features used to predict attractivenes . . . 77
6.5 Learning: description and performance . . . 80
6.5.1 Learning. . . 80
6.5.2 Performance . . . 81
6.5.3 Limitations . . . 82
6.6 Image ranking based on attractiveness . . . 83
6.7 Conclusion . . . 84
6.8 Contribution in this field. . . 85
III
Examplar-based inpainting
86
7 Examplar-based Inpainting and its variants 87 7.1 Introduction. . . 877.2 Criminisi et al.’s algorithm [31] . . . 89
7.2.1 Filling order computation . . . 89
7.2.2 Texture synthesis. . . 90
7.2.3 Some results . . . 91
7.3 Variants of filling order computation . . . 91
7.3.1 Sparsity-based priority computation . . . 91
7.3.2 Structure tensor-based priority computation . . . 92
7.4 Variants of texture synthesis. . . 94
7.4.1 Finding the K nearest neighbours (K-NNs) . . . 95
7.4.2 Inferring the weights of the linear combination . . . 95
7.5 Conclusion . . . 100
7.6 Contributions in this field . . . 100
8 Hierarchical super-resolution-based inpainting 101 8.1 Introduction. . . 101
8.2 Combination of multiple examplar-based inpainting. . . 102
8.2.1 Inpainting method . . . 102
8.2.2 Combination methods . . . 103
8.2.3 Loopy Belief Propagation . . . 103
8.2.4 Comparison of the combination methods. . . 105
8.3 Super-resolution algorithm. . . 106
8.4 Experimental results . . . 107
8.5 Conclusion . . . 107
IV
Conclusion
110
9 General conclusions and perspectives 111
9.1 Perspectives in the modelling of visual attention . . . 111 9.2 Perspectives in image editing . . . 116 9.3 Perceptual-based editing . . . 117
Olivier Le Meur
Detailed Curriculum Vitae
Personal information
Date of birth February 27, 1975 Nationality French
Status Married, 3 children
Professional information
Position Associate Professor (HDR) in computer science and digital video at ESIR (Ecole Supérieure
d’Ingénieurs de Rennes),https://esir.univ-rennes1.fr/
Teaching
{ Compression standards
{ Image processing
{ Visual attention understanding and modelling
Research
interests { Visual perception and visual attention
{ Image editing - inpainting, colorization, super-resolution
{ Quality assessment
{ Video compression
Address IRISA, Campus de Beaulieu, 35042 Rennes Cedex - France Mobile +33 7 81 07 02 29 Phone +33 2 99 84 74 25 Fax +33 2 99 84 71 71 Email [email protected] Homepage people.irisa.fr/Olivier.Le_Meur/ Google
Scholar profile http://scholar.google.fr/citations?user=wl9Mj-8AAAAJ&hl=fr
Education
2014 Habilitation à Diriger des Recherches (HDR),University of Rennes 1, France.
Title: Visual attention modelling and applications. Towards perceptual-based editing methods
2002–2005 PhD Thesis,University of Nantes, France.
Supervisors: Prof. Dominique Barba and Prof. Patrick Le Callet. Title: Computational modelling of visual attention and applications
1996–1999 Master Degree in Computer Science,ENSSAT (Ecole Nationale Supérieure de Sciences
Appliquées et de Technologie), Lannion, France.
Experience
2009–Present Associate Professor in computer science and digital video, University of Rennes 1,
2005–2009 Team leader at Technicolor R&D.
The goal of the project I supervised concerned the modeling of the visual attention and its applications. Four peoples were involved in this project. The most important achievements concern on one hand the design of a computational model of visual attention and on other hand a saliency-based retargeting method. This method is currently embedded in a video compression scheme used for hand-held devices.
2002–2009 PhD Thesis at Technicolor R&D.
1999–2002 R&D Engineer at Grass Valley.
I was involved in the algorithm design for video compression scheme (MPEG-2 and MPEG-4).
Student supervision
PhD students
2014–2017 Hristina Hristova, (50%), Hristina works on examplar-based style transfer for video
sequences..
2012–2015 Nicolas Dhollande,(70%), Nicolas works on the optimization of the new video compression
standard HEVC in a context of ultra-high-definition. (Grant from Thomson Video Networks)..
2012–2015 Julio Cesar Ferreira, (20%), Julio works on super-resolution algorithms for multi-view
applications. [collaboration between Univ. Rennes 1 - Univ. Uberlandia Brazil, since Oct. 2013].
2011–2014 Darya Khaustova, (80%), Darya investigates the quality assessment of 3D content by
focusing more specifically on the visual deployment in 3D context. (Grant from Orange Labs).
2010–2014 Mounira Ebdelli,(40%), Mounira works on spatio-temporal inpainting for loss concealment
and video editing applications.
2009–2012 Josselin Gautier,(50%), Josselin has worked on three aspects of the 3D workflow:
com-pression of depth map, virtual view synthesis and visual attention in 3D context. Present-day position: post-doctoral fellowship at Anglia Ruskin university (UK).
2008–2012 Brice Follet,(50%), Brice has worked on the modeling of visual attention by using top-down
information. (Grant from Technicolor R&D).
2005–2008 Alexandre Ninassi,(50%), Alexandre has worked on the use of saliency maps in the context
of quality assessment. Intensive experiences have been conducted on video sequences both to assess their quality and to record eye movements. Present-day position: post-doctoral fellowship at ENSI CAEN. (Grant from Technicolor R&D).
Master students
2014 Hristina Hristova,Handling aesthetics in globally illuminated scenes. 2013 Julien Sicre,Aesthetic prediction.
2012 Alan Bourasseau,Super-resolution algorithms.
2011 David Wolinsky,Virtual View synthesis by extrapolation. 2010 Younesse Andam,Saliency-based data-pruning.
2008 Clément Rousseau,Video retargeting. 2007 Ayodeji Aribuki,H.264 video compression. 2006 Guillaume Courtin,Video retargeting. 2006 Olivier Gaborieau,H.264 video compression.
Participation of PhD defense committees
2015 Darya Khaustova,Univ. of Rennes 1, France, (co-supervisor). 2015 Liu Yi,INSA, France, (examinator).
2014 Antoine Coutrot,Univ. of Grenoble, France, (examinator). 2014 Jiayu Liang Gary,Univ. of Hong Kong, China, (examinator).
2014 Hamed Rezazadegan Tavakoli,Univ. of Oulu, Finland, (examinator). 2012 Josselin Gautier,Univ. of Rennes 1, France, (co-supervisor).
2012 Brice Follet,Univ. of Paris VIII, France, (co-supervisor). 2011 Matthias Pizzoli,Univ. of Roma, Italia, (examinator).
2010 Matthieu Perreira Da Silva,Univ. of la Rochelle, France, (examinator). 2009 Alexandre Ninassi,Univ. of Nantes, France, (co-supervisor).
2009 Alexander Bur,Univ. of Neuchatel, Switzerland, (examinator). 2007 Mattei Mancas,Univ. of Mons, Belgium, (examinator).
Scientific responsibilities
2012–2014 Scientific supervisor,(grant PIIF-GA-2011-299202 SHIVPRO).
I hosts a foreign researcher (Prof. Z. Liu) for 2 (+1) years in the context of Marie-Curie project (Grant Agreement PIIF-GA-2011-299202 SHIVPRO). The topic of this project is about computational model of visual attention on high-resolution video sequences as well as salient region detection.
2012–2016 Scientific excellence award (PES),rating : A.
2009–2013 PERSEE,ANR Project.
Perceptual coding for 2D and 3D contents. Person in charge : Vincent Ricordel (IRCCyN, Nantes). Collaborations : IRCCyN-Nantes, INRIA-Rennes, IETR-Rennes and le LTCI-TelecomParisTech.
2010–2013 ARSSO,ANR Project.
The ARSSO project focuses on multimedia content communication systems, characterized by more or less strict real-time communication constraints, within highly heterogeneous networks, and toward terminals potentially heterogeneous too. It follows that the transmission quality can largely differ in time and space. The solutions considered by the ARSSO project must therefore integrate robustness and dynamic adaptation mechanisms to cope with these features. Person in charge : Sylvaine Kerboeuf (Alcatel). Collaborations : INRIA-Grenoble-Rennes, CEA-LETI/LNCA, ALCATEL LUCENT BELL LABS, THALES Communications, EUTELSAT SA.
Referee IEEE Trans. On Image Processing, IEEE Trans. On CSVT, IEEE Trans. On Multimedia, Journal Of Vision, The Visual Computer, Cognitive Computation, Elsevier Image Communi-cation, Journal of Selected Topics in Signal Processing, IEEE Transactions on Multimedia Computing Communications and Applications, ICIP, ICME, WIAMIS, EUSIPCO, QoMex, DICTA.
Scientific production
Publications 20 journals, 37 conferences and 2 book chapters. The complete list is given at the end of this CV.
Top 3 most cited papers (according toGoogle Scholar (November 19, 2014)):
{ O. Le Meur, P. Le Callet, D. Barba, D. Thoreau,A coherent computational approach to
model bottom-up visual attention, IEEE Transactions on Pattern Analysis and Machine
Intelligence, Vol. 28(5), pp. 802-817, 2006 (cited by 368);
{ O. Le Meur, P. Le Callet, D. Barba,Predicting visual fixations on video based on low-level
visual features, Vision research, Vol. 47(19), pp. 2483-2498, 2007 (cited by 140);
{ A. Ninassi, O. Le Meur, P. Le Callet, D. Barba, Does where you gaze on an image
affect your perception of quality? Applying visual attention to image quality metric, IEEE
International Conference on Image Processing, pp. 169-172, 2007 (cited by 108).
Bibliometrics According to theGoogle Scholar web site, my H-index is equal to 18 (on November 19,
Special
sessions { Technical Program Committee (TPC), DICTA 2014, QoMex 2014, EUVIP 2014, ICIP
2014, ICME 2014, ICME 2015.
{ Co-organization (with Prof. Z. Liu (Shanghai University)) of a special session on visual
attention at the conference, ICME 2014
{ Co-organization (with Prof. Z. Liu (Shanghai University)) of a special session on visual
attention at the conference WIAMIS 2013.
{ Co-organization (with M. Mancas (Mons University)) of a special session on visual attention
at the conference SPIE Photonics Europe 2012.
{ Co-organization (with Prof. P. Le Callet (Nantes University)) of a special session on visual
attention at the conference ICIP 2009, Egypte. Special issue
{ Special Issue in Signal Processing: Image Communication. Title: Recent Advances in
Saliency Models, Applications and Evaluations. Guest editors: Zhi Liu, Olivier Le Meur, Ali Borji & Hongliang Li. Submission deadline December 2014.
Invited talks
{ UESTC(University of Electronic Science and Technology of China), School of Electronic Engineering, Chengdu, China. Prof. Bing ZENG and Prof. Hongliang LI. Title of the talk: examplar-based inpainting methods, July 2014.
{ Sichuan University, Chengdu, China. Prof. Qionghua WANG. Title of the talk: examplar-based inpainting methods, July 2014.
{ National Research Group (GdR), Information Signal Image viSion (ISIS). Special session
on visual attention. Title of the talk: Modelling the visual scanpath, 19thJune 2014.
{ Invited plenary speaker atKÉPAF 2013(National conference of the Hungarian Association
for Image Processing and Pattern Recognition).
{ Presentation of my visual attention work atLUTIN(Cité de la science, Paris), 2013.
Languages
French Mothertongue
English Fluent
Publication list
Chapters
1. T. Baccino, O. Le Meur, B. Follet,La vision ambiante-focale dans l’observation de scènes visuelles,
book chapter inA perte de vue les nouveaux paradigmes du visuel, Presse du réel, to be published in 2014.
2. L. Morin, O. Le Meur, C. Guillemot, V. Jantet, J. Gautier, Synthèse de vues intermédiaires, book
chapter in,Vidéo 3D: Capture, traitement et diffusion, Lucas L., Loscos C. et Remion Y. (Editors), Hermès,
2013.
Journal papers [IF=Impact Factor]
1. Z. Liu, W. Zou and O. Le Meur,Saliency Tree: A Novel Saliency Detection Framework, IEEE Trans.
On Image Processing, vol. 23, no. 5, pp. 1937-1952, May 2014 [IF=3.042].
2. Z. Liu, X. Zhang, S. Luo and O. Le Meur,Superpixel-Based Spatiotemporal Saliency Detection, IEEE
Trans. on Circuits and Systems for Video Technology, vol. 24, no. 9, pp. 1522-1540, Sep. 2014 [IF=2.259].
3. Z. Liu, W. Zou, L. Li, L. Shen and O. Le Meur,Co-saliency detection based on hierarchical
segmen-tation, IEEE Signal Processing Letters, Vol. 21(1), 2014 [IF=1.674].
4. C. Guillemot, O. Le Meur,Image inpainting: overview and recent advances, IEEE signal processing
5. C. Guillemot, M. Turkan, O. Le Meur and M. Ebdelli, Object removal and loss concealment using neighbor embedding methods, Elsevier Signal Processing: Image Communication, 2013.
6. O. Le Meur, M. Ebdelli and C. Guillemot,Hierarchical super-resolution-based inpainting, IEEE Trans.
On Image Processing, Vol. 22(10), pp. 3779-3790, 2013. [IF=3.042].
7. Z. Liu, O. Le Meur, S. Luo and L. Shen,Saliency detection using regional histograms, Optics Letters,
Vol. 38(5), March 2013 [IF=3.39].
8. O. Le Meur and T. Baccino,Methods for comparing scanpaths and saliency maps: strengths and
weaknesses, Behavior Research Method, Vol. 45(1), pp. 251-266, March 2013. [IF=2.4]
9. J. Gautier and O. Le Meur,A time-dependent saliency model mixing center and depth bias for 2D
and 3D viewing conditions, Cognitive Computation 2012.
10. B. Follet, O. Le Meur and T. Baccino,New insights on ambient and focal visual fixations using an
automatic classification algorithm, i-Perception, Vol. 2(6), pp. 592-610, 2011.
11. F. Urban, B. Follet, C. Chamaret, O. Le Meur and T. Baccino,Medium spatial frequencies, a strong
predictor of salience, Cognitive Computation, Vol.3, Issue 1, pp. 37-47, 2011 (Special issue on Saliency, Attention, Active Visual Search, and Picture Scanning).
12. B. Follet, O. Le Meur and T. Baccino, Modeling visual attention on scenes, Studia Informatica
Universalis, Vol. 8, Issue 4, pp. 150-167, 2010
13. O. Le Meur, A. Ninassi, P. Le Callet and D. Barba,Do video coding impairments disturb the visual
attention deployment?, Elsevier, Signal Processing: Image Communication, Vol. 25, Issue 8, pp. 597-609, September 2010. [IF=0.836].
14. O. Le Meur, A. Ninassi, P. Le Callet and D. Barba,Overt visual attention for free-viewing and quality
assessment tasks. Impact of the regions of interest on a video quality metric, Elsevier, Signal Processing: Image Communication, vol. 25, Issue 7, pp. 547-558, 2010. [IF=0.836]
15. O. Le Meur and J.C. Chevet,Relevance of a feed-forward model of visual attention for goal-oriented
and free-viewing tasks, IEEE Trans. On Image Processing, Vol. 19(11) pp. 2801-2813, 2010. [IF=3.315]
16. O. Le Meur, S. Cloarec and P. Guillotel, Automatic content repurposing for Mobile applications,
SMPTE Motion Imaging journal, January/February 2010.
17. A. Ninassi, O. Le Meur, P. Le Callet and D. Barba,Considering temporal variations of spatial visual
distortions in video quality assessment, IEEE Signal Processing Special Issue On Visual Media Quality Assessment, 2009.
18. O. Le Meur, P. Le Callet and D. Barba,Predicting visual fixations on video based on low-level visual
features, Vision Research, Vol. 47(19), pp 2483-2498, 2007. [IF=2.05]
19. O. Le Meur, P. Le Callet and D. Barba,Construction d’images miniatures avec recadrage automatique
basée sur un modèle perceptuel bio-inspiré, Numéro spécial de la Revue Traitement du Signal (TS), Systèmes de traitement et d’analyse des Images, Vol.24(5), pp. 323-336, 2007.
20. O. Le Meur, P. Le Callet, D. Barba and D. Thoreau,A coherent computational approach to model
the bottom-up visual attention, IEEE Trans. on Pattern Analysis and Machine Intelligence, Vol. 28(5), pp. 802-817, May 2006 [IF=4.3]
Conference papers
1. O. Le Meur and Z. Liu,Saliency aggregation: Does unity make strength?, ACCV, 2014.
2. L. Li, Z. Liu, W. Zou, X. Zhang and O. Le Meur,Co-saliency detection based on region-level fusion
and pixel-level refinement, ICME, 2014.
3. N. Dhollande, O. Le Meur and C. Guillemot, HEVC intra coding of Ultra HD video with reduced
complexity, ICIP, 2014.
4. J.C. Ferreira, O. Le Meur, E.A.B. da Silva, G.A. Carrijo and C. Guillemot,Single image super-resolution
using sparse representations with structure constraints, ICIP, 2014.
5. D. Khaustova, J. Founier, E. Wyckens and O. Le Meur, Investigation of visual attention priority in
selection of objects with texture, crossed, and uncrossed disparities in 3D images, HVEI, 2014.
6. D. Wolinski, O. Le Meur and J. Gautier,3D view synthesis with inter-view consistency, ACM Multimedia
2013.
7. Z. Liu and O. Le Meur,Superpixel-based saliency detection, WIAMIS 2013.
spatial information, EUVIP, 2013.
9. M. Mancas and O. Le Meur,Memorability of natural scenes: the role of attention, ICIP 2013.
10. C. Guillemot, M. Turkan, O. Le Meur and M. Ebdelli,Image inpainting using LLE-LDNR and linear
subspace mappings, ICASSP 2013.
11. M. Ebdelli, O. Le Meur and C. Guillemot, Image inpainting using LLE-LDNR and linear subspace mappings, ICASSP 2013.
12. D. Khaustova, , J. Fournier, E. Wyckens, O. Le Meur,How visual attention is modified by disparities
and textures changes, SPIE HVEI 2013
13. O. Le Meur and C. Guillemot,Super-resolution-based inpainting, ECCV 2012. [Acceptance Rate=25
14. M. Ebdelli, O. Le Meur and C. Guillemot,Loss Concealment Based on Video Inpainting for Robust
Video Communication, EUSIPCO 2012.
15. M. Ebdelli, C. Guillemot and O. Le Meur,Examplar-based video inpainting with motion-compensated
neighbor embedding, ICIP 2012.
16. J. Gautier, O. Le Meur and C. Guillemot,Efficient Depth Map Compression based on Lossless Edge
Coding and Diffusion, PCS 2012.
17. O. Le Meur, T. Baccino and A. Roumy,Prediction of the Inter-Observer Visual Congruency (IOVC)
and application to image ranking, ACM Multimedia (long paper) 2011. [Acceptance Rate=17
18. B. Follet, O. Le Meur and T. Baccino, Features of ambient and focal fixations on natural visual
scenes, ECEM 2011.
19. O. Le Meur, Robustness and Repeatability of saliency models subjected to visual degradations,
ICIP 2011.
20. O. Le Meur, J. Gautier and C. Guillemot,Examplar-based inpainting based on local geometry, ICIP
2011.
21. J. Gautier, O. Le Meur and C. Guillemot,Depth-based image completion for View Synthesis, 3DTV
Conf. 2011.
22. O. Le Meur,Predicting saliency using two contextual priors: the dominant depth and the horizon
line, IEEE International Conference on Multimedia & Expo (ICME 2011) 2011 [Acceptance Rate=30
23. C. Chamaret, O. Le Meur and J.C. Chevet, Spatio-temporal combination of saliency maps and
eye-tracking assessment of different strategies, ICIP, pp. 1077-1080, 2010 [Acceptance Rate=47
24. C. Chamaret, O. Le Meur, P. Guillotel and J.C. Chevet,How to measure the relevance of a retargeting
approach?, Workshop Media retargeting, ECCV 2010.
25. C. Chamaret, S. Godeffroy, P. Lopez and O. Le Meur,Adaptive 3D Rendering based on
Region-of-Interest, SPIE 2010.
26. O. Le Meur and P. Le Callet,What we see is most likely to be what matters: visual attention and
applications, ICIP, pp. 3085-3088, 2009 [Acceptance Rate=45
27. C. Chamaret and O. Le Meur,Attention-based video reframing: validation using eye-tracking, ICPR,
2008.
28. A. Ninassi, O. Le Meur, P. Le Callet, D. Barba,Which Semi-Local Visual Masking Model For Wavelet
Based Image Quality Metric?, ICIP, 2008.
29. A. Ninassi, O. Le Meur, P. Le Callet, D. Barba, Does where you gaze on an image affect your
perception of quality? Applying visual attention to image quality metric, ICIP, 2007.
30. A. Ninassi, O. Le Meur, P. Le Callet, D. Barba,Task impact on the visual attention in subjective
image quality assessment, EUSIPCO, 2006.
31. O. Le Meur, X. Castellan, P. Le Callet, D. Barba,Efficient saliency-based repurposing method, ICIP,
2006.
32. O. Le Meur, P. Le Callet, D. Barba, D. Thoreau,A human visual model-based approach of the visual
attention and performance evaluation, SPIE HVEI, 2005.
33. O. Le Meur, P. Le Callet, D. Barba, D. Thoreau,Modélisation spatio-temporelle de l’attention visuelle,
CORESA, 2005.
34. O. Le Meur, P. Le Callet, D. Barba,Masking effect in visual attention modeling, WIAMIS, 2004.
35. O. Le Meur, P. Le Callet, D. Barba, D. Thoreau, E. Francois,From low level perception to high level
36. O. Le Meur, P. Le Callet, D. Barba, D. Thoreau,Performance assessment of a visual attention system entirely based on a human vision modelling, ICIP, 2004.
37. O. Le Meur, P. Le Callet, D. Barba, D. Thoreau,Bottom-up visual attention modeling : quantitative
Introduction
Over the last twenty years we have been experiencing an explosion of the num-ber of captured images and videos. Social Web Communities such as Flickr, Youtube, Facebook and Instagram have collected a huge amount of photos and videos. Among the majors, Facebook is probably the largest. More than 250 billion photos have been uploaded on the social network site, and more than 350 million photos are uploaded every day on average [48]. At the end of 2011, the database of the company Instagram included over than 400 million photos with an upload rate of 60 images per second [78].
The exploitation of this massive amount of data users share requires ad-vanced algorithms which could help organize and browse efficiently the con-tents. These problems fall with our domain of expertise. Recent work in this area concentrates on the link between computer vision and cognitive science. My research is part of this effort and focuses on the understanding and mod-elling of human visual attention and its applications in image editing.
This manuscript which constitutes a synthesis document of my research in preparation for my Habilitation degree (Habilitation `a Diriger des Recherches) presents the most important outcomes of my research. Since my PhD degree in September 2005, I have been working on two main research themes which are the visual attention and saliency-based image editing. Before delving into the details of my research, a brief presentation of the visual attention and saliency-based image editing is made.
Visual attention: our visual environment contains much more information than we are able to perceive at once. To deal with this large amount of data, human beings have developed biological mechanisms and visual strategies to optimize the visual treatment. Out of those, the visual attention is probably the most important one. It allows to concentrate our biological resources over the most important parts of the visual field. Two kinds of visual attention have been identified: the covert and the overt visual attention. The former does not involve eye movements and refers to the act of mentally focusing on a particular area. The latter, involving eye movements, is used both to ex-plore complex visual scenes and to direct the gaze towards interesting spatial locations. A number of studies [50] have shown that, in most circumstances,
overt shifts of attention are mainly associated with the execution of saccadic eye movements. Overt attention of attention is often compared to a windows to the mind. Saccade targeting is indeed influenced by top-down factors (the task at hand, behavioral goals, motivational state) and bottom-up factors (both the local and global spatial properties of the visual scene). The bottom-up mech-anism, also called stimulus-driven selection, is the core of my research dealing with the visual attention. It occurs when a target item effortlessly attracts the gaze. My research consists in understanding and modelling this mechanism.
Saliency-based image editing: the high-level definition of image editing (as stated by Wikipedia) is the following: image editing encompasses the pro-cesses of altering images. These processes refer to color adjustments, histogram manipulation, noise reduction, inpainting, just to name a few. My research focusses on the use of the visual attention into image editing algorithms. As we will see, computational models of visual attention predict the most visually important areas within a scene. From an input picture, these models output a 2D saliency map which is a grey level map where the brighter areas indicate the highest saliency. Saliency-based image editing consists in altering images in function of the saliency map. To illustrate this general idea, an example is the retargeting approach (one of my former work which is not presented in this manuscript). The idea is to adapt automatically traditional contents to the spe-cific constraints of small screen devices in order to provide users with the best possible viewing experience. The saliency map is in this case used to define the cropping window which should enclose as much as possible the saliency. Rather than displaying the whole content, only the content enclosed by the bounding box is displayed (for more details reader could refer to [110,106]).
This documents is organized into four parts. The first three parts correspond to a research orientation. These parts are composed of several chapters which all include a short review of background material and our contributions in the given field. At the end of each chapter, we give the list of our scientific con-tributions. The link between these research orientations is made in the fourth part which presents my research perspectives. Note that, to ease the reading, parts as well as chapters are self-contained.
The first part is devoted to the theme of visual attention which was at the core of my Ph.D. work. This part is composed of 3 chapters dealing with the modelling of visual attention, eye tracking datasets and similarity metrics. Chapter1 addresses the computational models of visual attention. A brief re-view of state-of-the-art models is first given before describing our main contribu-tions. Chapter2presents methodological and practical guidelines for those who want to conduct an eye-tracking experiment. Parameters such as the cultural background, age, number of subjects, viewing duration, etc were discussed from the viewpoint of quality and bias effect for the eye tracking data. In addition, important points are emphasized such as the estimation of the inter-observers dispersion and center bias. In Chapter3 we present a comprehensive review of
metrics used to evaluate the similarity degree between a ground truth (human saliency map or eye fixation data) and a prediction. Strength and limitations were discussed leading to some recommendations.
In the second part we report the research results on saliency-based appli-cations. This part is composed of three chapters. In Chapter 4 we report the research results devoted to quality assessment. In fact, we investigated the link between quality assessment and visual attention. The underlying idea is to adjust the computation of quality score in function of the degree of interest rep-resented by a saliency map. Extensive experiments have been done in order to establish the extent to which visual attention and quality are linked. Chapter5
deals with a very recent research avenue regarding the prediction of how much an image is memorable. This research has been initiated by [79]. In [126], we performed eye tracking experiments to establish a link between visual attention and memorability. From the experiment outcome, we have proposed a new set of features to estimate the memorability of pictures. The last chapter6presents a machine learning application which predicts automatically the attractiveness score of an image. A model is trained by using eye data considering that the dispersion between observers is low when there is something in the picture that draws our attention. Thanks to this model, we can sort out a bunch of pictures according to their degree of attractiveness.
The third part addresses image inpainting. This part is composed of two chapters. Chapter7 provides a comprehensive review of methods used to per-form an examplar-based inpainting. Chapter8presents my most recent contri-bution in this research theme. The proposed method allows to deal with two limitations of examplar-based methods. The first one is the high sensitivity to parameters setting whereas the second is related to the fact that most of current methods are greedy.
At first glance, this research theme likely appears as rather ‘distant’ from the two previous themes. However methods and algorithms developed in this theme will be at the design basis of perceptual-based image editing methods as explained in the last chapter of this manuscript. The last chapter of the manuscript draws conclusions and provides new avenues for my research. They are grouped into 3 axes: visual attention, image editing and perceptually-based image editing.
Part I
Computational models of
visual attention
Chapter 1
Computational models
1.1
Introduction
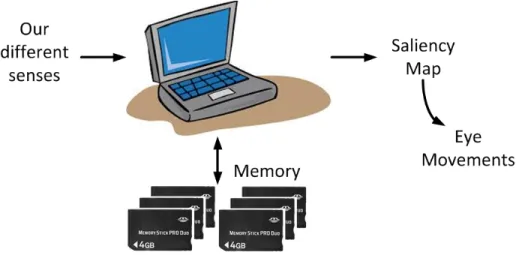
Computational saliency models are designed to predict where we look within a visual scene. Most of them are based on the assumption that there exists an unique saliency map in the brain. This saliency map, also called master map, aims at indicating where the most visually important areas are located. This is a comfortable view for computer scientist since the brain is compared to a computer as illustrated by figure1.1. The inputs would come from our differ-ent senses whereas our knowledge would be stored in the memory. The output would be the saliency map which is used to guide the deployment of attention over the visual space.
Figure 1.1: The brain as a computer, an unrealistic but convenient hypothesis.
models have been proposed. In section1.2, we present a taxonomy and briefly describe the most influential computational models of visual attention. We will also describe our contributions in this field (section1.3) which are related to robustness, the use of prior knowledge and dynamic saliency map for still pictures. The extension to video sequences is also discussed in section 1.4. We will conclude this chapter by emphasizing the strengths and limitations of current models.
1.2
Taxonomy
Since 1998, the year where the first computational and biologically plausible model of bottom-up visual attention was published by L. Itti, C. Koch and E. Niebur [84], there has been a growing interest on the subject. Indeed, several models, more or less biological and based on different mathematical tools, have been investigated. We proposed in 2009 a first saliency models taxonomy [108] which has been significantly improved and extended by Borji and Itti [13]. The taxonomy is composed of 8 categories as illustrated by figure1.2(extracted from [13]). A comprehensive description of these categories is given in [13]. Here we just give the main features of the four most important ones:
• Cognitive models: models belonging to this category rely on two sem-inal works: the Feature Integration Theory (FIT) [166] and a biological plausible architecture [97] for the computation of saliency map.
The former relies on the fact that some visual features (called early visual features) are extracted automatically, unconsciously, effortlessly, and very early in the perceptual process. These features such as color, orientation, shape to name a few are automatically separated in parallel throughout the entire visual field. From the FIT, the first biological conceptual ar-chitecture has been proposed by Koch and Ullman [97]. This allows the computation of saliency map based on the assumption that there exists in the brain a single topographic saliency map. Models of this category follow a three-step approach: From an input picture, several early visual features are first extracted in a massively parallel manner, leading to one feature map per channel. A filtering operation is then applied on these maps in order to filter out most of the visually irrelevant information. Then, these maps are mixed together to form a saliency map.
Some of our contributions are framed within this category, as pointed out by red arrows on figure1.2.
• Information theoretic models: these models are grounded on a prob-abilistic approach. The assumption is that a rare event is more salient than a non rare event. The mathematical tool that can simply simu-late this behaviour is the self-information. Self-information is a measure of the information amount carried out by an event. For a discrete ran-dom variable X, defined by A = {x1, ..., xN} and a probability density
Figure 1.2: Taxonomy of computational model of visual attention. Courtesy of Borji and Itti [13].
I(X=xi) =−log2(p(X =xi)) bit/symbol.
The first model based on this approach has been proposed by Oliva et al. [137]. Bottom-up saliency is given by
S= 1
p(F|G) (1.1) where, F denotes a vector of local visual features observed at a given
location while G represents the same visual features but computed over the whole image. When the probability to observeF given Gis low, the saliencyS tends to infinity. This approach has been re-used and adapted by a number of authors. The main modification is related to the support used to compute the probability density function:
– Oliva et al. [137] determine the probability density function over the whole picture.
– In [20] and [56], the saliency depends on the local neighbourhood from which the probability density function is estimated. The self-information [20] or the mutual information [56] between the proba-bility density functions of the current location and its neighbourhood are used to deduce the saliency value.
– A probability density function is learnt on a number of natural image patches. Features extracted at a given location are then compared to this prior knowledge in order to infer the saliency value [189].
• Bayesian models: the Bayesian framework is an elegant method to com-bine current sensory information and prior knowledge concerning the en-vironment. The former is simply the bottom-up saliency which is directly computed from the low-level visual information whereas the latter is re-lated to the visual inference, also called prior knowledge. This refers to the statistic of visual features in natural scene, its layout, the scene’s cat-egory or its spectral signature to name a few. This prior knowledge which is shaped by our visual environment is one of the most important factors influencing our perception. It acts like a visual priming facilitating the scene perception and steering our gaze to specific parts.
There exist a number of models using prior information, the most well known being the Theory of Surprise [81], Zhang’s model [189], Oliva et al. [137].
• Spectral analysis models: This kind of model has been proposed in 2007 by Hou and Zhang [75]. The saliency is derived from the frequency domain based on the following assumption: the statistical singularities in the spectrum may be responsible for anomalous regions in the image, where proto-objects are popped up. From this assumption, they defined the spectral residual of an image which is the difference on a log amplitude scale between the amplitude spectrum of the image and its lowpass filtered version. This residual is considered as being the innovation of the image in the frequency domain. The saliency map in the spatial domain is obtained by applying the inverse Fourier transform. The whole process for an image
I is given below: A(f) = R(F[I(x)]) (1.2) P(f) = φ(F[I(x)]) (1.3) L(f) = log(A(f)) (1.4) E(f) = L(f)−h(f)∗ L(f) (1.5) S(x) = g(x)∗ F−1[exp(E(f) +P(f))]2 (1.6)
where, f is the radial frequency. F and F−1 represent the direct and
inverse Fourier transform, respectively. A and P are the amplitude and phase spectrum obtained throughRandφrespectively. handg are two low-pass filters. This first approach has been further extended or modi-fied by taking into account the phase spectrum instead of the amplitude one [65], quaternion representation and multiresolution approach [66].
1.3
Our cognitive model for still images
In 2006, we proposed a computational model of bottom-up visual attention [110]. The motivations were twofold.
The first one was simply to improve and to deal with the issues of the semi-nal work of L. Itti [84]. The most important drawback of Itti’s model concerns the combination and the normalization of the feature maps which come from different modalities. In other words, the question is how to combine color, lu-minance and orientation information to get a saliency value. A simple and efficient method is to normalize all feature maps in the same dynamic range (e.g. between 0 and 255) and to sum them into the saliency map. Although efficient, this approach does not take into account the relative importance and the intrinsic features of one dimension compared to another.
The second motivation was our willingness to incorporate into the model important properties of the Human Visual System (HVS) which were rather ne-glected. These properties are related to the limited sensitivity of the HVS (we do not perceive all information present in the visual field with the same accu-racy). They are simulated by Contrast Sensitivity Function and visual masking.
In the following sections, the global architecture of the proposed modelling is described as well as its main components. Its robustness to degraded pictures is presented. Then we will focus on two important improvements which are on one hand the use of high-level visual information and in the other hand the computation of a time-dependent saliency map.
1.3.1
Global architecture
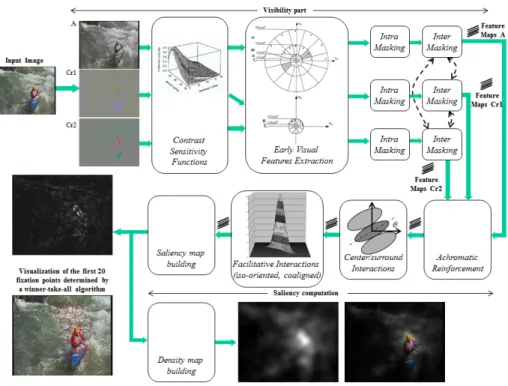
Figure 1.3 illustrates the global architecture of the proposed model which is composed of two main parts, the visibility part and the saliency computation part. They are briefly described below. Readers could find more details in [110]. The visibility part aims to express visual information in terms of visibility threshold. The R, G and B components of the input picture are first transformed into an opponent-color space from which three components{A, Cr1, Cr2}
rep-resenting the achromatic, the blue-yellow and the red-green signals respectively are obtained. Contrast Sensitivity Functions (CSF) and visual masking are then applied in the frequency domain on the three components of the color space. The former normalizes the dynamic range of{A, Cr1, Cr2}in terms of visibility
threshold. Visual masking is then applied in order to take into account the influence of the spatial context on the visibility threshold. The visibility thresh-old of a given area tends to increase when its local neighbourhood is spatially complex. The 2D spatial frequency domain is then decomposed into a number of subbands which may be regarded as the neural image corresponding to a population of visual cells tuned to both a range of spatial frequency and ori-entation. These decompositions defined by psychophysics experiments leads to 17 channels for the achromatic component and only 5 channels for chromatic components.
Once the visual information has been coherently normalized, the second stage of the model consists in detecting the visually relevant parts of the image. Three operations are involved: chromatic-based reinforcement of the achromatic structures, center-surround filtering and perceptual grouping. The objective of these operations is summarized below:
• The chromatic-based reinforcement increases the magnitude of each site of the achromatic channels when the current site is surrounded by a high color contrast.
• The surround filter removes redundant information. The center-surround organization simulates the receptive fields of visual cells. These two regions provide an opposite response for the same stimulation.This fil-ter is insensitive to uniform illumination and strongly respond on contrast. A difference of Gaussian, also called Mexican hat, is used to simulate the behaviour of visual cells.
• Perceptual grouping refers to the human visual ability to group and bind visual features to construct a meaningful higher-level structure. Here the perceptual grouping is a facilitative interaction based on the Gestalt prin-ciples of colinearity and proximity.
The filtered subbands are then combined into a unique saliency map. There exist a number of pooling strategies. In [25], seven feature combination strategies have been presented and evaluated. They are listed and briefly described below:
Figure 1.3: Architecture of the proposed model of bottom-up visual attention.
• NS, Normalization and Sum: This is the most simple method consisting in normalizing and summing all subbands into the final saliency map.
• NM, Normalization and Maximum: Compared to NS method, the sum-mation is replaced by the maximum operator.
• CNS, Coherent Normalization and Sum: To normalize the subbands, the maximum saliency value for each visual dimension is empirically deter-mined on a set of test pictures. These values are then used to perform the normalization.
• CNM, Coherent Normalization and Maximum: Compared to CNS method, the summation operator is replaced by the maximum operator.
• CNSP, Coherent Normalization, Sum plus Product: The idea here is to deal with the redundancies between feature maps. In other words, an item which would generate saliency in several visual dimensions should be more salient than an item generating saliency in only one dimension.
• CNMC, Coherent Normalization, intra and inter Map Competition: the CNSP approach is upgraded by using a WTA (Winner-Take-All) algorithm with localized inhibitory spread. The local maxima are then detected and
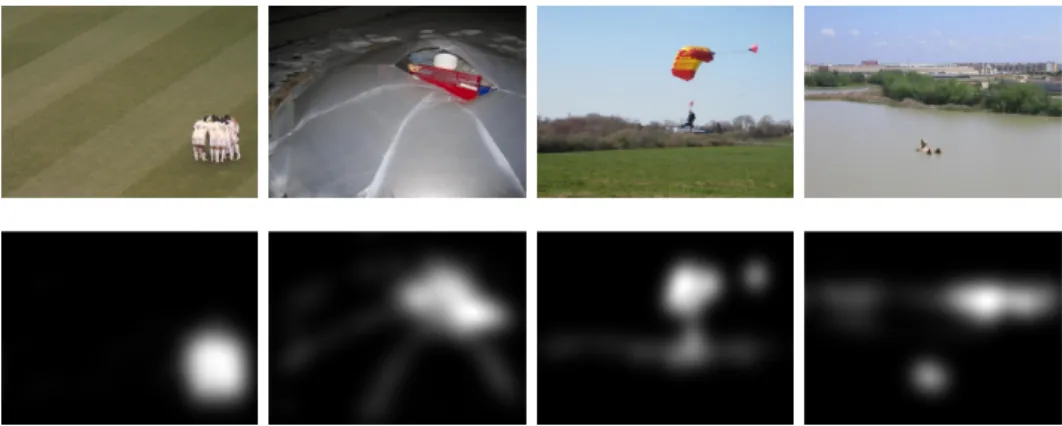
Figure 1.4: Examples of saliency maps predicted by the proposed model. Top: original images; Bottom: predicted saliency maps.
used to locally favour some parts of the picture. The number of maxi-mum peaks, their values and the difference value between two consecutive maximum peaks are required to keep only the most interesting areas.
• GNLNS, Global Non-Linear Normalization followed by Normalization: This method implemented by L. Itti [83] consists in promoting the maps having few saliency peaks. This approach removes the maps having an uniform distribution or a high number of saliency peaks.
Figure1.4illustrates saliency maps computed by the proposed method (a simple fusion (NS) is here used). Saliency models perform well on this kind of images for which there is salient object on a simple background. Model performance significantly decreases in presence of high-level information [91] such as faces (whether they are human or animal, real or cartoon, frontal or sideways, masked or not, in focus or blurry), text (whether its font, size, quality) and horizon line which strongly attracts our attention [53]. Model performance is also low when the dispersion between observers is high (for more details, readers could refer to Chapter2).
The natural step for improving the performance of saliency models is to take into account higher-level information. In the next section, we present an extension of our cognitive model.
1.3.2
Using prior knowledge: dominant depth and horizon
line
In 2011, we improve the model performance [102] by inferring from low-level vi-sual features two contextual information: the dominant depth and the position of the horizon line (if any).
for processing information about different visual properties [166]. These prop-erties would be processed very quickly and unconsciously. The depth feature is one of them. We are indeed able to perceive the depth effortlessly. The most striking is that, even when we look at a picture, we are able to extrapolate the depth. As depth information is quickly available, this prior knowledge might affect eye movements. For instance, depth might contribute to an early recog-nition of the scene layout. In addition, from the knowledge of the dominant depth value, the average size of salient areas might be inferred. This property is used in the final pooling of the filtered subband. Given a dominant depth value, some subbands are favoured to get the final saliency map. The assumption is salient features are more likely to be present in low spatial frequencies for close-up scenes. For panoramic scenes, it might be more interesting to consider high frequencies than low spatial ones.
Foulsham et al. [53] provided evidence that the natural horizon line system-atically attracts our visual attention. The position of the horizon line is then inferred from the low-level visual features to be used as a contextual prior. We simply propose to weight the final saliency map according to the spatial position of the horizon line.
We found [102] that the dominant depth does not bring a significant improve-ment when compared to a naive model. Regarding the horizon line, the median gain is of 2% in terms of AUC (Area Under Curve, see Chapter3for details).
1.3.3
Time-dependent model for static pictures
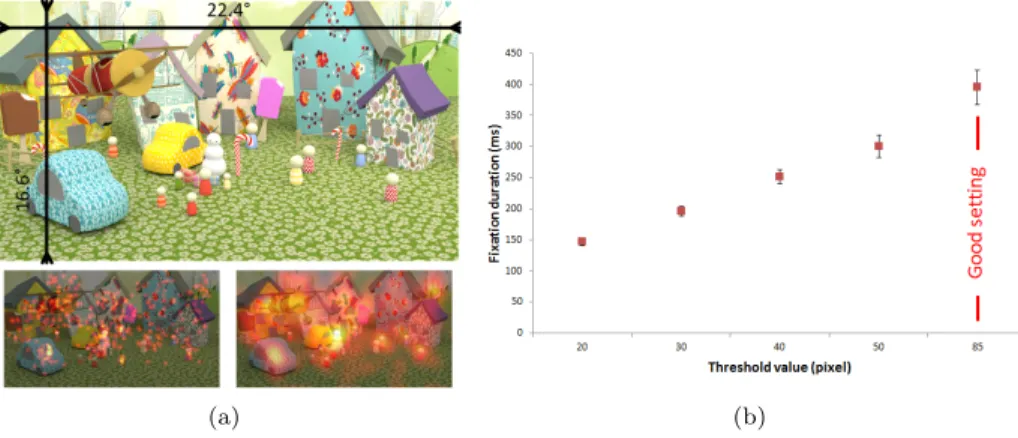
As previously mentioned, a number of computational models have been proposed to predict where we look. They all follow the same idea: a static picture is fed into the model which outputs a static saliency map. This map is supposed to represent the most visually salient parts of the scene. Although very easy and convenient to use, a static saliency map is not able to grasp the variety and complexity of visual guiding sources. Their influences can indeed increase or decrease over time. Moreover they are not necessarily concomitant but time-dependent. Some occurs after the stimulus onset, others appear after several second of viewing.
In 2012, we have designed a time-dependent saliency model [57] which outputs a video sequence of saliency maps from a static input picture. The problem is formalized as follow: S(x, t) = K X k=1 pk(t)φk(x) (1.7)
where K is the number of visual guiding source, φk is a normalized 2D map
representing the sourcekandpk(t) is the weight associated to the sourcekat a
given timet. Compared to a traditional approach such as the naive summation (NS) presented in section 1.3.1, the difference lies in the presence of the time variablet.
• Bottom-up saliency map: this source represents the influence of low-level visual features on the gaze deployment. Several models (Itti [84], Bruce [20] and our model [110]) were used to compute this saliency map.
• Center bias: The strongest bias underlined by laboratory experiments is the central bias, also called re-centering bias. This is the tendency of observers to look at the screen’s center whatever its interest (see chapter2
section2.3.2for more information)
• Foreground and background maps: based on the fact that we are able to segment easily and quickly the figure from the ground, the depth map is split into two depth maps, one for the foreground and another for the background. To get these maps, the incoming depth map is thresh-olded at half the depth value through a sigmoid function, such that pixels values smaller and higher than 128 rapidly cancel out on background and foreground, respectively. Background values are modified such that the farther a point is in the background, the more it contributes to the back-ground feature. At the opposite end, the closer a pixel is to the foreback-ground, the more it contributes to foreground feature.
• Uniform map: to account for other guidance sources or top-down in-fluences which could likely occur over time, an additional feature map, called uniform map, is used. For this map, all locations have the same probability to be fixated.
The weights pk(t) of the linear combination presented by equation 1.7 are
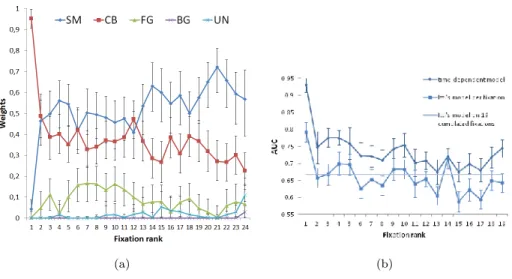
inferred by an Expectation-Minimization algorithm. Figure 1.5 (a) gives the evolution of weights in function of the fixation rank. The most influent factor is the predicted low-level saliency. The central bias is strong and paramount on first fixation and decreases to a stable level from the third fixation. The foreground feature plays a non negligible role up to the 17th fixations. At the
opposite, the background feature is not a major guiding source of the visual attention. Finally, the contribution of the uniform distribution term remains low up to the late time of visualization. It models the influence of other high-level factors possibly due to top-down mechanisms that are not accounted by our proposed factors.
Once the weights have been estimated, the time-dependent saliency map is compared to Itti’s model. Figure1.5 (b) illustrates the results. The proposed model performs significantly better than Itti’s model over time. The metric used for the evaluation is the AUC value (hit rate, see section3.4for more details).
1.3.4
Robustness
The invariance of saliency models subjected to degradation is important espe-cially in the context of quality assessment and compression. The robustness of saliency models has been investigated in 2011 [103].
(a) (b)
Figure 1.5: (a) Temporal contributions (weights) of 5 features as a function of the fixation rank (SM: Salieny Map; CB: Center Bias: FG: Foreground; BG: Background; UN: Uniform). The error areas at 95% are computed by a bootstrap estimate (1,000 replications). (b) Evaluation of the performance with Itti’s model.
the quality of a set of pictures. Figure1.6illustrates some of them applied on a given picture. The degradation operations are listed below:
• Blur: a Gaussian kernel of size 11×11 is used. Three values of variance are used: 1, 3 and 8. Obviously, the bigger the variance value the greater the smoothing produced.
• Uniform variation of illumination: the RGB components of the pic-tures are weighted by a fixed coefficient (0.2, 0.6, 1.4, 1.8). Coefficients greater than 1 tend to lighten the picture whereas a coefficient less than 1 darkens the picture.
• Gaussian noise: an independent Gaussian noise is added to the original image. The noise is with zero mean and a variance equal to 0.001, 0.01, 0.05 or 0.1. The bigger the variance the more the image is noisy.
• Flip: original pictures are flipped in right/left and up/down directions.
• Rotation: a rotation of the pictures is performed by an angle of 90, 180 and 270 (anti-clockwise) degrees. The rotation center is the picture’s cen-ter. The invariance of models to rotation is interesting to investigate. Indeed Foulsham et al. recently provided evidences of a strong system-atic tendency for saccades to occur along the axis of the natural horizon, whatever the picture orientation [53].
(a) Original (b) High blur (c) Under exposure (d) Over exposure
(e) Small noise (f) Strong noise (g) JPEG (Q=10) (h) JPEG (Q=1)
Figure 1.6: Examples of some degradations applied on picture (a).
• JPEG coding: a JPEG coding is applied on the original picture. The compression is performed by using the software XnView. Three quality factors (Q) are used: 40, 10 and 1. A small quality factor indicates a strong compression (or a low quality). For the smallest quality factor, strong block effects appear on the pictures, as illustrated by figure1.6(h). A total of 2280 pictures (19 kinds of degradations multiplied by 120 pictures) is obtained. 2280×5 saliency maps plus those corresponding to original pictures have been computed, for five state-of-the-art models (Itti [84], Le Meur [110], Bruce [20], Judd [92], Hou [75]).
To measure the degree of similarity between saliency maps, a ROC (Re-ceiver Operating Characteristic) analysis is performed (see section3.3for more details). Table 1.1 gives AUC values for each model and for the highest blur, noise, JPEG and luminance degradations. The average AUC value is very high for all models. It indicates that the predicted saliency maps are very similar (almost the same) whatever the visual degradations. It can be concluded that the repeatability of saliency models is very good. For the highest degradations, the lowest AUC value is equal to 0.82, that is still a good similarity indicator between predicted saliency maps (More results can be found in [103]).
1.4
Model for video sequences
To predict where observers look within a video sequence, it is necessary to consider a new feature which is the motion contrast. In this context, this is one of the most important visual attractors. With regards to dynamic complex scenes, previous studies such as [80] have indeed shown that the motion contrast is a much more reliable predictor of salient areas than other predictors such as
Table 1.1: Repeatability of saliency models for the highest degradations (aver-age AUC values between predicted saliency maps (computed from original and impaired pictures)). Averages over degradations and models are given in the two last lines.
Model Blur Luminance Noise JPEG
σ2= 8 Under Over σ2= 0.1 Q= 1 Itti 0.99 0.94 0.92 0.96 0.94 Le Meur 0.91 – 0.92 0.84 0.91 Bruce 0.97 0.99 0.82 0.95 0.95 Hou 0.99 0.99 0.88 0.88 0.96 Judd 0.97 0.88 0.92 0.86 0.90 Avg/Deg. 0.96 0.95 0.89 0.89 0.93 Avg/Model 0.95 0.89 0.93 0.94 0.90
luminance, orientation, etc. In this section, we present our contribution on this point. A survey of existing methods could be found in [13].
The basic aim of the temporal saliency map computation relies on the relative motion occurring in the retina. The relative motion is the difference between the local and the dominant motion. The local motion−→Vlocal at each pointsof
an image is the output of a hierarchical block matching. It is computed through a pyramid composed of a set of levels of different resolutions. For each level, the block matching is done for a certain neighbourhood size, that increases with the hierarchy level.
The local motion does not necessary reflect the motion contrast. This is only the case when the dominant motion is null, meaning that the camera is fixed. As soon as the camera follows something in the scene, it is necessary to estimate the global transformation that two successive images undergo. This global transformation, or the dominant motion, can be effectively estimated from the estimated local motion.
Assuming that the dominant motion is due to the camera, we estimate the global transformation between successive imagesI(I:S⊂R2→R3+) based on
an estimated motion fields. The displacement−→VΘ(s), at a pixel sites(s∈ S)
related to a motion model parametrized by Θ is given by :
− → VΘ(s) = uΘ(s) vΘ(s) =B(s)Θ (1.8)
where B(s) is the matrix of the parametric model used. uΘ(s) and vΘ(s)
respectively. We consider the complete 2D affine motion model: − → VΘ(s) = 1 1 1 0 0 0 0 0 0 1 1 1 Θ (1.9) = a1+a2x+a3y a4+a5x+a6y (1.10)
where Θ = [a1, a2, a3, a4, a5, a6]T are the affine parameters of the model. xand
yrepresent the spatial coordinates of pixels= (x, y). The six affine parameters are estimated with a popular robust technique based on the M-estimators [?]. To deal with the lack of stability of the standard least squares method to plau-sible outliers present in the data, the M-estimators lessen the outliers effects by replacing the squared residuals errors by a weighting function. The estimated affine parametersΘ have to minimize :b
b Θ =argmin Θ X s∈S ρ(r(s)) (1.11)
wherer(s) =I(s+→−VΘ(s), t+ 1)−I(s, t) represents the displaced frame
differ-ence (DF D). ρis a symmetric, positive-definite function. We took here forρ
the Tukey’s bi-weight function.
Once the six parameters have been computed, the relative motion−→Vrelative
rep-resenting the motion singularities is computed locally by subtracting the dom-inant motion from the local one. If the current location undergoes a domdom-inant motion, the relative motion is null, otherwise the relative motion is non zero, indicating the presence of salient displacement. The relevance of the relative motion also depends on the average amount of the relative displacement over the picture. For example, a high relative motion is more conspicuous when there are only few relative displacements. To model such property, a linear quantification of−→Vrelativeis achieved in order to build a histogram. The median value of this
histogram, called Γmedian, is a reliable estimator of the relative motion (note
that this value is normalized according to the maximum velocity in order to be in the range 0 to 1. The maximum velocity is related to eye’s ability to track an object). k−→Vrelativek is then normalized according to Γmedian. Temporal
saliency mapST is finally given by:
ST(s) =k − → Vrelative(s)k + Γmedian (1.12)
where is a small positive value to avoid the division by zero. The closer Γmedian to 0, the more the relative motion is perceptually important. This
strategy simply reflects that it is easier to find a moving stimulus among sta-tionary distractors (Γmedianclose to 0) than a moving stimulus among moving
distractors (Γmedianclose to 1).
The spatial and the temporal saliency maps are then combined together in order to output the final spatio-temporal saliency maps. As discussed in
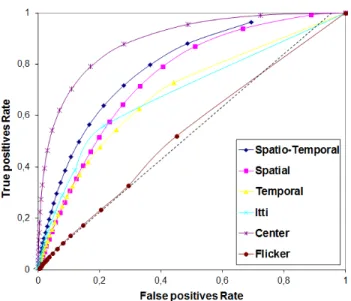
Figure 1.7: ROC curves for a set of video sequences. Four plausible models are compared (proposed Spatial, Temporal, Spatio-temporal and Itti’s model). Two naive models which are the center and the flicker are also evaluated.
section 1.3.1, the pooling strategy is a difficult problem. We use the same strategies as those presented in section1.3.1to get the final result.
The performance of the proposed approach has been evaluated on a set of sequence (see [109] for more details). Figure 1.7 presents the ROC curve obtained by comparing two sequences of saliency maps. The proposed spatio-temporal model provides the best results compared to the spatial, spatio-temporal and Itti’s model. Two naive models are also put to the test: the center model (see section2.3.2for more information) which provides the best results and the flicker model which is based on the frame difference of the input video. This model performs at the chance level.
1.5
Conclusion
During the last two decades the modelling and understanding of visual atten-tion involving computer, neuroscience and cognitive scientists have made a lot of progress. The research is still stimulated by this cross-disciplinary collabora-tion. However, there are still a number of open issues to tackle. One of the most important concerns the prior knowledge of observers which is overlooked most of the time. The question is how can we introduce knowledge into a compu-tational model of visual attention. Another issue is about the saliency models validation. There exist now a number of eye-tracking datasets which are more or less relevant or contaminated by experimental biases (see chapter 2 for a
review). The validation also requires to define tools to measure the similarity degree between ground truth and prediction. The ROC analysis is currently the most used metric although that this metric suffers from some important limitations.
1.6
Contribution in this field
There are several contributions in this field. The most important publications are listed below. They address the modelling of bottom-up visual attention on both still color pictures and video sequences. One dataset of eye-tracking data has been released to the community for research purposes.
In addition to the listed scientific contributions, I participated to the organi-zation of four special sessions on viusal attention which took place during in-ternational conferences (ICIP 2009, SPIE 2012, WIAMIS 2013 and ICME 2014).
Journal:
• O. Le Meur, P. Le Callet, D. Barba and D. Thoreau,A coherent compu-tational approach to model the bottom-up visual attention, IEEE Trans. on Pattern Analysis and Machine Intelligence, 28(5), May 2006.
• O. Le Meur, P. Le Callet and D. Barba,Predicting visual fixations on video based on low-level visual features, Vision Research, 47(19), pp. 2483-2498, Sept. 2007.
• O. Le Meur and J.C. Chevet,Relevance of a feed-forward model of visual attention for goal-oriented and free-viewing tasks, IEEE Trans. On Image Processing, 19(11), pp. 2801-2813, 2010.
• F. Urban, B. Follet, C. Chamaret, O. Le Meur and T. Baccino, Medium spatial frequencies, a strong predictor of salience, Cognitive Computation: 3(1), pp. 37-47, 2011 (Special issue on Saliency, Attention, Active Visual Search, and Picture Scanning).
• J. Gautier and O. Le Meur, A time-dependent saliency model mixing center and depth bias for 2D and 3D viewing conditions, Cognitive Com-putation, 3(2), pp. 141-156, 2012.
• Z. Liu, O. Le Meur, S. Luo and L. Shen,Saliency detection using regional histograms, Optics Letters, 38(5), 2013.
• Z. Liu, W. Zou, L. Li, L. Shen and O. Le Meur, Co-saliency detection based on hierarchical segmentation, IEEE Signal Processing Letters, vol. 21(1), 2014.
Conference:
• O. Le Meur and P. Le Callet, What we see is most likely to be what matters: visual attention and applications, ICIP, pp. 3085-3088, 2009.
• O. Le Meur,Robustness and repeatability of saliency models subjected to visual degradations, ICIP, pp. 3285-3288, 2011.
Chapter 2
Eye tracking datasets
2.1
Introduction
During the past decades, the rise of accessible commercial eye-tracking system has fuelled the visual perception research and strongly contributed to the emer-gence of new results and applications. Eye-tracking system is indeed a valuable tool to collect easily large amounts of data. These datasets serve different goals such as modelling, measuring, evaluating and understanding the way we look at visual scenes. More specifically this kind of datasets constituting a ground truth is used in the community to evaluate and compare the performance of compu-tational models of visual attention. There exist more than a dozen datasets of eye tracking which can be freely downloaded from the Internet. However, there exist some limitations which are rather overlooked. Datasets are indeed intrin-sically limited or bounded by different factors such as the number of observers, the viewing duration, the task at hand. More importantly datasets just provide a snapshot of the real world and can not grasp the complexity as well as the variety of our visual world.
The objective pursued here is to provide a comprehensive set of rules for re-leasing high quality eye tracking datasets. More specifically, these datasets are intended to serve as a ground truth for the evaluation and comparison of com-putational models of visual attention. We define the quality of an eye tracking dataset by two components, one related to the experimental methodology and the other related to the relevance of the tested materials. The former is simply about the most important factors which should be taken into account before starting the experiment. The latter concerns a post-processing phase which aims at detecting and filtering out images (stimuli) which do not bring any added values.
This chapter is organized as follows. In section2.2, the main important method-ological factors are elaborated. As surprising as it might seem, there is no stan-dard describing accurately what must be done and what must be avoided to conduct an eye tracking experiment. In section 2.3, we present and evaluate
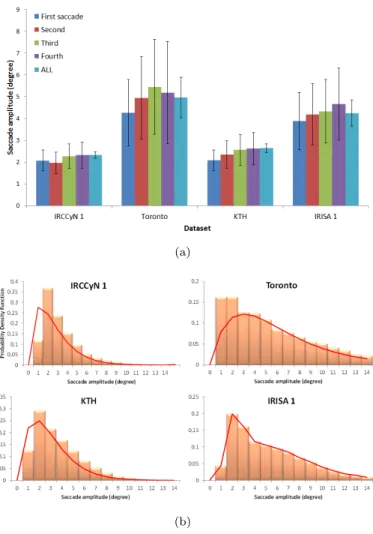
the main features of a set of popular datasets. Central bias, inter-observer dis-persion, fixation duration and saccade lengths are examined. We will see that, despite the best efforts of their creators, there exist some strong biases which can strongly affect the experiment outcome. The aforementioned criteria can be advantageously used to detect and to discard dataset’s outliers. In the last section, we will draw some conclusions.
2.2
Protocol
Conducting an eye tracking experiments is rather simple compared to other behavioural and psychophysics experiments. However, although simple, it is necessary to take care of some crucial parameters in order to guarantee that results are reproducible and comparable to existing ones. These parameters are listed and discussed below. Readers could also refer to [73] for complementary information.
2.2.1
Pixel Per Degree of visual angle
In vision research it is essential to specify the observation conditions as well as the stimuli. One important aspect for eye tracking is the visual angle subtended by stimuli and its angular resolution. The visual angle, expressed in degrees, represents the size of the stimulus on the retina. It is simply computed from the viewing distance and the size of the onscreen stimulus, as illustrated by figure2.1. For a rectangular stimulus, the visual angle of its heightθV (V stands
for vertical) and the visual angle of its widthθH(Hstands for horizontal) should
be given. They are obtained by
θH = 2×arctan H 2d (2.1) θW = 2×arctan W 2d (2.2)
where H and V are the width and the height of the onscreen picture, respec-tively. It is important to mention that these sizes are not necessarily the screen’s size. It depends on whether the stimulus covers the whole screen or not. dis the viewing distance, namely the distance between the eyes to the viewing plane. The angular resolution of the stimulus expressed in pixels per degree (ppd) of visual angle is then deduced by dividing the stimulus’s resolution by the visual angle. The angular resolution is used to normalize (or to be invariant to viewing conditions) indicators such as the saccade amplitudes, the fovea’s size expressed in pixel, distance between two fixations points. H,V anddshould be given in the same unit.
More importantly the angular resolution is essential to segment the raw eye tracking data into fixations and saccades. There are three standard measures to extract fixations from eye tracking data: dispersion, velocity and acceleration (for more details see [134],[156],[153]). Dispersion-based method relies on the
![Figure 1.2: Taxonomy of computational model of visual attention. Courtesy of Borji and Itti [13].](https://thumb-us.123doks.com/thumbv2/123dok_us/10202125.2923199/25.918.204.718.182.808/figure-taxonomy-computational-model-visual-attention-courtesy-borji.webp)