Appendix A
An overview of the UK energy system
evolution in a global context, current state
and future outlook
1. Background
Energy is the bedrock of human civilisation. Universal, affordable and clean energy is a prerequisite for economic and social development. Addressing pressing global challenges of the 21st century – from poverty eradication to food security, essential healthcare to peace, and from ecosystems conservation to security – require access to energy to a wider populace. In a modern economy, almost all goods and services have energy implications – foods we consume (mechanized agriculture, storage and transportation), buildings we live and work in (building materials, construction, heating, entertainment), vehicles we ride (materials, manufacturing, fuel) and day-to-day consumables at home and work (industries that produce them) require energy. Energy and its use touches every facet of our lives, its delivery in the form we need it and a complex system of global supply chains means, it impacts and is affected by the social, political, resource and environmental issues at both local and global scale. Also, its direct connection to human development and inherent inertia of the system means reviewing its historic evolution is equally important to transitional issues.
With the above perspective, we start by presenting a historical overview, current state and future projections of the global energy system. Then a brief overview of the evolution and current state of the UK energy system is provided before illustrating on the current challenges in transitioning the UK energy system to one that is fit for the 21st century.
2. Global energy demand and supply
2.1 A brief history
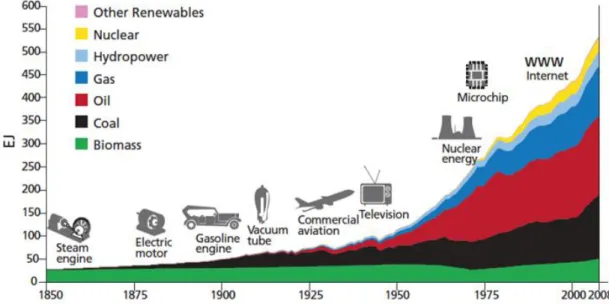
Rapid transformation of the world energy system from a traditional biomass-centric one to modernity started with the onset of the industrial revolution during the 18th century (Figure A-1). Originating in Great Britain, the industrial revolution unlocked the potential of coal, oil and natural gas, energy density of which far exceeded mankind’s expectations. The world embarked on an unprecedented development growth spurred by technological innovation and advancement. This enabled increased living and health standards, first in industrialised countries, helping increase the
human population base. With this explosive development and increasing population, demand for primary energy grew manifold in less than a century, doubling in approximately every 30 years, with fossil fuel increasingly replacing traditional biomass as the dominant fuel. The world’s per capita consumption of energy grew between WWII and 1970, mainly due to post-war rebuilding in Europe and Japan, and large-scale construction of infrastructure projects in the USA. Year on year increase in energy consumption has however historically remained below global GDP growth due to efficiency improvements and changes in structural composition of the world economy.
Figure A-1 Evolution of world primary energy mix in last 150 years (GEA, 2012)
2.2 Current state and future projections
Now, with industrialisation and economic development at break-neck speed in high-population emerging economies, global energy demand hotspots and trends are once again changing rapidly, with the share of non-OECD countries’ energy consumption surpassing OECD countries’ in recent years (from 36% in 1973 to 57% in 2011). Non-OECD countries’ share is set to grow to ~65% in all WEO scenarios (IEA, 2013) driven by increasing population and income, key drivers of energy demand, in that part of the world. World population is set to increase from the current 7 billion to 8.3 billion by 2030, with 90% of the growth suggested to be in low and medium income countries outside of the OECD. The current trend of industrialisation, urbanisation and motor vehicle growth in developing and emerging economies will continue, leading to more than 80% increase in energy use worldwide in a business as usual scenario (IEA, 2012). Demands in power generation and industry lead the pack accounting for 57% and 25% growth in primary energy consumption by 2030 respectively (BP, 2010). Between 2011-2035, china accounts for ~30% of net demand growth followed by India (18%), SE Asia (11%) and Mid-East (10%) and Africa (8%), with demand increasing slightly in USA (1%) and decreasing in EU and Japan.
At the end of 2011, fossil fuel still dominates the world energy system accounting for 82% of total primary energy use. Ten years ago it was 80%, and without ambitious reduction measures it is projected to remain around that level by 2035 (IEA, 2013). After the oil shock of 1970s, the world has seen a gradual increase of energy supplies, mainly in electricity, from nuclear and hydropower, overall % of which still remains considerably lower at 8% in comparison to ~81% from incumbent fossil fuels (in 2008, IEA, 2008). Currently, energy supply and consumption are responsible for ~60% of global CO2e emissions (GEA, 2012). This makes the energy system central to mitigation and stabilization of man-made climate change to 20 C below pre-industrial levels by end of the 21st century. OECD (2012) estimates that in order to transform the energy system to address its current challenges with existing and emerging technologies, investments in the order of ~45 trillion will be required by 2050. Given the reliance of long-lived assets, path dependency, size and complexity of the energy system, acting earlier and with a long-term and holistic approach will ensure that these investments will be cheaper and effective in the long run to deliver sustainability.
Climate change along with supply security concerns have pushed dramatic development of renewable energy in last 2 decades– yet their share in the energy system remains below policy aspirations and requirements to keep global rise in temperatures below 20 C, the threshold to avoid dangerous climate change, by end of the century. Currently, 13% of total global primary energy (in 2011) and 6.5% of electricity generation (in 2012) was from renewables, which is projected to increase by 60% and 125% respectively by 2035 under Current Policies Scenario1 and IEA 450
scenario2 (IEA, 2013; UNEP, 2013). In 2010, renewables’ share of electricity production
was 21.7% (16.5% hydro) globally. However, growth in renewable electricity generation (since 1990) has been slower than total electricity generation growth year on year (2.8% versus 3.0%). This trend may change in future as by end of 2012, 138 countries had renewable targets; solar-based renewables grew at 40-60% and wind at 25 % year on year between 2007-2012 (REN21, 2013). BNEF’s Global Energy and Emissions model indicates annual investments in renewable capacity rising by 2.5 to 4.5 times between now and 2030, with the likeliest scenario indicating slightly higher uptakes than IEA’s New Policies Scenario3 with investments at ~$630 billion a year in
2030. New Policies Scenario suggests a world on track for a long-term temperature increase of 3.60C by end the century. On the development front, energy access
1 Pathway that assumes no changes in policies from the mid-point of the year of publication of WEO(2013)
2 Pathway consistent with the goal of limiting the global increase in temperature to 2°C (50% chance) 3 Pathway that takes into account the broad policy commitments and plans announced by countries, including national pledges to reduce GHG emissions and plans to phase out fossil-energy subsidies; broadly an IEA baseline scenario.
remains a key issue for most of the developing world - worldwide ~1.3 billion (in 2009) people remain without access to electricity, with ~96% from Asia and Africa (IEA, 2013).
3. UK energy system
3.1 Brief history of evolution
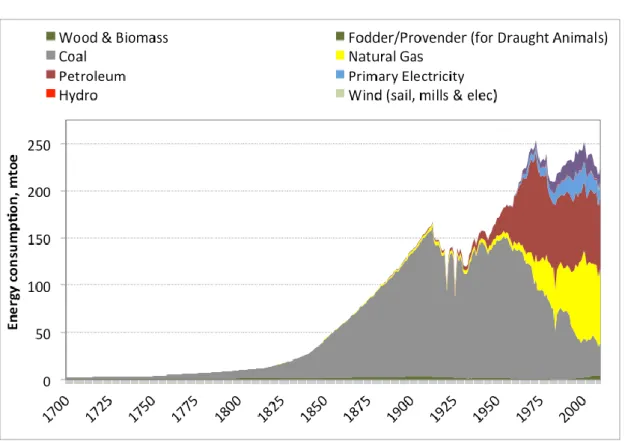
Figure A-2 Evolution of primary energy consumption mix in the UK in last 200 years (Fouquet, 2011)
Until about 1650, the share of coal and wood-fuel was relatively equal in the UK. Between 16-19th century, limited by productivity of scarce land resources, the UK moved from a traditional agrarian economy to an industrial economy, increasing the share of coal in the economy to ~80%. As discussed earlier, the industrial revolution that started in Great Britain with the advent of the steam engine, transformed the dynamics of not only the UK economy, but also the economies and energy systems of the entire world through technological innovation that followed. Coal use increased steadily with the increased use of steam powered boats and trains (Figure A-2). With Karl Benz inventing the car in 1885 and the discovery of oil; oil’s share in the UK (and global) energy demand increased gradually along with the development of car industry and widespread use of motor vehicles. Car use really took off in the early 1950s with the start of the Motorway age in Great Britain, with the opening of Preston bypass in 1958. Car ownership exploded from 4.5 to 28 million between 1958 and 2008. Gasoline use increased more than six-fold between 1950 to its peak in 1972
when oil shock affected UK along with others in the industrialised world. The post oil shock era saw a relative increase in vehicle energy efficiency and Britain exploiting its domestic gas reserves in the North Sea and effectively moving to an increasingly gas-centric economy - share of natural gas based power production was 40% in 2010. Recently, it fell to 23% in 2012, primarily due to cheaper coal prices. In 2015 many coal plants closed under EU’s Large Combustion Plant Directive (LCPD) directive aimed at controlling acidifying gas emissions4. Whilst coal use is steadily decreasing, oil use has remained relatively constant owing to demands from the transportation sector.
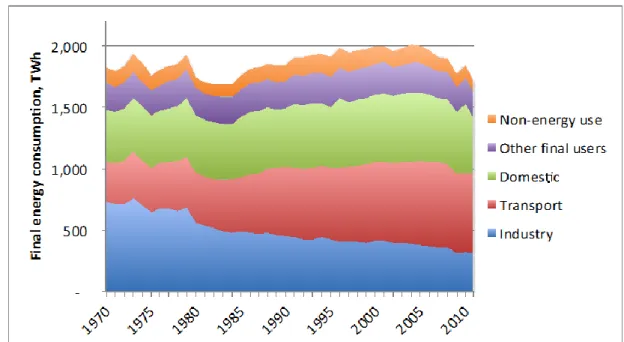
Figure A-3 Final sectoral energy consumption in the UK in past 4 decades (ECUK, 2013) Privatisation of power sector in 1990s and structural shift in the economy (from heavy industry to services) saw a shift in the relative composition of demands with gradual reduction in industrial energy use. However, relative increase, mainly in transport and domestic sectors, increased overall consumption in the 1980-90s. Peaking in 2005, overall consumption has been on a decreasing trend in past decade (Figure A-3).
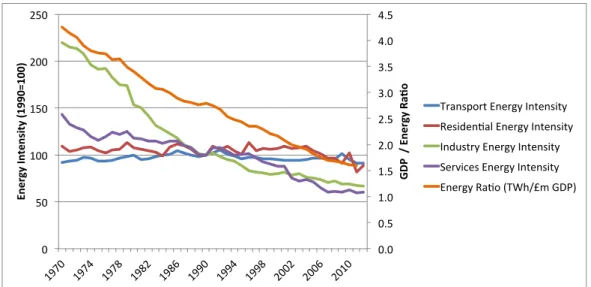
Figure A-4 Evolution of sectoral energy intensity and energy ratio in the UK (residential energy intensity: energy consumption per household; services energy intensity: energy intensity per £1 mil. GVA; industrial energy intensity: energy consumption per unit of output; energy ratio: total inland primary energy consumption per £1 mil. of GDP) (ECUK, 2013)
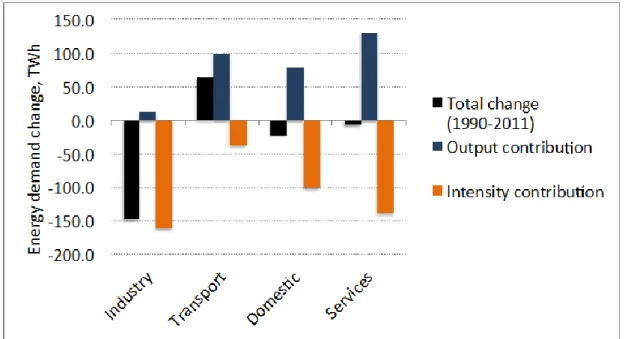
However, energy use per unit of GDP in the UK has been falling with a clear trend since 1970s (Figure A-4) and is now lower than IEA and OECD average. The intensity improvement has contributed to arrest the dramatic increase in energy use, with the biggest improvement seen in industry followed by the services sector. Figure A-5 shows the contributions from changes in output and energy intensity to the change in total final sectoral consumption in the UK between 1990-2010. Except the transport sector, energy use has decreased (in residential and services) or increased only slightly (in industry) mainly due to significant improvement in energy intensity (Figure A-4 & A-5). With the world’s sixth biggest economy, in 2010 the UK’s total primary energy consumption was 1.75% of the world’s total consumption (EIA, 2014).
Figure A-5 Contributions of changes in output and energy intensity to the change in overall energy consumption (ECUK, 2013)
3.2 Current demand and supply regime
Figure A-6 Energy consumption in the UK in 2012 by fuel type (ECUK, 2013)
Petroleum, mainly used in the transport sector, remained the dominant fuel in the UK economy in 2012 with 42.8% of consumption share, followed by natural gas and electricity with shares of 33.5% and 19.4% respectively (Figure A-6). In production of electricity, natural gas had 40% share followed by coal (32%) in 2010. In recent years coal has surpassed natural gas as the dominant generation fuel (28% in 2012) as
generators are using up remaining allowable hours in opted-out coal plants under EU LCPD scheme and owing to the recent relative higher cost for gas than imported coal. The UK remains a net importer of gas (55% in 2010). Gas imports are expected to rise further depending on how far the UK goes in meeting the renewable target. Peak gas demand is projected to be volatile if large amount of gas-fired peaking plants are installed to cover for increasing intermittent renewables. Electricity generated from renewables increased ~19% year on year and accounted for 11.3% of total UK electricity generation in 2012.
Despite decreasing imports of electricity in recent years, 2012 saw imports jumping to 12 TWh (~3% of total annual demand). Imports are mainly from France and exports are to Ireland.
3.3 Sources of demand – sector, end-use and region
Transport was the highest consuming sector (38%) in 2011, followed by residential (26%), industry (28%) and other users (12%, includes services sector) (Figure A-3). The chemicals sub-sector remains the largest consumer of energy in industry with 16% of all industrial consumption - the sub-sectors saw 47% improvement in energy intensity between 1990-2012. In transport, the largest increase is seen in air transport in 2011-2012 (69%) with 23% share of sectoral total consumption in 2011-2012.
(a) (b)
Figure A-7 (a) Energy consumption in major end-use categories in 2012 (DECC, 2013). (b) end-uses in 3 economic sectors
In end-uses, heating energy services consumed ~78% of total demand with space and water heating responsible for 51% and 10% of total energy consumption (Figure A-7). In industry, heating demand in process use was the biggest consumer (12% of national total). Among electricity based end-uses, lighting and appliances consumed the most (11%).
Figure A-8 Sectoral (a) electricity and (b) Gas consumption shares to total annual consumption in 2012 (DECC, 2013)
Electricity demand remains highest in the residential sector at 30% of total annual consumption (Figure A-8). This is 2nd highest among IEA countries - only France has a higher share. On the other hand, industry sector’s share is lowest among IEA countries. Industry and services sectors (commercial, public administration and agriculture) consumed 26% and 27% of UK total respectively. Residential sector was the largest consumer of gas (40%) followed by electricity generation (25%) and industry sector (Iron & Steel and other industries consumed 13%).
Figure A-9 Sectoral energy demands in 11 Great Britain Government Office Regions in 2012 (DECC, 2013)
Regionally, South-east and North-east regions show largest and lowest share of consumption with ~16% and ~4% of national total respectively (Figure A-9). Generating ~22% of national GDP, Greater London’s consumption stood at ~9% of the national total.
3.4 Future outlook – demand, supply and consumer prices
The past eight years have seen decreasing annual energy consumption in the UK. Year 2012 saw primary energy consumption increasing by 2.1% from the previous year due to a 10 C cooler weather (however, temperature corrected demand was 0.6% lower than in 2011). Annual consumption in domestic and services sectors increased 11% and 7% respectively. Government forecasts show industrial sector with a larger share of electricity demand by 2020, with a lower share in the residential sector. In electricity generation, DECC expects the de-rated capacity margin5 to fall to below 5% around middle of the decade – though the likelihood of that happening is now greater due to a number of factors in recent years (FT, 2013).
Decreasing oil and gas production in the UK (134% of national demand in 2000 to 76% of demand in 2010) means it is increasingly dependent on fossil fuel imports and exposed to supply and price volatility from rapidly changing global demand-supply dynamics. Unprecedented and increasing oil prices and high gas prices mean increasing percentage of GDP is being spent on import of these fossil fuels. Typical household energy bills have risen from GBP 610 to GBP 970 between 2004 and 2011 in nominal terms. Even considering energy efficiency improvements, household energy bills are expected to rise to between GBP 1195 and 1331 by 2020 (DECC, 2013;
Committee on Climate Change, 2013).
3.5 UK energy infrastructure - electricity and gas infrastructure
The main energy networks in the UK are the gas and electricity systems. Gas and electricity networks are very similar. Both networks are designed to transport energy from remote locations to demand centres, often a considerable distance apart. It is this geographical separation that results in the transmission business to be of such high national importance. Generally, both gas and electricity energy systems can be structured into the following categories:
Fuel sources (coal, gas oil, uranium etc) and power generation
Transmission (high voltage power network; high pressure gas network)
Distribution (medium/low voltage power network; medium/low pressure gas network)
Consumers (electricity/gas demand).
However, there are differences between these two networks. Natural gas constitutes a primary form of energy that comes from gas fields, while electrical energy is a
5
The capacity margin is defined as the excess of installed generation over demand. It is adjusted to take account of the probable technical availability of plants, specific to each type of generation technology (derated capacity margin). While capacity margins illustrate trends in the market, they do not measure the risk of supply not meeting demand. Metrics such as loss of load expectation/probability (LOLE/LOLP) are used to represent this risk.
secondary form of energy which is formed by the transformation of primary energy (fuel) in a power plant. Gas is transported from the gas fields (suppliers) to customers through pipelines while electricity is transmitted through power circuits. Additionally, gas networks can store natural gas to be used at peak load periods while electricity cannot be stored efficiently or economically (although future electricity storage technologies may change this).
The electricity network
The electricity system has a profound impact on the economic output of the UK. It has led to an era of technological innovation, large scale industrialisation and mass uptake of electronic consumer goods.
The electricity supply industry (ESI) has developed rapidly over the past 150 years from when Thomas Edison formed his Electric Light Company in 1878 to UK market liberalisation in 1989. During the late 1800s the use of electricity began to increase. This led to a debate on the comparative usefulness of alternating current (AC) and direct current (DC), the former being championed by Nikola Tesla and George Westinghouse. This debate raged over many decades as AC proved to be more suitable for electricity transmission over long distances.
By 1900, electricity was mainly used for lighting as it was as good as gas lighting. The UK government established the electric power supply committee in 1915. The committee recommended the appointment of electricity commissions that divided the country into district boards. These would take over power generation and distribution in their area. The electricity supply Act 1926 integrated the district boards to create the Central Electricity Board (CEB). The CEB established the national grid transmission system, linking the biggest and most efficient power stations across the country.
In 1947 the electricity Act nationalised the electricity supply industry. The UK ESI was dominated by one large generating and transmission (the 400/275/132kV network) company, the Central Electricity Generating Board (CEGB) which sold electricity in bulk to the 12 area electricity distribution boards.
Up until the 1970s it was widely considered that the state owned electricity supply industry (ESI), of which the CEGB was a part, represented the best of government planning. But the CEGB was too slow to react to the shifting patterns of energy supply and in particular to events such as the second oil crisis (1978-80). This led to calls by many to privatise the industry.
Privatisation of the ESI (in particular the CEGB) began in 1990. The CEGB was broken up into two generating companies (National Power and PowerGen), with the National Grid company as the high-voltage electricity power transmission network owner and
operator in the UK. The area electricity boards were privatised as single entities and became regional electricity companies (RECs). Since the initial liberalisation and privatisation process a number of foreign energy companies have entered the UK market. Currently the UK generation and supply market is dominated by six energy suppliers.
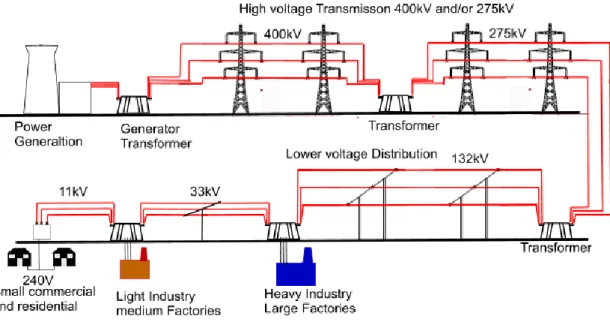
Figure A-10 Simplified UK electrical power transmission system (National Grid, 2013a)
The main principles of the UK electricity transmission system are shown in Figure A-10. The transmission network transports electricity from generation plants to distribution companies and large industrial customers. The distribution companies then deliver the electricity to the majority of customers through lower voltage networks. There are also undersea interconnections to northern France (HVDC Cross-Channel), Northern Ireland (HVDC Moyle), Isle of Man (Isle of Man to England Interconnector), Netherlands (Britned) and the Republic of Ireland (EirGrid). There are also plans to lay cables to link the UK with Iceland and Norway (Scotland–Norway interconnector) in the future. Within the UK there are plans to build two HVDC links connecting Scotland to England and Wales, both of these links will be capable of transferring approximately 2GW of power across several hundreds of kilometres.
Figure A-11 UK electricity transmission network (National Grid, 2013a)
The map of the UK electricity transmission system is shown in Figure A-11. In 2012 the total length of the 400, 275 and 132 kV high voltage transmission network was 11,500, 9,800 and 5250 km. A total of generation capacity of 80GW was connected to the grid meeting a peak demand of approximately 58 GW.
The gas network
Gas system development can be split into three distinct historical periods; the first was the pre and post second war period until the late 1940s, the second from the late 1940s to early 1980s and third from early 1980s to the present. The first period was characterised by a system dominated by manufactured gas (carbonisation of coal; town gas) produced by private and municipal companies. The gas Act 1948 nationalised the industry. The Act established the gas council and 12 area boards that had responsibility for the regional gas industry. The gas Act of 1972 led to further centralisation with the gas council now renamed British Gas Corporation (BGC) acquiring governance and administrative control of the area board’s (renamed regional councils). In the mid 1960s exploration of the UK Continental Shelf (UKCS) led to several discoveries of large gas fields this led to BGC to acquire exclusive monopoly rights to the sale of gas via the continental shelf Act of 1964 and gas Act 1965. Strong barriers were placed on producers of natural gas. The Acts gave extensive power and rights to BGC to manage the sale and distribution of natural gas in the UK. The Act obligated BGC to establish a high pressure transmission system that would transfer the gas to the 12 area boards. This privileged position of BGC came to an end in 1982
with the oil and gas enterprise Act that started the process of privatisation and liberalisation of the gas industry that has lasted to the present day.
The UK gas infrastructure is shown in Figure A-12. The UK has nine gas terminals6. The largest two (in terms of recent maximum gas flows - 2011) are St Fergus (UKCS and Norwegian gas supplies) and Bacton (UKCS and Continental gas supplies) gas terminals.
Figure A-12 UK gas transmission network (National Grid, 2013b)
The UK has previously been self sufficient in gas supplies but by 2005 was a net gas importer. To meet the challenge of import dependency the UK gas system has seen developments in three key areas:
Pipeline imports
Existing import pipelines include the UK-Belgium (Bacton) and UK-Norway (St-Fergus) interconnectors, with capacity of 16.5 and 18.5 Bcm per annum. In 2006 construction was completed on two new interconnectors. The largest of these was the 1200km Langeled pipeline linking the Ormen Lange gas field in the Norwegian Sea to the import gas terminal at Easington with a capacity of 26.3 bcm per annum. The other
6 Including Bacton, Barrow, Easington, Isle of Grain, Milford Haven, Burton Point, St Fergus, Teesside and Theddlethorpe
interconnector is the pipeline from the Netherlands to the Bacton gas terminal (BBL) with a capacity of 17.6 bcm per annum (National Grid, 2013b).
LNG facilities
LNG7 allows for gas to be transported without pipelines. There are currently LNG gasification terminals at the Isle of Grain, Teesside and a further two LNG terminals at Milford Haven (Dragon and South Hook).
Gas storage
In 2013 there were eight gas storage facilities8 connected to the National Transmission Network (NTS), providing total gas storage capacity of 4.6 Bcm. The largest is the Rough gas storage facility that accounts for roughly 70% of total gas storage capacity in the UK. UK gas storage capacity is equivalent to approximately 14 days’ supply at average winter gas demand.
Gas storage in the UK is used principally to provide seasonal (Rough storage facility) and peak shaving facilities to ensure sufficient supply is available to meet demand. The lack of gas storage capacity compared to other European countries is due to the UK’s previous reliance on indigenous gas supplies.
The UK has a number of proposed storage developments that have not progressed to construction mainly due to uncertainty with respect to summer/winter gas price differentials and lack of policy clarity regarding the future of the gas system.
One area where there has been considerably controversy is the potential of shale gas in the UK. According to the British Geological Survey there is potentially 23.3 to 64.6 tcm of shale gas resources (gas in place)9 in only one region of the UK -
Bowland-Hodder (Andrews, 2013). Further to this, a study commissioned by DECC in 2013 concluded (albeit contested by some) that large-scale development of shale gas in the UK could lower long-term natural gas prices to 27% below current
levels by 2020, saving the average household approximately £125 per year in lower gas costs (Navigant Consulting, 2013).
7Liquefied Natural Gas (LNG): gas is cooled until it becomes liquid (at -160 degrees Celsius) this process
is called liquefaction (LNG takes up about 1/600th the volume of natural gas in the gaseous state). LNG is transported in specially designed ships. Re-gasification is needed before gas can flow in pipelines 8 Including Rough, Aldbrough, Hatfield Moor, Holehouse Farm, Holford, Hornsea, Humbly Grove, Avonmouth
REFERENCES
Andrews, I.J. (2013). The Carboniferous Bowland Shale gas study: geology and resource estimation, British Geological Survey for Department of Energy and Climate Change, London, UK.
BP (2010). BP statistical review of world energy. British Petroleum. London, UK.
Committee on Climate Change (2013). Energy prices and bills - impacts of meeting carbon budgets. London, UK.
DECC (2013). Digest of UK Energy Statistics (DUKES). Department of Energy and Climate Change. London, UK, TSO.
ECUK (2013). Energy Consumption in the UK. Accessed online at
https://www.gov.uk/government/collections/energy-consumption-in-the-uk
EIA (2014). Global Total Primary Energy Consumption Statistics. USA Energy Information Agency, USA.
Fouquet, R. (2011). Divergences in long run trends in the prices of energy and energy services. Review of Environmental Economics and Policy 5(2): 196-218.
FT (2014). Energy: Power Down, Cheap US coal has made gas-fired electricity uneconomic and accelerated a capacity shortfall in the UK (by Guy Chazan), Financial Times, February 20, 2014.
GEA (2012). Global Energy Assessment: toward a sustainable future. Cambridge, UK, Cambridge University Press.
IEA (2012). Energy Technology Perspectives 2012: Pathways to a clean energy system. International Energy Agency. Paris, France.
IEA (2013). World Energy Outlook 2013. International Energy Agency. Paris, France.
National Grid (2013a). National Grid Gas Transmission Operational Data. Accessed online at: http://www2.nationalgrid.com/uk/Industry-information/gas-transmission-operational-data/supplementary-reports/
National Grid (2013b). Gas Ten Year Statement 2013. Warwick, UK, National Grid.
Navigant Consulting (2013). Unconventional gas: the potential impact on UK gas prices, prepared for DECC.
OECD (2012). OECD Green Growth Studies: Energy. Organisation for Economic Co-operation and Development.
REN21 (2013). Renewables 2013 Global Status Report. Renewable Energy Policy Network for the 21st Century.
UNEP (2013). Global Trends in Renewable Energy Investment 2013, United Nations Environment Programme. Bloomberg New Energy Finance for UNEP.