PERFORMANCE ASSESSMENT OF GNSS RECEIVER NETWORKS
WITH SOFTWARE MODEL EVALUATION
An Undergraduate Research Scholars Thesis by
ZACHARY VARNADORE
Submitted to the Undergraduate Research Scholars program Texas A&M University
in partial fulfillment of the requirements for the designation as an
UNDERGRADUATE RESEARCH SCHOLAR
Approved by
Research Advisor: Dr. Jyh-Charn Liu
May 2016
TABLE OF CONTENTS
Page ABSTRACT ... 1 ACKNOWLEDGEMENTS ... 2 CHAPTER I INTRODUCTION ... 3Scope and focus of this work ... 3
Global Navigation Satellite Systems ... 4
The Continuously Operating Reference Station network ... 5
Current applications of GNSS systems with CORS ... 6
Existing quality evaluation methods for CORS ... 7
Previous quality evaluation studies for CORS... 8
Using a software environment for CORS network quality evaluation ... 8
Goal for this thesis ... 9
II METHODS ... 10
Overview of methods for evaluating CORS ... 10
Evaluation criteria for CORS network ... 10
CORS receiver data and configurations ... 12
Methods for measuring availability and validity of CORS data ... 14
Software for CORS evaluation ... 18
Design of software for CORS evaluation ... 20
Selection of CORS stations for evaluation ... 26
III RESULTS ... 27
Overview of results ... 27
Data availability results... 27
Data validity results ... 32
IV CONCLUSIONS... 35
Data availability discussion ... 35
Data validity discussion ... 37
Software model approach success ... 38
Future work ... 39
1
ABSTRACT
Performance Assessment of GNSS Receiver Networks with Software Model Evaluation
Zachary Varnadore
Department of Computer Science and Engineering Texas A&M University
Research Advisor: Dr. Jyh-Charn Liu Department of Computer Science and Engineering
This work details methods of evaluation for GNSS receiver networks using evaluation techniques implemented in software. Evaluation methods are formulated in this work that
estimate the availability and validity rates of GPS receiver data within a GNSS receiver network. These methods are implemented as part of a new software suite developed to handle data from hundreds to thousands of GPS receivers effectively and efficiently. Details of the software suite design and implementation that are critical to the performance and effectiveness of handling large sets of receiver measurement data are detailed. The software and methods developed are applied to the CORS network by evaluating measurement data provided by 708 stations in the CORS network for one day. The rates of data availability and validity are reported, which are used to validate the effectiveness of the software. The results found show that the software is effective for analysis of the CORS network for a large number of GPS receivers.
2
ACKNOWLEDGMENTS
I would like to thank my research advisor, Dr. Liu, for this guidance. His support has been critical to my academic pursuits and the development of this thesis. He has provided me an opportunity to engage in my areas of interest for research and has challenged me to push beyond what I already know and seek new ideas.
I would also like to thank Michael Fu for his guidance and support. His dedication and hard work have been critical to this thesis.
3
CHAPTER I
INTRODUCTION
Scope and focus of this work
A Global Navigation Satellite System (GNSS) such as the Global Positioning System (GPS) is a fundamental system of the modern world which provides accurate positioning solutions to users for applications in a variety of fields. GNSSs are complex systems involving many components for provision of positioning data. A key component to this system are networks of reference GNSS receivers, which continuously provide positioning data and serve as a reference for critical applications such as positioning correction systems as part of Differential GPS (DGPS) methods. The largest of these networks is the Continuously Operating Reference Station (CORS), which currently contains over 1500 receivers. The CORS network provides receivers that serve as a reference for positioning correction data in DGPS and for applications in geodesy; therefore, it is critical that the data from the CORS network is held up to the highest standards of quality, of which data availability and validity are the most critical. Positioning data reported by the CORS network should be monitored and evaluated against a data verification model to ensure high quality standards. Given the size of the CORS network, a big data problem exists for which a software suite should be utilized which is both effective and efficient at scale for a large number of receivers. Initial survey of existing software suites reveals deficiencies in accomplishing this task. Therefore, this work focuses on the design and implementation of a software suite to carry out evaluation of the CORS network to determine availability and validity of positioning data provided by the network using proposed evaluation models.
4
Global Navigation Satellite Systems
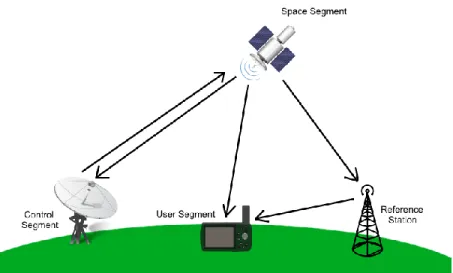
GNSSs provide the highest level of accuracy and precision for timing and positioning applications. GNSSs encompass many subsystems that operate in symphony to provide high quality positioning and timing data. Figure 1 provides a visual representation of a GNSS system. At the core of GNSS systems is the space segment consisting of the space vehicle (SV)
constellation which is a set of satellites that transmit signals used for positioning measurements at user-operated GNSS receivers. This SV constellation is complemented by a control segment which assesses the integrity of the SV data by continuously evaluating their orbits, monitoring their clock timing integrity, and performing adjustments for satellite operation and reporting based on deviations in clock or orbit. The user segment of GNSSs consists of receivers operated by users for the purpose of receiving positioning data and determining their location. While SVs alone provide a basis for making reliable positioning measurements, measurement techniques using SV signal timing data in standalone receiver positioning result in positioning solutions that are typically within 15 meters of error. For many applications, this level of error is not
sufficiently small enough. Supplemental systems for GNSS have been developed to improve the accuracy of positioning measurements to less than 100 centimeters of error. These supplemental systems are realized by networks of reference GNSS receivers that monitor and assess the quality of GNSS signal timing data for anticipated errors such as SV clock drift and atmospheric
interference of SV signals. These networks use the observed error measurements to provide position data corrections as part of DGPS techniques. The result is a high level of precision and accuracy achieved by modern GNSS systems for positioning activities, allowing GNSS systems to be applied to many processes that satisfy economic, social, and environmental needs.
5
Figure 1. Visualization of GNSS environment.
The Continuously Operating Reference Station network
The CORS network is a network of GNSS receivers managed by the National Oceanic and Atmospheric Administration’s (NOAA) National Geodetic Survey (NGS). NGS monitors and publicly provides positioning data measured by receivers owned by various government organizations and commercial companies in the CORS network to support a variety of high-accuracy and high-precision three-dimensional positioning activities. NGS continues to improve its body of available positioning data by growing the number of receivers in the CORS system and providing greater integration with GNSS systems such as Galileo and GLONASS in addition to GPS, the positioning system the CORS system was originally designed for. Today, the CORS system contains over 1500 receivers distributed in the U.S., U.S. territories, and some foreign countries. The result of NGS’s efforts and the CORS system is the largest available set of geodetic quality positioning data. The scale of the CORS network can be grasped in Figure 2, which pinpoints every CORS receiver located in the continental United States.
6
Figure 2. Map showing available CORS receivers in the continental United States. The map was retrieved from the official NOAA NGS CORS website at http://www.ngs.noaa.gov/CORS_Map/ on April 9, 2016.
Current applications of GNSS systems with CORS
The data provided by NGS and the CORS system currently supports a wide range of positioning applications and fields of research. The most supported of these is geodetic surveillance, which is the field that NGS and CORS was originally designed to satisfy. The primary objective of CORS for geodetic surveillance is continuous monitoring of the NAD 83 terrestrial reference frame to ensure an accurate reference frame for which all positioning observations are centered [1]. The CORS system and its data provided through the NGS network have also been applied to many a variety of fields. One of the most important modern applications of the CORS network is monitoring of GPS environment errors and providing corrections for user GPS position solutions. CORS offers position correction services through the On-line Positioning Users Service (OPUS) utility from which users can obtain highly accurate position solutions by
7
providing static observation data from a user GPS receiver [2]. The CORS network also includes receivers from the Federal Aviation Agency’s (FAA) Wide Area Augmentation System (WAAS) and the U.S. Coast Guard’s National Differential GPS System (NDGPS) [3], which are DGPS solutions targeted for improving position solutions of ground and aviation positioning systems, respectively. The CORS network is also used to monitor error sources such ionospheric
disturbance of GPS signals in order to test and better understand correction models for
ionospheric disturbance [4] [5]. In addition, the CORS system has been a subject of works that explore integrity monitoring of GPS signals [6]. The accuracy of these applications rely
absolutely on the quality of data provided by receivers such as those in CORS, and devastating results can occur for those who rely on the CORS network as a reference for accurate positioning data if the data is not of sufficient quality.
Existing quality evaluation methods for CORS
As part of the operation of the CORS network, the NGS enforces a couple quality analysis techniques to assure a baseline for CORS data quality and reporting. This is accomplished primarily through use of the Translation, Editing, Quality Check (TEQC) software published by UNAVCO [7]. Data recorded by each CORS receiver is post-processed by the TEQC tool to translate raw measurement data into the RINEX format, a standard format for reporting
GPS/GNSS measurement data from receivers. After this translation, the TEQC tool performs a quality check analysis on the observation data provided by the receiver to report error metrics including: number of observation samples missing, number of cycle slips, and moving average for multipath [8]. These metrics indicate patterns of unavailability and inaccuracy in the
8
deviation of CORS receiver calculated positions based on daily observation data from the published IGS08 position of the receivers. The plots are established by extensive observation data compiled over many days during the receiver’s operation, and the plots are consistent with the requirements of the CORS receiver station guidelines [1][7]. The plots indicate the level of stability in the receiver’s calculated position based on data gathered from daily measurement data. Per NGS guidelines, significant deviations in daily position solutions will result in considerations for updating the reported position of the receiver or recommending changes in receiver equipment to improve the quality of reported data.
Previous quality evaluation studies for CORS
Previously published works exist which detail methods and results of evaluating GNSS networks. One existing work is provided by Rubinov et al. [9]. This work details an integrity monitoring system for CORS with respect to data availability, latency, and metrics for data accuracy. Limitations of this work, however, include the lack of specificity of how some of these parameters are calculated, especially data availability, and that only a small number of CORS stations were evaluated. Other comprehensive studies of CORS receiver data quality exist such as that by Pukas et al. [11]. However, this study is not publicly published in its entirety, and may have limitations, including: limited number of receivers evaluated, does not report rates of data quality, and does not assess data availability from receivers.
Using a software environment for CORS network quality evaluation
Due to the large size of the CORS network, there is a respectively large repository of data that the network supplies from its receivers, presenting a big data problem for CORS network
9
evaluation. In order to evaluate such a large network, an effective and efficient software suite should be utilized. The first step here is to evaluate existing software packages which could be used for this purpose. An initial survey of such software suites reveals that deficiencies exist in available software when weighing in on: feature set, usability, and speed; this is discussed in more detail later in this work. Based on this analysis, requirements can be determined for a software suite which can analyze the CORS network effectively and satisfy performance
concerns related to analysis of a large data set. In addition, the software should be able to realize models and analysis methods which provide metrics to ascertain availability and validity of positioning data provided by CORS receivers.
Goal for this thesis
The primary objective of this work is to present and implement a design for a software suite and evaluation models to determine the availability and validity of positioning data provided by the CORS network. Critical aspects of the design of the software and the evaluation methods it implements will be unfolded and discussed. The designed software and models will be evaluated in a case study involving 708 CORS receivers. For this case study, the software will be used to evaluate the positioning data from the CORS receivers by providing data availability and validity metric results reported by the models and methods the software implements. The results from the software will be compared against results from the TEQC software for comparison. The results from this study will reveal the level of capability of the software for evaluating the CORS network. Successes, limitations, and future enhancements for the software and evaluation methods will identified and discussed.
10
CHAPTER II
METHODS
Overview of methods for evaluating CORS
To develop a comprehensive method to evaluate the CORS network, a criterion for which CORS receivers will be evaluated against is formulated. Metrics for receiver quality are discussed, and methods, models, and techniques used to calculate these metrics for CORS receivers are
presented. Next, to carry out the evaluation, a software suite should be employed. Existing software is first assessed to carry out the evaluation, and deficiencies in each will be discussed for the purposes of CORS evaluation. Based on this analysis, a set of requirements will be developed for a new set of software which will carry out the CORS network evaluation.
Components and design principles for the software that allow the requirements for the software to be satisfied will be discussed. Finally, each of the stages of processing the software performs will be detailed, noting important design considerations.
Evaluation criteria for the CORS network
This work focuses on the availability and validity of measurement data from CORS network receivers as a basis for data quality analysis. The rates of data availability and validity report the rate at which the CORS network is functioning by providing data and the rate at which the data is consistent with expectations for high accuracy. These terms are clearly defined here and will serve as the primary metrics for assessing the quality of CORS receiver data.
11 Data availability
Data availability is the proportion of time within an operational period for which data is reported and can be consumed by external users. Data availability is a critical measurement for the CORS network as it identifies the amount of time the reference network is able to provide data for consumers of the network. During periods of data unavailability, applications consuming the reference data may incur degraded quality in results or may have temporary shortages in operation until data availability recovers in the reference network. For applications in DGPS, unavailable data from the reference network results in unavailable correction data for GPS users, which may greatly degrade the accuracy of user GPS position solutions.
Data validity
Data validity refers to whether or not a piece of data accurately represents the value it is intended to represent. Data validity can be measured by administering two different evaluation methods that report the same metrics and measuring the difference between results of each, of which one evaluation method presents results consistent with normal values and is taken as the reference. For CORS receiver data, measurements of pseudorange are expected to fall within a range of values at each time instance based on the position of GPS satellites and the receiver. Therefore, applying a model that accurately predicts the values of pseudoranges based on satellite positions and the receiver position provides the normal value for the pseudorange. By comparing the pseudorange measurements reported by the receiver against these modeled results, the data validity can be determined by identifying deviations of the measurement data results from the accurately modeled results. Low data validity rates correspond to erroneous data being provided by the reference network, effecting faulty operation and inaccurate results in applications that
12
consume the data. Since receivers in the CORS network are used as a reference for DGPS, low validity rates can result in inaccurate position corrections for GPS users.
CORS receiver data and configurations
GPS receivers in the CORS network perform measurements on SV signals to report phase and pseudorange measurements used for positioning solutions. These measurements can be made on the different available channels for GPS systems. For CORS receivers, only L1 and L2
measurements are required to be reported. This work uses L1 code pseduorange as the measurement for data evaluation due to the methods employed in this work.
Pseudorange measurement data
Pseudorange is defined as the pseudo distance between a receiver and a satellite as determined by measurements made at the receiver. The pseudorange differs from the true distance between the receiver and satellite due to biases, including: satellite clock bias, receiver clock bias, and atmospheric delay. The true distance between the satellite depends on the time of signal transmission by the satellite, t1, the time of signal reception by receiver, t2, and the speed of
light, c. It can be written as:
Distance = c × (t2− 𝑡1) (1)
Then, with receiver clock bias δrc, satellite clock bias δsc, and atmospheric delay δatm, the
13
Pseudorange = c × (t2− 𝑡1) + 𝑐 × (𝛿𝑎𝑡𝑚+ 𝛿𝑟𝑐− 𝛿𝑠𝑐) (2)
For evaluation of pseudorange against models that use the true distance between the receiver and satellite, it is important to account for the effects of the clock bias and atmospheric delay.
Effects of receiver configurations on pseudorange data
Differences in receivers causes differences in measurements of pseduorange in reported data. These differences can largely be identified by the configuration parameters for the receiver. One of the most significant parameters is the elevation cutoff angle. The elevation cutoff angle parameter dictates the elevation angle above which satellites will be observed by the receiver. This affects the total number of samples that the receiver reports as it constrains the periods for which the receiver can report data for each satellite. The purpose of the cutoff angle to is to prevent the receiver from reporting low angle measurements, which contain greater atmospheric disturbance errors. However, determining an appropriate cutoff angle for a receiver differs depending on the operation and quality of the hardware receiver. As such, different receivers in the CORS network contain different cutoff angles as determined by their site operators. The cutoff angle is reported in the site log for each receiver. However, there are receivers for which this parameter is not specified in the site log.
Another significant configuration for CORS receivers is the data report rate. The data report rate configuration dictates the interval between reported data samples in the daily observation file provided for a receiver. For CORS receivers, data report rate is one of: 1 second, 5 seconds, 15
14
seconds, or 30 seconds. For the purposes of this work, only stations of 1 second are considered as they provide the most potential for validation of results.
Methods for measuring availability and validity of CORS data
Since data availability and validity are the key metrics for CORS receiver data evaluation in this work, the methods used to calculate them are provided here. Before this is done, the format of receiver data and satellite navigation messages is first discussed to precisely explain the available data for evaluation. The methods proposed here account for differences in receiver configuration for elevation cutoff. Results provided by these methods will serve as a claim to the level quality for receivers in the network with respect to the methods proposed in this work.
CORS receiver data format
Data provided by receivers in the CORS network are reported in the Receiver Independent Exchange Format (RINEX) as observation files. At the time of writing this thesis, NGS enforces RINEX version 2, which only reports L1 and L2 measurements. This is sufficient for the
purposes of this work, as only L1 code pseudorange data is considered. The structure of the RINEX file first consists of a header that reports metadata about the receiver, including: the date and overseer of data compilation, the name of the CORS receiver as designated by NGS, the start time for data reporting in the file, and the data sample report rate. Following the header are blocks of measurement data. Each block contains a header reporting the current time of the samples reported and the GPS and/or other GNSS satellites for which samples are reported. The rest of the block contains the measurement values for pseudorange, phase, and possibly other parameters which typically include signal-to-noise ratio. For the purposes of this work, the
15
reported time, the satellites observed, and the L1 code pseudoranges from each block of data are used.
Navigation message file
The methods used in this work require knowing the position of satellites for software simulation. To simulate the position of satellites, the ephemeris model is used. The ephemeris model uses precise ephemerides for satellites which are broadcasted as navigation messages by the satellites every two hours. CORS provides a daily compiled file which contains all navigation messages for all satellites broadcasted throughout the day. This file is used to retrieve the ephemerides used to calculate satellite positions for software simulation.
Measuring data availability
Since the receiver provides samples for every interval consistent with the data report rate, the data availability can be determined by counting the samples in the data observation file. Given the data sample report rate, the number of samples, ρ, that receiver r should report for one day for satellite s is given as:
ρsr =
86400 𝑠𝑒𝑐
𝑑𝑎𝑡𝑎 𝑟𝑒𝑝𝑜𝑟𝑡 𝑟𝑎𝑡𝑒 (3)
Then, the total number of samples receiver r should report for an entire day for all satellites can be determined as:
ρr = ∑ 𝜌 𝑠𝑟
16
To simplify the counting of samples in the file, the number of missing samples can be counted and the number of samples reported can be taken as:
ρr, reported = ρr− (count of missing samples) (5)
To determine how many samples the receiver should report, the elevation cutoff angle for the receiver can be used. When a satellite for observation is above the cutoff angle used by the receiver, the satellite is said to be in the field-of-view and the receiver should record and report measurements from that satellite. The elevation cutoff angle used by a CORS receiver can be retrieved by the site log for the site reported by NGS. However, an inspection of site logs for some stations reveals missing reported elevation cutoff settings. In addition, the reported elevation cutoff angle reported in the site log may not reflect the true operating cutoff angle, which is affected by obstructions in the receiver environment and limitations in the performance of the receiver. Therefore, the elevation cutoff angle for a receiver will be estimated in this work.
The cutoff angle can be estimated by first calculating the elevation of the satellite at the start and end of each continuous set of pseudorange samples reported by the receiver for the satellite and taking the minimum of these calculated angles. This reports the estimated cutoff angle with respect to the satellite for which the pseudorange samples are associated with since the start and end of a continuous set of pseudorange samples is associated with the arrival and departure of the satellite from the receiver’s field-of-view. However, the receiver may have gaps in these
sequences due to operating errors, which will result in an elevation angle that is greater than the elevation angle taken at the either the start or end of the sequence. This is because the lowest
17
elevation angle for satellite is either reported at the start or end of the sequence, and any other elevation angle between these points is necessarily greater than at least one of them. Therefore, taking the minimum of the recorded elevation angles ensures the selection of an elevation angle for the satellite best reflects the true operation of the receiver. Next, the elevation angle should be estimated with respect to all channels. To do this, the average value of all minimum cutoff angles across all satellites for the receiver is taken, yielding the estimated cutoff angle for the receiver.
Measuring data validity
To measure data validity, a method that allows for evaluation of metrics for measurement data with at least two approaches must be considered, with one evaluation approach presenting a reference for normal results. For this work, the Order of Pseudoranges (OOP) model is selected for the evaluation reference. This model uses known positions of satellites along with a given point on the earth’s surface to order the pseudoranges reported at the point for each satellite [12]. The OOP model uses this ordering to accurately predict z-events, defined as a time instances when two satellites’ pseudorange swap positions in the overall pseudorange ordering. The pseudorange data provided by receivers can also be used measure the z-events as reported by the receiver. Since the OOP model operates independently from receiver error, differences in the times of z-events reported by the receiver and the OOP model can be used to ascertain data aberrant at the receiver as the mismatches in z-event time correspond in error between the OOP model and the measurements taken by the receiver. The samples at the time of the z-event in this case are said to be invalid as determined by the OOP model. The data validity rate can then be determined as the number of z-events without aberrant results over the total number of z-events measured at the receiver.
18
Software for CORS evaluation
To carry out the evaluation of the CORS network to assess network availability and validity, a software suite is employed. The software suite should be able to retrieve and process data from many CORS receivers, potentially up to several hundreds or thousands of receivers. First, an analysis of existing software suites is done to assess the ability for existing software to accomplish to the evaluation task.
Analysis of software suites for implementation of CORS evaluation
An initial survey of software suites suitable for positioning data analysis reveals that major deficiencies exist in current software when weighing in on: feature set, usability, and speed. For feature set, the basic primitives for processing raw positioning data in RINEX format are
required. These primitives include: navigation message file parsing, observation data file parsing, satellite ephemeris model, and error correction models such as ionosphere and troposphere models. For usability, the software would ideally be open sourced or in a library format for which code could be easily written to apply desired analysis. For speed, the code would ideally be optimized to prioritize performance and designed in a language such as C++ that allows for better raw performance.
There exist many expansive software suites for GNSS positioning data analysis such as the Bernese software, but software sets such as this lack usability since they are specially tailored for specific analysis tasks and cannot be applied easily to other analysis models such as those
proposed in this work. Other software such as GPSTk and the MATLAB GPS toolkit provide all the necessary primitives for analysis and exist in a library format for which analysis code can be
19
easily written. However, performance in both of these software sets is lackluster for the purpose of analyzing something on the scale of the CORS network; performance issues related to
processing large observation files are encountered with GPSTk, and the MATLAB GPS toolkit runs in the MATLAB environment, which provides diminished performance as compared to code designed in other languages.
From this initial analysis, it is concluded that existing software suites do not provide all the requirements for feature set, usability, and performance to tackle the evaluation of the CORS network. Therefore, a new software suite is designed in this work for the purposes of analyzing and evaluating CORS network data.
Developing a new software suite for CORS evaluation
Analysis of the CORS network with a software suite poses some significant challenges due the big data problem it poses. The primary challenge is applying a GNSS processing suite which can handle the several gigabytes of raw observation data associated with hundreds or thousands of CORS receivers. Since existing software sets do not have all the necessary properties to perform the methods of evaluation proposed at scale for the CORS network, a new software suite should be developed. This software suite should provide all the necessary primitives for processing raw GNSS data for a wide spectrum of analyses to support the implementation of various evaluation models and methods. To do this, the following requirements are identified as critical aspects for a successful software design for the task at hand:
1. Provides all necessary GNSS data processing primitives necessary for handling and analyzing positioning data.
20
2. Is structured in a library format for which code can easily be written for different analysis tasks.
3. The software prioritizes speed by careful implementation of performance critical subtasks and is developed in a language such as C++ which provides fine control over
performance.
Design of software for CORS evaluation
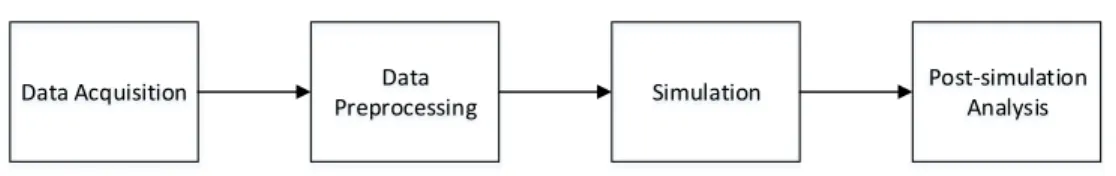
Here, the design and approach to implementing the CORS evaluation software is provided. First, a description of the performance concerns and software structure is given, and principles of the software design to satisfy program requirements are detailed. Then, the stages the software performs for the evaluation process are described, which includes: data acquisition of CORS receiver pseudorange measurement and satellite ephemeris, pre-processing of data for
simulation, simulation involving application of models and methods for receiver evaluation, and post-simulation analysis to determine final results. Figure 3 graphically outlines the stages in the software evaluation.
Data Acquisition Data
Preprocessing Simulation
Post-simulation Analysis
Figure 3. Stages of software evaluation process.
Software performance concerns
Due to the large amount of data the software must handle for CORS evaluation, careful attention to code design for performance is given. Because the program must be able to handle large sets
21
of data during runtime, there is concerns for memory usage and performance of memory access. To overcome this, the software is written in C++ to give fine control over performance of the software. In particular, the software must process large data sets that serve as inputs for the evaluation analysis. Since much of this data is reused, keeping it in memory removes the need to recalculate it, but causes significantly more memory usage. To keep memory usage low while retaining the performance gain, explicit usage of C++ reference and pointer primitives are used to prevent unnecessary copies of data between function calls. Also, to keep lookup time and modification access to the data low, data sets with 𝑂(1) lookup time and insert time are used exclusively, which includes (unordered) hash maps and vectors. For vectors, all sizes are pre-allocated prior to data insertion to reduce cost of insertions when the size of the vector is increased. Adhering to these principles for memory management served a primary role for maximizing performance of the evaluation software.
Software design structure
The software code is compartmentalized as a structured library to provide all necessary
processing code in an intuitive fashion. The purpose of this choice is to allow code for analysis to be easily written with the processing primitives that the library provides. Sections of the software were divided up as follows: data acquisition scripts, RINEX file reader and parsers, core data structures and algorithms, and pseudorange data error correction algorithms. Data acquisition scripts include the standalone scripts used to acquire RINEX observation and navigation message files from the CORS FTP servers. The RINEX file readers and parsers include code segments for reading RINEX files for both observation and navigation message formats and parsing each into convenient formats for usage in analysis code. Core data structures consists of data structures for
22
compartmentalization of different segments of the data provided by RINEX input files, including satellite ephemeris parameters and receiver observation samples indexed by time. Core
algorithms includes primitives to compute common parameters from GNSS data, including: satellite ephemeris to position conversion, translation between global positioning coordinate systems, and azimuth and elevation determination between two globally positioned points. Finally, pseudorange data error correction algorithms contain the common Klobuchar Ionosphere correction model algorithm.
Data acquisition stage
The first stage for the evaluation software is to retrieve the RINEX observation files and
navigation messages associated for all receivers to be evaluated, which are hosted on the public CORS FTP server. There are two primary challenges associated with this task. First, for a large number of receivers, a large number of observation files must be retrieved across different folders on the CORS FTP server [11]. Second, the FTP protocol is error-prone, resulting in unexpected slow connections, connection or data transfer timeouts, and communication channel failures. To overcome both of these challenges, a simple and robust web crawling software should be used to traverse the GPS data FTP server and retrieve all files reliably despite unreliable data channels. To achieve this, the wget software utility was used as part of a shell script. The wget software utility allows for robust and simple FTP file transfer calls with specification of timeout parameters and retry parameters for unreliable data transfers. The shell script that encompasses the wget invocations provides logic to determine and direct all RINEX files to be downloaded. The result of this design is a standalone shell script for easy and reliable retrieval of large sets of CORS receiver data files.
23 Data pre-processing stage
Due to the large size of data required for evaluation of many CORS receivers, pre-processing of the data into a simplified and prepared format is required. The purpose of the pre-processing stage is to extract only relevant data required for analysis. This reduces the size of the input data for the evaluation software simulation and can provide significant performance gains if multiple simulation instance runs are required. The pre-processing stage for this work involves both the navigation message files and the observation data files provided by CORS receivers. From the observation files for receivers, the pseudorange samples, the associated satellites for the samples, and the time stamp of the samples are extracted and saved to another file. From the navigation message file, the ephemeris parameters, corresponding satellites, and time of navigation message broadcast are extracted. Since the navigation file only needs to be read once and is small enough to pose no significant performance concerns for parsing tasks, the navigation message file can be processed at the start of the software simulation stage. The navigation message
pre-processing is required to retrieve ephemeris parameters, and provides little performance significance as compared to the observation file pre-processing step.
Next, common data that will be reused during the course of the simulation stage should
calculated ahead of time in this stage. Since the data is reused, there is significant performance gains by calculating the data ahead of time and storing it over the life span of the simulation run. This allows the simulation code: to use the pre-processed data without having to re-compute it across multiple steps, to be simplified and separated into distinct processing steps, and to conserve some memory by removing the large input data after the pre-processing is complete. For this work, three sets of pre-processed data were obtained during this stage. First, the
24
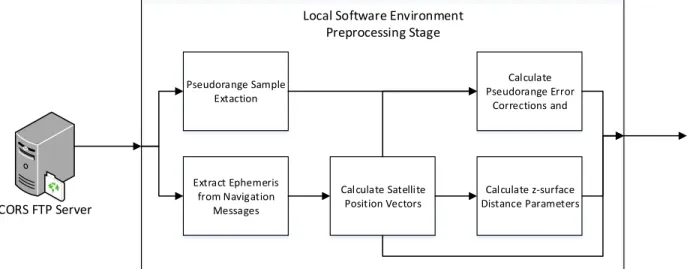
ephemeris to satellite position algorithm was applied to all satellite ephemeris data to retrieve the position of each satellite for each second of the day. Second, the atmospheric error corrections for ionosphere were retrieved for each station and stored. Finally, the curve-distance parameters related to the z-surface for the OOP model were calculated for all satellite pairs. Pre-processing of these three sets of data is useful as each set is reused throughout the OOP model simulation to determine z-events. Therefore, this pre-processing is necessary to reduce redundant calculations during the simulation stage. Figure 4 graphically outlines the pre-processing stage for this work.
CORS FTP Server Pseudorange Sample Extaction Extract Ephemeris from Navigation Messages Calculate Pseudorange Error Corrections and
Local Software Environment Preprocessing Stage
Calculate Satellite Position Vectors
Calculate z-surface Distance Parameters
Figure 4. Graphical outline of data pre-processing stage.
Simulation stage
The simulation stage is the most critical of all the stages for the software design for performance and effectiveness of the software. There are two reasons for this. First, the simulation stage typically requires heavy computation tasks across all sets of data being analyzed, which results in high computational complexity. Therefore, it is critical in this stage that all data that is reused to be pre-processed in the previous stage and that careful consideration of algorithms and data
25
structures is done to maximize code efficiency. Second, depending on the model employed in this stage, the code for the simulation steps can be quite complex. As is common with complex code segments, there is a high potential for programming bugs in the stage. To minimize bugs, the steps for the simulation code should be clearly defined and de-coupled (if possible) so that unit testing can be readily applied to different segments of the simulation code. This will result in easier code to manage and debug for model design.
In addition, the simulation stage requires simulation parameters that dictate the state of the simulation. For this work, the current time of the week was chosen to indicate the state of the simulation along with storage of results from previous time instances. This is because the evaluation methods employed perform linear processing of the pseudorange receiver data with respect to time.
Finally, concerns of the result output format for the simulation stage should be considered. Since the simulation stage represents the longest stage of the software evaluation process, the results from this stage should be reported in a format be used for different post-simulation analyses. For this work, the z-event times, corresponding stations, elevation angles for each pseudorange observable, and missing sample counts were recorded in an output file for data availability and validity rate calculations in the post-simulation analysis.
Post-simulation analysis stage
The final stage for the software is applying calculations and analysis to the results from the simulation stage to determine final outputs. For the software design in this work, this involves
26
using the elevation cutoff estimations and associated pseudorange samples, z-event records from OOP model simulation, and pseudorange data measures to calculate data availability and validity rates. Since the results provided from this stage represent the final outputs of the software, they should be reported in a format for easy visualization. This work uses the common .csv file format for output so that the results can be imported in software such as MATLAB or Microsoft Excel for quick and simple visualization and statistical analysis.
Selection of CORS stations for evaluation
In order to best verify the results of the evaluation, a select group of CORS receivers will be evaluated using the software and model described. The select stations are CORS stations with a 1 second sample report rate. One reason for this choice is to have a larger number of samples evaluated for each receiver. This will put more strain on the data availability calculation since the software will have to evaluate more samples to estimate the cutoff angle and more samples to count for availability rates; a large portion of this strain results from the potential for more missing samples. The selection of 1 second report rate stations also allows for the best resolution for the data validity measure. This is because the measurements for z-events by the software are limited in resolution to the length of time between data samples. Therefore, selecting 1 second sample rate data will ensure that the z-event estimation is close to the true time of the z-event.
27
CHAPTER III
RESULTS
Overview of results
The results presented here represent the metric results for a case study involving the evaluation of 708 CORS receivers using the evaluation models and software prescribed in the Methods section. The evaluated stations include all 1 second sampling rate CORS receivers with observation data files available on March 23, 2016. The results report the metrics involved for the data availability and data validity results for CORS stations as well as the calculated rates themselves. To keep the size of results manageable for this document, only the CORS receivers resulting the best and worst availability rates and validity rates are reported. Metrics for
availability provided by the TEQC tool on the same set of stations for data availability is also provided. For TEQC quality analysis runs, the cutoff angle used is the one reported in the site log for the respective receiver. Geographic plots of the metrics are presented here to show the
geographical distribution of results. Statistical analysis for data results availability and validity metrics are also presented for all CORS stations.
Data availability results
Tabulated results for stations with highest availability
Table 1 reports the metrics for data availability for 10 CORS receivers identified as having the highest availability rates amongst all stations evaluated on March 23, 2016. The table is sorted from highest to lowest data availability rate for the 10 stations. Table 2 reports the TEQC availability metric results for the same stations. For the tables, the expected samples column
28
indicates the number of measurements samples the receiver should have reported based on satellite positions above the cutoff angle, the missing samples column indicates the number of the expected samples the receiver did not report, the missing epochs column indicates the number of sample periods for which the receiver reported no data for any satellite, and the samples under cutoff angle column indicates the number of measurement samples the receiver reported for satellites while the satellites were below the estimated cutoff angle.
Table 1. Tabulated availability metrics for CORS receivers with highest availability rates.
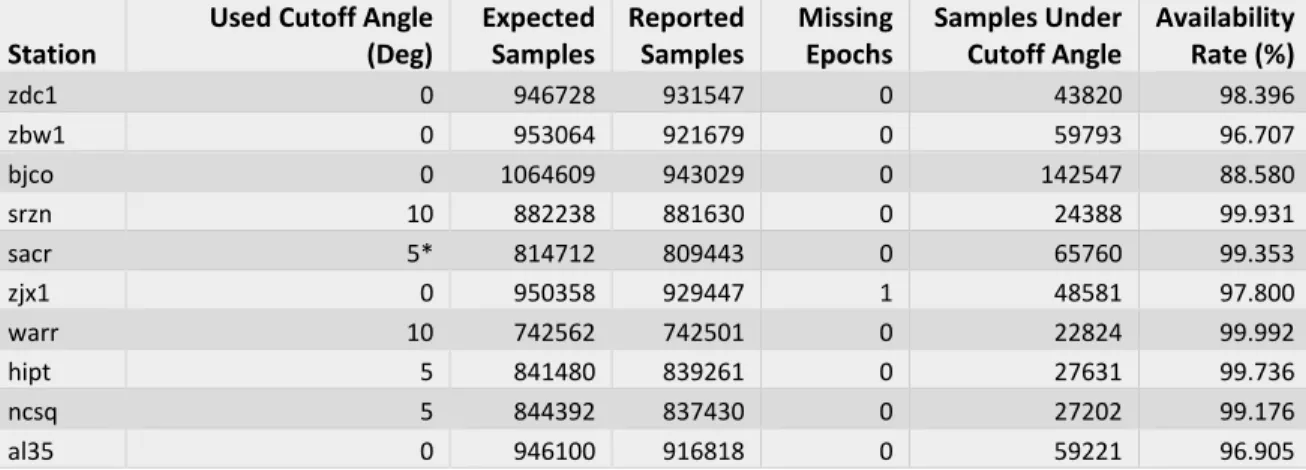
Table 2. Tabulated TEQC availability metrics for stations reported in Table 1.
Note: station sacr did not have a cutoff angle setting specified in its site log. An estimated cutoff of 5 degrees is used for the TEQC evaluation cutoff setting.
Station
Estimated Cutoff Angle (Deg) Expected Samples Missing Samples Missing Epochs Samples Under Cutoff Angle Availability Rate (%) zdc1 -0.362 953881 20891 0 1679 97.810 zbw1 0.386 943269 20849 0 2253 97.790 bjco 4.146 975768 23557 0 1124 97.586 srzn 8.958 903551 22609 0 1011 97.498 sacr 3.867 832563 20903 0 344 97.489 zjx1 -0.235 955369 24456 1 1562 97.440 warr 1.175 928830 24087 0 1984 97.407 hipt 3.890 861413 22476 0 327 97.391 ncsq 4.209 860450 22722 0 1508 97.359 al35 0.205 941675 24995 0 1220 97.346 Station
Used Cutoff Angle (Deg) Expected Samples Reported Samples Missing Epochs Samples Under Cutoff Angle Availability Rate (%) zdc1 0 946728 931547 0 43820 98.396 zbw1 0 953064 921679 0 59793 96.707 bjco 0 1064609 943029 0 142547 88.580 srzn 10 882238 881630 0 24388 99.931 sacr 5* 814712 809443 0 65760 99.353 zjx1 0 950358 929447 1 48581 97.800 warr 10 742562 742501 0 22824 99.992 hipt 5 841480 839261 0 27631 99.736 ncsq 5 844392 837430 0 27202 99.176 al35 0 946100 916818 0 59221 96.905
29 Tabulated results for stations with lowest availability
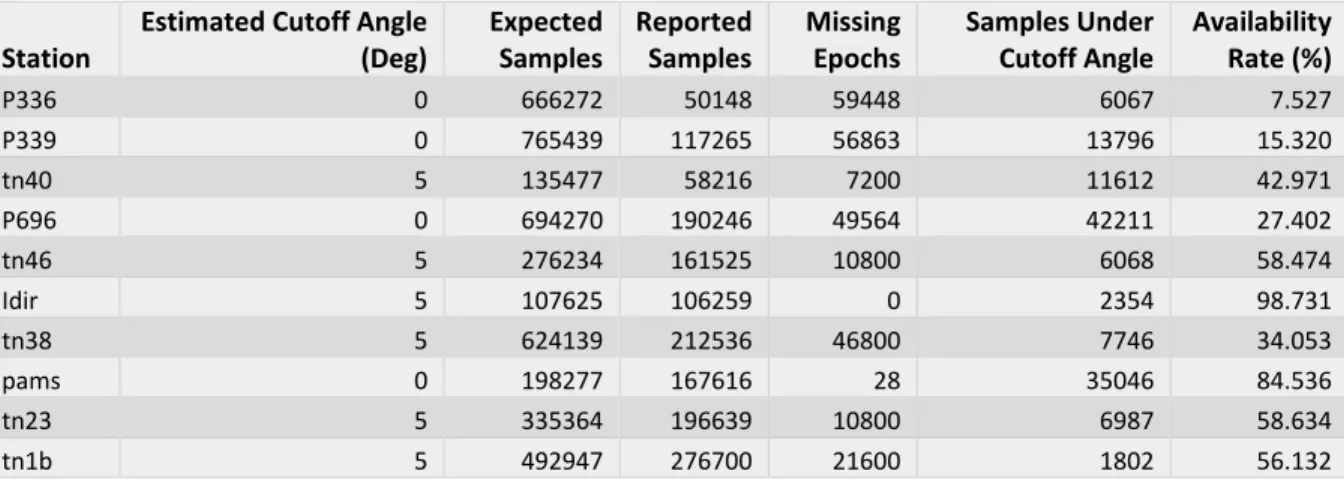
Table 3 reports the metrics for data availability for 10 CORS receivers identified as having the lowest availability rates amongst all stations evaluated on March 23, 2016. The table is sorted from lowest to highest data availability rate for the 10 stations. Table 4 reports the TEQC
availability metric results for the same stations. For the tables, the columns refer to the same sets of values as described for Tables 1 and 2.
Table 3. Tabulated availability metrics for CORS receivers with lowest availability rates.
Table 4. Tabulated TEQC availability metrics for stations reported in Table 3.
Station
Estimated Cutoff Angle (Deg) Expected Samples Missing Samples Missing Epochs Samples Under Cutoff Angle Availability Rate (%) P336 9.743 719151 675372 59585 7252 6.088 P339 4.399 856079 741499 56882 4270 13.384 tn40 16.4371 340465 291434 25199 9635 14.401 P696 4.642 756781 577473 50773 12600 23.694 tn46 11.595 577484 430373 14399 23522 25.474 Idir 9.436 374838 275089 0 8156 26.611 tn38 10.98 681288 491935 64799 25426 27.793 pams 4.929 551618 379806 67334 2987 31.147 tn23 9.147 617500 424327 64799 13688 31.283 tn1b 9.521 732257 485219 21600 30151 33.737 Station
Estimated Cutoff Angle (Deg) Expected Samples Reported Samples Missing Epochs Samples Under Cutoff Angle Availability Rate (%) P336 0 666272 50148 59448 6067 7.527 P339 0 765439 117265 56863 13796 15.320 tn40 5 135477 58216 7200 11612 42.971 P696 0 694270 190246 49564 42211 27.402 tn46 5 276234 161525 10800 6068 58.474 Idir 5 107625 106259 0 2354 98.731 tn38 5 624139 212536 46800 7746 34.053 pams 0 198277 167616 28 35046 84.536 tn23 5 335364 196639 10800 6987 58.634 tn1b 5 492947 276700 21600 1802 56.132
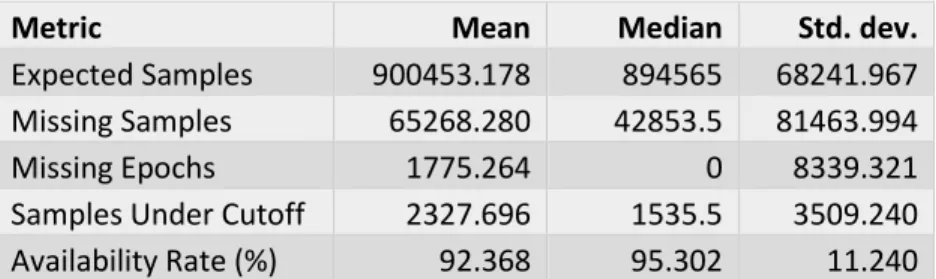
30 Statistical results for data availability metrics
Table 5 below details the mean, median, and standard deviation calculated for the expected samples, number of missing samples, number of missing epochs, samples observed under estimated cutoff elevation, and the availability rate for all CORS receivers evaluated on March 23, 2016. Figure 5 shows the distribution of the availability rates for the CORS receivers evaluated in a boxplot with outliers excluded.
Table 5. Tabulation of statistics for data availability metrics.
Metric Mean Median Std. dev.
Expected Samples 900453.178 894565 68241.967 Missing Samples 65268.280 42853.5 81463.994
Missing Epochs 1775.264 0 8339.321
Samples Under Cutoff 2327.696 1535.5 3509.240 Availability Rate (%) 92.368 95.302 11.240
31
Figure 5. Boxplot distribution of receiver data availability rates on March 23, 2016. The upper box represents the third quartile and the lower box represents the first quartile. The median is marked as the line between the two boxes, and the mean is marked as an ‘x’. The minimum and maximum values within 1.5 times the interquartile range are marked by the ends of the whiskers. Outliers below the minimum such as those provided by Table 3 are excluded from the plot.
Geographic plot of data availability
Figure 6 shows the geographical plot of data availability for evaluated CORS stations within the continental United States on March 23, 2016. The plot is reported as a heatmap with the colors corresponding to the data availability rate. Each evaluated station is marked with a blue circle to show its location. The data was generated from the software .csv output data file in Microsoft Excel 2016 using the 3D map feature.
32
Figure 6. Heatmap distribution of CORS receiver availability rates in the continental United States on March 23, 2016. Each blue dot marks an individual CORS receiver. The heatmap scale is shown in the legend, with availability rates ranging from blue to indicate lower availability to dark orange to indicate higher availability rates. Outlier stations below 88.65% availability are marked with red dots.
Data validity results
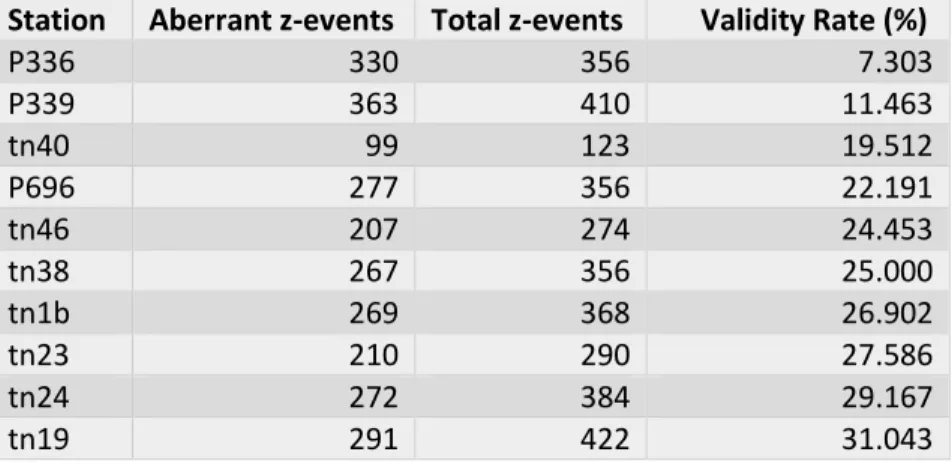
Tabulated results for stations with lowest validity
Table 6 reports the data validity metrics for ten CORS receivers which exhibited the lowest validity rates of all station evaluated as determined by the OOP model on March 23,2016. The number of z-events are reported as well as the number of z-events which detected aberrant behavior in the pseudorange data of the receiver. From these metrics, the calculated validity rate is reported.
33
Table 6. Tabulated validity metrics for CORS stations with lowest validity rates.
Station Aberrant z-events Total z-events Validity Rate (%)
P336 330 356 7.303 P339 363 410 11.463 tn40 99 123 19.512 P696 277 356 22.191 tn46 207 274 24.453 tn38 267 356 25.000 tn1b 269 368 26.902 tn23 210 290 27.586 tn24 272 384 29.167 tn19 291 422 31.043
Correlation between data validity and data availability
To show a strong correlation found between data validity and data availability rates, Figure 7 below shows a scatter plot of data validity rate vs. data availability rate. A strong linear correlation is found as shown in the figure.
Figure 7. Scatter Plot of data validity rates vs. data availability rates for data from 708 CORS stations on March 23, 2016. The scatter points represent data points for each receiver. A linear trendline is included as determined by a linear regression with the coefficient of determination shown. R² = 0.9024 0.00 10.00 20.00 30.00 40.00 50.00 60.00 70.00 80.00 90.00 100.00 0 10 20 30 40 50 60 70 80 90 100 Valid ity Ra te (% ) Availability Rate (%)
34 Geographic plot of data validity
Figure 8 shows the geographical plot of data validity for evaluated CORS stations within the continental United States as determined by the OOP model on March 23, 2016. The plot is reported as a heatmap with the colors corresponding to the data validity rate. Each evaluated station is marked with a blue circle to show its location. The data was generated from the software .csv output data file in Excel 2016 using the 3D map feature.
Figure 8. Heatmap distribution of CORS receiver validity rates in the continental United States on March 23, 2016. Each blue dot marks an individual CORS receiver. The heatmap scale is shown in the legend, with validity rates ranging from blue to indicate lower validity to red to indicate higher validity rates.
35
CHAPTER IV
CONCLUSIONS
Data availability discussion
The results for the data availability rates for the CORS network showed success for detection of missing samples by the evaluation software. The results for data availability were able to
produce a statistical distribution of the availability rates as shown in Figure 5, as well as allowed identification stations of relatively high and low availability rates. The results could also be compared with the TEQC software, which led to some important differences between the results produced by the software in this work and the results from TEQC.
One key difference between the results of the two sets of software is the cutoff elevation angles used for evaluation. The TEQC software requires a cutoff angle to be manually specified by the user for data availability calculations. This requires the user to know the elevation angle of the receiver, which many not be available, or to guess the elevation angle, which can result in incorrect availability reporting. The software implemented in this work provided an advantage here by estimating the elevation cutoff angle. This estimation can also provide a more realistic representation of the actual elevation cutoff angle, regardless of the software setting applied to the receiver, as it may account for environment constraints on the cutoff angle or performance variations in the receiver. The result is a data availability report that may be more representative of the actual number of data samples the receiver is able to retrieve. The results show some proof of this, as the TEQC results reported irregular results for the number of samples recorded under the cutoff angle and the data availability rate for some stations such as station bjco using the
36
cutoff angle specified in the station’s site log; on the other hand, the software developed in this work reported results that did not exhibit such irregularities for stations such as station bjco.
In addition, the TEQC software does not include in its count of expected observation samples periods when a satellite is operational and above the receiver’s cutoff angle, but the receiver did not report samples for the satellite. The software implemented in this work ensures that all samples that can be recorded by the receiver are counted. The result of this is that the TEQC software often reports better availability rates for stations that did not provide observations for all satellites operational throughout the day. Here, the software implemented in this work provides a better calculation of the availability rate, since the receiver should report samples for any satellite throughout the day that is operational.
Another important difference is how the number of samples is counted. The number of missing samples and samples expected in both sets of software appear to be consistent with the elevation cutoff angle used; however, the number of samples counted under the elevation angle is not. After some testing with the TEQC software, the number of samples under the cutoff angle counted does not appear to be correct. This issue is most evident with the fact that as the
specified cutoff angle increases significantly (1 degree or greater), the number of samples TEQC reports under the cutoff angle may decrease or stay the same. While the reported number of samples under the cutoff angle is not essential for measuring data availability, it does raise questions of how TEQC counts samples with respect to the cutoff angle and if these counts are accurate. The software developed in this work does not exhibit this same irregularity with respect to cutoff angle setting and number of samples reported under the cutoff angle.
37
Finally, the software developed in this work reported some interesting results for the estimated cutoff angle for some stations. For stations such as station zdc1, a negative estimated cutoff angle is reported. At first, this may seem unreasonable. However, there are some factors that can justify such a cutoff angle. First, stations such as zdc1 are FAA WAAS stations, which can be expected to exhibit exceptional performance quality since they are used in critical applications. Therefore, the receiver used for such stations might be able to reliably observe samples at very low cutoff angles. In addition, factors such as multipath effect or higher elevation of the receiver which puts its 0 degree reference slightly above the horizon may allow a lower cutoff angle. These factors seem to also apply to some receivers with an estimated positive cutoff angle that is lower than that reported in the station’s site log such as station warr. The low number of counted samples below the cutoff angle also suggests that the estimated cutoff angles are reasonable in these cases.
Data validity discussion
The data validity results from the OOP model in this work yielded limited results. Because this work does not explore the factors that affect data validity rates reported by the OOP model implemented in this work, claims about the validity rates of the receivers in the CORS network based on the results in this work will not be made. However, some important observations were made about the validity results found.
The most important result found from the validity results in this work is that the data availability rates strongly affect the data validity rates calculated based on the OOP model simulation. Figure
38
7 directly shows this. In addition, most of the stations with the lowest validity rates in Table 6 were also stations with the lowest availability rates as shown in Table 3.
The OOP model also provides limited samples that can be used for calculating data validity rates. The OOP model only provides data validity references at times when a z-event occurs at the receiver. The number of z-events found for receivers typically were very low compared to the total number of sample periods, which is 86400 for 1 second sampling rate stations for a single day. The consequence is that the OOP model only provides data validity results with respect to small number of sample periods. In addition, the OOP model only evaluates two satellites for each z-event, meaning that many samples of data for other satellites are not evaluated for validity. The conclusion is that the OOP model may not provide an accurate assessment of data validity rates of receivers using the scheme implemented in this work since the evaluation with the OOP model effectively only assesses a small set of the data provided by the receiver.
Software model approach success
The software designed and implemented in this work was successful at carrying out large-scale analysis for the CORS network. The software was able to compute data availability and validity rates for 708 CORS using techniques discussed in this work. The software can also easily
evaluate a larger number of receivers with no additional modifications. In addition, the software, whose core is designed as a set of libraries, can be readily be applied to different evaluation models and analysis for CORS network receiver data.
39
The results produced by the software allowed important visualizations of the data availability and validity results. The availability and validity metrics were output in a .csv file format, which could be readily be imported into other software such as Microsoft Excel for post-simulation analysis, including: identifying stations with poor or great availability and validity rates,
determining statistical distributions of results, and plotting the data geographically as a heatmap. The ability to visualize the result data is critical for observing patterns and aspects of the result data, especially since the result data is large for a large number of CORS receiver data being evaluated.
Future work
Since the work presented here focused on the design and implementation of evaluation models for receiver networks in software, there is little focus on the actual results that the methods employed provide. Future work on this project would include further validation of the data availability measures to determine the level of accuracy they report. The validation of the availability results here is limited to what the TEQC software tool reports. There are some discrepancies between the results from the software developed in this work and the results from TEQC with respect to the cutoff angle used for evaluation. The inconsistencies in the number of samples under the cutoff angle reported by TEQC raises suspicions of whether TEQC is a valid reference to compare availability results. Therefore, future work would include identifying or developing a correct validation reference for the data availability reported by the software developed in this work.
40
The OOP model should be further explored to determine what errors in validity it is able to detect. While the OOP model as applied in this work yielded limited results for assessing data validity of CORS receiver data, it is still a valid model for assessing errors in data from CORS receivers. Therefore, the OOP model should still be able to detect data validity errors aside from those caused by data availability issues.
41
REFERENCES
1. Snay, R. and Soler, T. (2008). "Continuously Operating Reference Station (CORS): History, Applications, and Future Enhancements." J. Surv. Eng. 134(4): 95-104.
2. Soler T., Michalak P., Weston N., Snay R., and Foote R. (2005). “Accuracy of OPUS solutions for 1- to 4-h observing sessions.” GPS Solutions 10.
3. Coloma F., Sella G., Joynt III E., Prentice R., and Denig W. “NGS Continuously Operation Reference Systems (CORS) West Facility.”
4. Wielgosz P., Kashani I., Grejner-Brzezinska D. (2005). “Analysis of long-range network RTK during a severe ionospheric storm.” J. Geodesy, Berlin 79(9).
5. Fuller-Rowell T., Araujo-Pradere E., Minter C., Codrescu M., Spencer P., Robertson D., Jacobson A. (2006). “US-TEC: A new data assimilation product from the Space
Environment Center characterizing the ionospheric total electron content using real-time GPS data.” Radio Science 41.
6. Weston N., S. R., Schwarz C., Stone W., Marion F., and Mader G. (2010). “A Near Real-time GPS Interference Detection System in the United States Using the National CORS Network.” FIG Congress 2010. Sydney, Australia.
7. National Geodetic Survey (2013). “Guidelines for New and Existing Continuously Operating Reference Stations (CORS).” January 2013.
<http://www.ngs.noaa.gov/PUBS_LIB/CORS_guidelines.pdf>
8. TEQC - Tutorial. UNAVCO. Web. Accessed 2015.
<http://www.unavco.org/software/data-processing/teqc/tutorial/tutorial.html>
9. Rubinov E., Wonnacott R., and Fuller S. (2012). "Integrity Monitoring of CORS Networks - TrigNet Case Study." South African Journal of Geomatics 1(1).
10. CORS FTP Data Server. National Geodetic Survey. Web. Accessed 2015. <ftp://www.ngs.noaa.gov/cors/>
42
11. Pukas C. M., Herring T., Melbourne T. I., Murray M. H., Phillips D.A., Meertens, C.M., Blewitt G., and Walls, C.P. (2014). “Comparing Geodetic Data Quality from PBO and non-PBO GPS Stations at Decadal and Continental Scales.” American Geophysical Union, Fall Meeting 2014. San Francisco, California.
12. Guoyu Fu and Jyh-Charn Liu (2016). “Order of Pseudoranges (OOP) of GNSS: Spatial Modeling and Analysis.” ION GNSS+ 2015. Portland, Oregon.