Risk Analysis, Driver Behaviour and
Traffic Safety at Intersections in
Motorcycle-Dominated Traffic Flow
MSc. Le Thu Huyen
Technische Universität Darmstadt – Germany
Section of Road and Pavement Engineering
Department of Civil Engineering and Geodesy
D17
MSc. Le, Thu Huyen
born in Hanoi, Vietnam
Supervisor:
Prof. Dr.-Ing. J. Stefan Bald
Co-supervisor:
Prof. Dr.-Ing. Dr.-Ing. E.h. Hans-Georg Retzko
Submission date: August 24, 2009
Examination date: September 28, 2009
Technische Universität Darmstadt Section Road and Pavement Engineering
Darmstadt, Germany D17
Risk Analysis, Driver Behaviour
and Traffic Safety
at Intersections
Fachbereich 13 Bauingenieurwesen und Geodäsie Institut für Verkehr Fachgebiet Straßenwesen mit Versuchsanstalts
Risikoanalyse, Fahrerverhalten
und Verkehrssicherheit an Kreuzungen
mit kraftrad-dominierten Verkehr
Vom Fachbereich Bauingenieurwesen und Geodäsie
der Technischen Universität Darmstadt zur Erlangung des
akademischen Grades eines Doktor-Ingenieurs (Dr.-Ing.)
genehmigte Dissertation
Vorgelegt von
MSc. Le, Thu Huyen
aus Hanoi, Vietnam
D17
Acknowledgements
First of all, I would like to express my thanks to the co-operation between the University of Transport and Communications in Vietnam (UTC) and Darmstadt University of Technology in Germany (TUD). Within the framework of this co-operation, I had an opportunity to conduct and complete this study. I also would like to express my highly appreciation to the Ministry of Education and Training of Vietnam (MOET) and the German Foreign Academic Exchange (DAAD) for supporting me a scholarship during my study in Darmstadt University of Technology.
Moreover, I would like to express my warmest thanks to Professor Dr.-Ing. J. Stefan Bald, the Chairman of Road and Pavement Engineering Section of Darmstadt University of Technology, as the supervisor during my research. During such a long period of studying, I have been closely supervised and encouraged by my Doktorvater, Professor Stefan Bald with his both scientific comments and warm motivation. I would not have completed this study without his devoted and valuable guidance, instructions and advices.
It is also my great pleasure to send my sincere thanks to the co-supervisor, Emeritus Professor Dr.-Ing.Dr.-Ing.E.h.Hans-Georg Retzko. He did many scientific discussions with me and gave me precious remarks and recommendations with his experiences in the related field. I would like to express my gratitude to Professor Retzko for his continuous cares and supports as the second referee for this dissertation.
I was also very lucky to have the opportunity to work with, as well as to obtain the supports and helps from my colleagues in the section of Road and Pavement Engineering, Department of Civil Engineering and Geodesy of Technical University of Darmstadt.
I also obtained a lot of supports from my colleagues in the Institute of Transport Planning and Management, University of Transport and Communication in Hanoi. I would like to extend my best gratitude towards all of my colleagues, especially Professor Nguyen Van Thu and Dr. Khuat Viet Hung.
I also would like to send my thankful words to all of my friends, with special words to Dipl.-Ing. Tran Ngoc Linh, and Dipl.-Ing. Le Binh Tam, who have stayed besides me and helped me a lot in this time of scientifically working.
Last but not least, my family in Vietnam played a very important role in encouraging me to overcome all the difficulties during my stay in Germany. From the bottom of my heart, my thanks are given to all my beloved family.
Abstract
Firstly applied by the U.S. Nuclear Regulatory Commission, risk analysis has quickly become an efficient methodology to apply in many industries, which have to deal with uncertainty. The nuclear industry, and more recently transportation (land and air), space, and food safety industries promote a greater use of risk analysis in their operations, and policy decision making.
Aiming at modelling the cause-and-effect chain of driver behaviour, a new methodology of risk analysis, Darmstadt Risk Analysis Methodology (so-called DRAM), has been developed 15 years ago. This present study explains the application of DRAM in the situation of motorcycle-dominated traffic flow.
In recent years, along with an amazing economical development, mobility demand in Vietnam has increased quickly, which can be clearly seen with the increased number of registered mobile vehicles. Due to its characteristics of movement and economics, motorcycles (two-wheeled vehicles) are still the most common transportation mode in the whole traffic system in Vietnam. They are also main causes to the unordered and unsafe situation of traffic system at present. The author presents findings from analysing the current situation of traffic safety. From statistical data, human behaviour is at the highest rank in the list of causes leading to traffic accidents.
The study describes different approaches to conduct risk analysis in motorcycle-dominated flow based on analysing the accident progress (dealing with the gap between normal situations and critical situations). From the physoslophy of Conflict Technique in car traffic flow, it is provided with two concepts of ―conflict zones‖ and ―conflict time segments‖ which can be further developed to determine the hazard that drivers have to face with in their left-turning movement at intersections in motorcycle-dominated traffic flow. Both concepts are relevant in case of the distinguishing characteristics of non-lane based movement of motorcycles.
After general analysis the situation, the study focuses on the main cause of the traffic unsafety in Vietnam nowadays: driver behaviours of violating road traffic regulations. Applying risk analysis methodology of DRAM, the study aims at answering three questions: (i) why do drivers violate the traffic regulations? (ii) how often do they violate the traffic regulations; and (iii) what are the consequences of such kind of behaviours. The chain of ―Driver behaviours of violating traffic regulations‖ based on ―General attitudes towards road traffic regulations‖ and ―Specific-scenario acceptance of rules‖ is constructed. A case study of two policies in Vietnam is analysed as the illustration. The results are recommended to apply to evaluate and verify traffic safety measurements in the future.
Abstrakt
Die Risikoanalyse wurde im größen Umfang zum ersten Mal von der U.S. Nuclear Regulatory Commission angewandt. Heute findet diese Methodik Anwendung in vielen Industriebranchen, die sich mit Unsicherheit beschäftigen. In der Kernkraft-, Raumfahrt- und Lebensmittelsicherheitsindustrie und in der letzten Zeit im Verkehrswesen wird die Risikoanalyse mehr und mehr für den Betrieb und für strategische Entscheidungsprozesse eingesetzt.
Zur Modellierung von Ursachen-und-Wirkung-Folgen von Fahrerverhalten wurde vor 15 Jahren eine neue Methodik zur Risikoanalyse namens Darmstadt Risk Analysis Methodology (DRAM) entwickelt. Die vorliegende Arbeit beschreibt die Anwendung von DRAM für kraftrad - dominierten Verkehr. In den letzten Jahren ist in Vietnam der Mobilitätsbedarf mit der Wirtschaftsentwicklung enorm angestiegen. Dies kann durch die Anzahl der amtlich registrierten Krafträder bestätigt werden. Aufgrund der Bewegungseigenschaften und der Wirtschaftlichkeit bleiben Krafträder (Zweiräder) weiterhin das dominierende Verkehrsmittel in dem gesamten Verkehrssystem in Vietnam. Diese Dominanz ist Grund für das „sehr lebendige― und aber auch unsicher Verkehrsystem. Analysen zeigen dass die meisten Verkehrsunfälle mit fehlerhalben menschlichen Verhalten zusammen hängen. Die Arbeit beschreibt verschiedene Ansätze zur Risikoanalyse der mit kraftrad-dominierten Verkehr, die auf der Analyse von Unfallabläufen und dem Unterschied zwischen normallen und kritischen Situationen basieren. Ausgehend von dem Gedanken der Konflikttechnik für automobile Verkehrsflüsse werden die Konzepte ―Konfliktzonen‖ und ―Konflikt-Zeitabschnitte‖ weiter entwickelt, um die Gefahren für den Fahrer bei Linksabbiegungs-Bewegungen an Kreuzungen zu ermitteln. Beide Konzepte sind geeignet zur Charakterisierung der Eigenschaften von nicht-spurgebundenen Bewegung von Krafträdern.
Nach der allgemeinen Situationsbeschreibung konzentriert sich die Arbeit auf die Hauptursache der Verkehrunsicherheit in Vietnam: nicht den Verkehrsregeln entsprechendes Fahrerverhalten. Mit Hilfe von DRAM sollen drei Fragen untersucht werden: (i) Warum verletzen Fahrer Verkehrsregeln? (ii) Wie oft tun sie das? und (iii) Welche Konsequenzen folgen aus solchen Verhalten? Die Kette von Verkehrsregeln entsprechendes Fahrerverhalten wird aus der ―Grundhaltung zur Verkehrsregeln‖ und der ―fallbezogenen Akzeptanz der Verkehrsregeln― aufgebaut. Eine Fallstudie von zwei Richtlinien in Vietnam wurde zur Veranschaulichung der Methodik diskutiert. Die Ergebnisse werden zur Bewertung und Verifikation von Verkehrssicherheitsmaßnahmen empfohlen.
Table of Contents
Table of Contents ... x
List of Figures ... xiv
List of Tables ... xvi
List of Abbreviations ... xvii
1. Introduction ... 1
1.1. Background ... 1
1.2. Problem Statements ... 2
1.3. Goals and Objectives ... 3
1.4. Organization of the Study ... 4
2. State of the Art ... 5
2.0. Introduction ... 5
2.1. Human Behaviour and Risk Analysis ... 5
2.1.1. General Overview on Methods to Analyse the Past Events ... 5
2.1.2. Qualitative Models ... 7
2.1.3. Quantifying Models ... 13
2.2. Motorcycle-dominated Traffic Flow ... 15
2.2.1. Movement Characteristics of Motorcycles ... 15
2.2.2. Motorcycle-dominated Traffic Flow ... 17
2.2.3. Legislation Obey in Motorcycle-dominated Traffic Flow ... 19
2.3. Intersection Problem: Understanding Driver Behaviours ... 20
2.3.1. Human Factors at Intersection Issues ... 20
2.3.2. Quantified Parameters ... 21
3. Risk-based analysis ... 26
3.0. Introduction ... 26
3.1. Concepts and Terminology ... 26
3.2. Risk-based Methodology ... 29
3.2.1. General Overview ... 29
3.2.2. DRAM Methodology ... 30
3.3. Modelling Progress ... 35
3.3.1. Driver Behaviour Chain ... 35
3.3.3. Progress of Modelling the Cause-and-effect Chain ... 39
3.4. Data Collecting and Processing ... 43
3.4.1. Data Requirements ... 43
3.4.2. Data Collection ... 44
3.4.3. Hypothesis Testing ... 48
4. Traffic Safety in Motorcycle-dominated Traffic Flow ... 51
4.0. Introduction ... 51
4.1. Driver Behaviour and Traffic Safety ... 51
4.1.1. Current Situation in Vietnam ... 51
4.1.2. Accident Progress ... 54
4.2. Prescribed Tasks in Left-turning Movement ... 56
4.3. Groups´ Behaviour in Motorcycle-dominated Traffic ... 61
4.4. Conflict Zones vs. Conflict Time Segments in MD Traffic Flow ... 65
4.4.1. Conflict Techniques ... 65
4.4.2. Conflict Zones ... 66
4.4.3. Conflict Time Segments ... 71
4.5. Driver Behaviour Chain in MD Traffic Flow: Recommendation ... 75
5. Road Traffic Regulation and Driver Behaviours ... 76
5.0. Introduction ... 76
5.1. Current Situation in Vietnam ... 76
5.2. Process of Decision Making ... 78
5.2.1. Theory of Planned Behaviour ... 78
5.2.2. Cognition and Motivation for High-risk Taking Behaviours ... 80
5.3. General Attitudes towards Rules ... 83
5.4. Specific-scenario Acceptance of Rules ... 89
5.4.1. Balancing between Two Risks ... 89
5.4.2. Enforcement and its Long-term Influence ... 90
5.4.3. Fear for Congestion ... 93
5.5. External Parameters ... 95
5.5.1. Intersection Level of Service ... 95
5.5.2. Infrastructure ... 97
6. Case Study: Effectiveness of Traffic Safety Measures ... 101
6.0. Introduction ... 101
6.1. Traffic Safety Measurements: Evaluating Effectiveness... 101
6.1.1. Evaluation Model ... 101
6.1.2. Vietnam Experiences ... 104
6.2. Case Study: Enforcement and its Effects to Driver Behaviours ... 105
6.2.1. Scenario Description ... 106
6.2.2. Risk Analysis Approach ... 109
6.2.3. Enforcement Effects on Driver Behaviour ... 110
7. Conclusion and Recommendation ... 118
7.1. Conclusion ... 118
7.2. Recommendation ... 119
References: ... 121 Annex A: Model of Driver Behaviour Chain of Violating Road Traffic Regulation 128
List of Figures
Figure 1. Qualitative and quantitative models ... 7
Figure 2. Recognition-primed decision making model ... 9
Figure 3. The theory of reasoned action ... 11
Figure 4. The theory of planned behaviour ... 12
Figure 5
.
Risk analysis methodologies and traditional forecasting ... 30
Figure 6. Structure of Darmstadt Risk Analysis Method DRAM ... 31
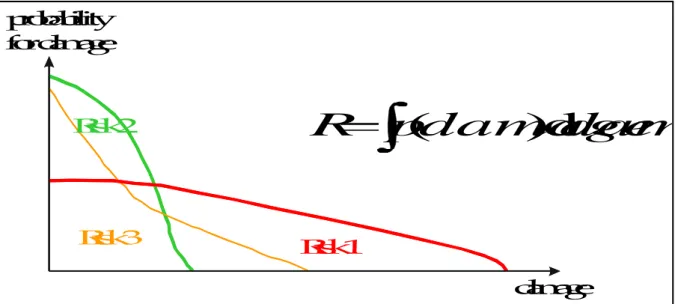
Figure 7. Description of risk ... 32
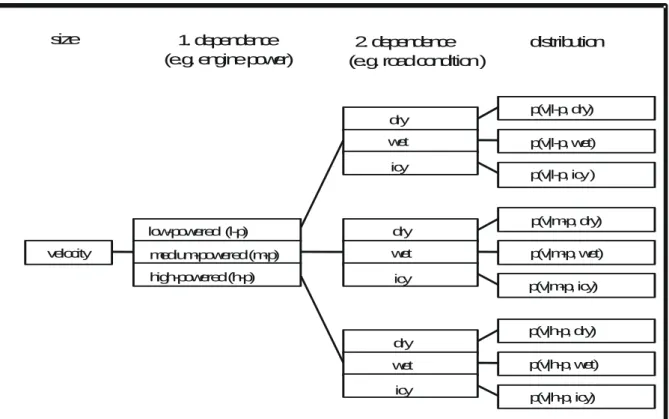
Figure 8. Example of a multidimensional probability distribution ... 33
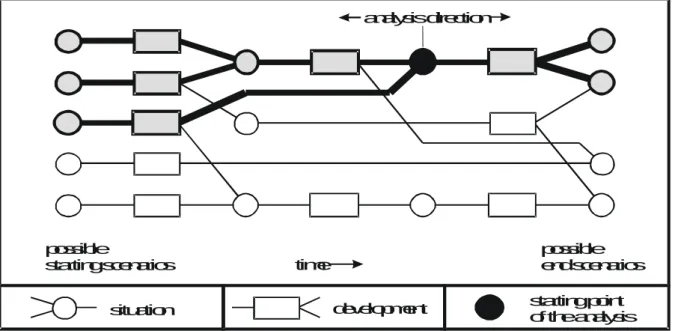
Figure 9. Describing a system with “situations” and “developments” ... 34
Figure 10. Refining the description by analysing an active element as a sub-process ... 34
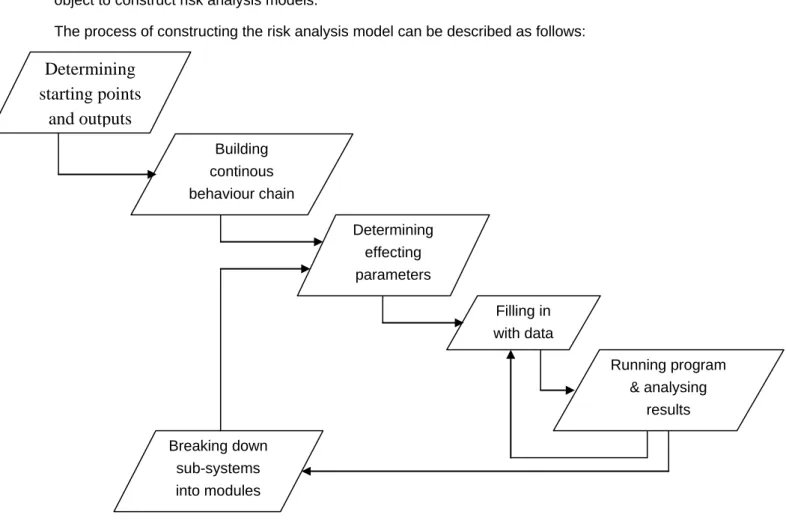
Figure 11. Process of constructing the risk analysis model ... 40
Figure 12. Accident progress ... 41
Figure 13. Basic structure of the system “road traffic” ... 42
Figure 14. A red-light running accident ... 53
Figure 15. Sketch of the red-light running accident ... 53
Figure 16. Accident progress ... 54
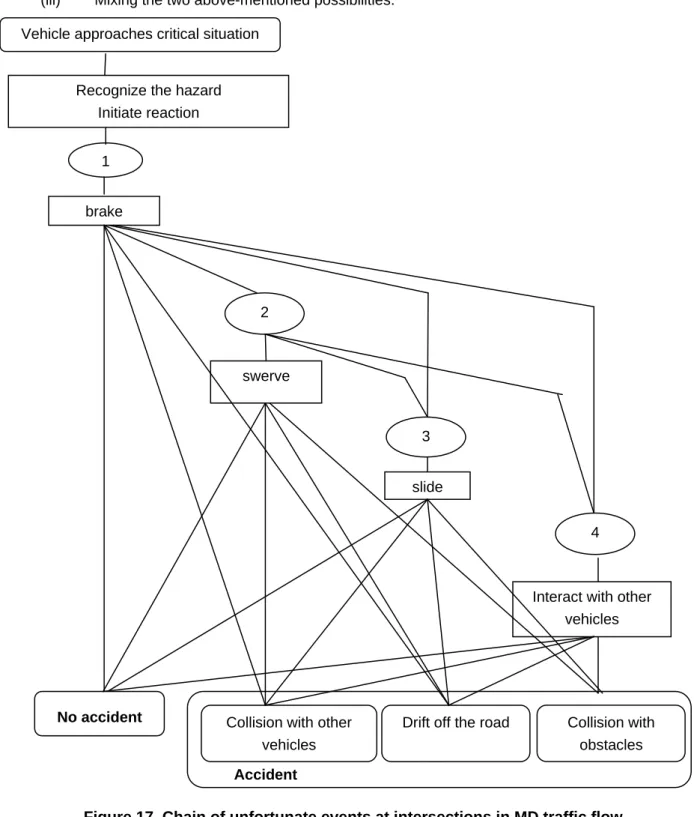
Figure 17. Chain of unfortunate events at intersections in MD traffic flow ... 55
Figure 18. Time scale of left-turning movement with stopping ... 57
Figure 19. Chain of driver behaviour in time zones analysis... 61
Figure 20. Congestion on a road segment and at an intersection ... 612
Figure 21. Mixed traffic without lane-marking ... 63
Figure 22. Disorderly traffic behaviors at intersections ... 63
Figure 23. Current situation of left-turning movement at Chua Boc - Thai Ha intersection ... 67
Figure 24. Conflicts in case of no traffic signal ... 70
Figure 25. Conflict zones with traffic signals ... 71
Figure 26. Vehicle classification due to turning trajectories ... 72
Figure 28. WE group entering the intersection while the last left-turner leaving ... 73
Figure 30. Traffic accident causes in 2003 ... 77
Figure 31. Theory of Planned Behaviour (Icek Ajzen, 1985, ver. 2006) ... 79
Figure 32. Flow chart of negotiating attitude between risks ... 81
Figure 33. Driver behaviours of violating traffic regulaltions ... 87
Figure 34. Driver general attitudes towards traffic rules ... 89
Figure 35. Driver behaviour chain of violating traffic regulations... 89
Figure 36. Total risk from different individuals ... 90
Figure 38. Traffic Volume at 9 Counted Stations (Passenger car unit: PCU) ... 97
Figure 39. Illustration for behaviours of violating the regulation of „lane separation” ... 108
Figure 40. Violation behaviour rates in National highways ... 114
List of Tables
Table 1. Average speed of motorcycles (examples) ... 49
Table 2. Major causes to road traffic accidents ... 52
Table 3. Left-turning prescribed tasks on green lights ... 57
Table 4. Left-turning on yellow light ... 58
Table 5. Numbers of zigzag movements in the first survey... 68
Table 6. Number of conflicts in the first survey ... 68
Table 7. Number of zigzag movements in the second survey ... 69
Table 8. Time segments in one traffic signal cycle ... 71
Table 9. Main Causes of Traffic Accidents (causing heavy accidents) ... 76
Table 10. Driver evaluation on critical situations ... 88
Table 11. Effects of conventional and fixed camera enforcement on speeds ... 93
Table 12. Intersection quality levels ... 95
Table 13. Quality of traffic flow ... 95
Table 14. Current situation in urban traffic flow ... 96
Table 15. Statistics on vehicles in Hochiminh city ... 99
Table 16. Describing relationships among parameters ... 103
Table 17. Influencing elements of traffic safety measurement ... 105
Table 18. Changing of the rate of motorcycles without safety helmet before, during and after
the traffic safety campaign ... 113
List of Abbreviations
DRAM Darmstadt Risk Analysis Methodology
DRAT Darmstadt Risk Analysis Tool
FMEA Failure Mode Effect Analysis
ISD Intersection Sight Distances
JBIC Japan Bank for International Cooperation JICA Japan International Cooperation Agency MD traffic flow Motorcycle-dominated traffic flow MOPS Ministry of Public Security, Vietnam MoT Ministry of Transport, Vietnam NTSC National Traffic Safety Commitee
ODV Opposite direction vehicle
PCU Passenger Car Unit
PRT Perception – Reaction Time
TPB Theory of Planned Behaviour
TRA Theory of Reasoned Action
TTC Time to collision
1. Introduction
1.1.Background
It is well known that traffic accidents are of high importance to the public health spectrum in the world. Moreover, in developing countries such as Vietnam, the mortality rate from road traffic accidents is rather high in comparison with other countries in the whole area of South East Asia. Not only the majority of the people killed and seriously injured significantly affect the quality of life of the citizens, but it has also bad influence on the economic and social development in the country.
From 1990s, thanks to its ―Doi Moi‖ (renovation) policies, Vietnamese government gained significant achievements in economy: GDP doubled for past 10 years. In the economic structure, contribution portion of industry and services are increasing. In strategy on the national economic development for the period from 2001 to 2010, the estimated growth rate will be able to remain continuously at a rate of 7.5% per year. Furthermore, social and economical living standards have very high progress. Demand for people and goods transport has the significant increase in both quantity and quality.
At the same time, Vietnam has experienced a disturbingly high increase in traffic accidents, both in number and damage rate. Statistics data reveals that number of people died and injured by traffic accident is much larger than any of the most serious diseases.
The very high occurrence of traffic accidents in Vietnam has become one of the country‘s major social issues. The past has seen many researches and applications in the field of traffic safety. This results in the application of traffic safety measures that alleviated problems in such areas of traffic infrastructure, (in-)vehicle, traffic environment, traffic management and operation, and their impacts to "traffic safety problems".
However, the importance of human factors in transport policy discussion is growing. There is a realisation that policy options that appear beneficial in principle have to be checked for the feasibility of implementation. Understanding and describing driver behaviour becomes a challenge when one tries to identify driver errors in determining accident/conflict causal factors and countermeasures.
Since 1980s, risk analysis and driver behaviour becomes the modern and advanced trend in road traffic safety research. Risk analysis in general is a systematic, model orientated and modular approach to analyse safety issues and impacts on roads. It is well known from safety analysis of nuclear and chemistry plants. Developing on the background of conflict technique, it is possible for risk-based methodologies to overcome the lack of data when accidents are such rare events. Briefly speaking, risk analysis aims at comprehensively analysing the chain of causes and effects, in order to answer three questions: (i) how (how often) do people behave in specific situations? (ii) Why do they behave that way? (iii) What are the results (how dangerous are) of such different behaviours?
In recent years, having understood the serious effects of traffic accidents to the whole society, scientific researchers, traffic engineers and policy makers in Vietnam developed many projects and researches in the field of traffic safety. Human factor is also considered as the central element in the whole system. The final target is to organize a traffic environment, which is convenient and safe for road users.
1.2. Problem Statements
There is a distinguishing characteristic between traffic flow in Vietnam (and in many other Asian countries) and those in developed countries: two-wheeled vehicles (so-called motorcycles) consist a high percentage in the road traffic system.
Motorcycle dominated (MD) traffic flow is very much different from car traffic flow due to motorcycles´ distinguishing characteristics (which can be summarized as flexibility and manoeuvrability). Therefore, there appears the need to evaluate and verify such findings and measurements concluded from car traffic flow before applying in the MD traffic flow.
Statistical data prove that in those countries with MD traffic flow, most of road traffic accidents are caused by motorcycles. Motorcycles are also classified as vulnerable users (along with pedestrian and bicycles) because there are not adequate safety facilities for motorcyclists in comparison with car drivers.
The situation of road traffic accidents in Vietnam is nowadays in an emergency situation. Since 1992, road traffic accidents have rapidly increased until 2002, the peak year of traffic accidents. The number of accidents, fatalities and injuries has reached 27,134, 12,800 and 30,999, respectively. During this ten-year period, the number of fatalities in particular has increased by 2.1 times. From 2003, the number of accidents and injuries has been dramatically decreased, but the number of fatalities is still in critical level with more than 11,000 persons per year. In comparison with those countries in the area, Vietnam has almost the worst position in traffic accidents (JBIC, Project SAPFOR for Traffic Safety Improvement in Vietnam, 2008). It is particularly needed to pay attention that the number of fatalities may be not completely reported. There is also no regulation in Vietnam in the case that there are some days from the accidents to the patient death to be calculated as death by traffic accidents. There are several reasons leading to traffic accidents. Inadequate infrastructure network is now considered as one of the biggest reason for traffic accidents. However, the problem is to find out whether it is worth investing in constructing and/or upgrading roads network. Sometimes, in newly-built roads, as drivers can reach the very high speed, traffic accidents may have much more serious results. Almost other related elements in the whole road traffic system (such as public transport, vehicle quality, traffic management and operation, etc.) are facing with such inappropriate problems with highly increasing mobility demand. Current unbalancing situation of traffic system is displayed by that status of traffic congestion and serious accidents. At the moment, road users in Vietnam are also not qualified enough to adapt with the current situation of modern and advanced developments in the road traffic system.
Traditional methodologies mostly focus on single effects of causing parameters to traffic unsafe situations. For example, in most of the statistical reports on traffic safety in Vietnam, it is written ―Speeding behaviour has the highest percentage in all causes of traffic conflicts and/or accidents‖. However, there is the fact that traffic accidents in most cases are not the result of just a single reason. If a driver rides at a very high speed, but he concentrates very much in his task of driving, and if there is no unexpected obstacle (a crossing vehicle, road sliding surface, etc.) then the probability of a traffic conflict or accident is rather low (may equal to zero). Analysing impacts of different parameters to traffic safety as well as their interacting effects can be clarified just by the modular structural approach of risk-based methodologies.
In order to be able to control traffic accidents, it is required to understand driver behaviours, their causes and consequences (effects) to road traffic safety. Many measurements can be applied to fulfil the objectives. In Vietnam, up to now, there is an urgent need of building consensus on priorities for regulation and standardisation process.
The cost of safety measures is also the very important thing to take into consideration. Many traffic safety measurements, regulations and policies have been developed and implemented in Vietnam in recent years, but the efficiency is not appropriate (high expenditures but the unsafe situation has not been much improved). The general situation in Vietnam traffic flow (especially in urban areas with condensed population) is unordered traffic, with the high percentage of traffic regulation violators. Awareness and attitudes towards legislation of road users are at a poor level. Many campaigns of legislation enforcement and educations have been released, however, such kind of campaigns are costly (in all aspects of man powers, time and expenditure). Analysing the main reasons for such kind of violating behaviours, their likelihood and their dangerous levels are responsibility of risk analysis.
In conclusion, current problems need to be solved are the fact that (i) motorcycle dominated traffic flow has many distinguishing characteristics from car traffic flow; (ii) the current situation of road traffic unsafety in developing countries with MD traffic flow, in particular in Vietnam, is the emergency problem of the whole society; (iii) simultaneous effects of different elements in traffic system need to be analysed by a modular structure of risk-based methodologies; and (iv) driver behaviours of violating traffic regulations (their causes and effects to traffic safety) has the first priority to conduct research as they lead to inefficiency of traffic operation and management.
1.3. Goals and Objectives
The research aims at establishing a modular structure to conduct risk analysis of driver behaviours relating to violating traffic regulations at intersections in motorcycle dominated traffic flow.
The final goal will be finding out answers to the question why and how often drivers (in mixed traffic flow) violate traffic regulations at intersections. These questions are organized systematically into discrete steps that involve identifying different behaviours of violating traffic regulations, determining the likelihood of their occurrence, and identifying their consequences.
In order to reach such goals, the following objectives should be fulfilled: Doing research on models of risk analysis and road traffic safety.
Doing research on the current situation of traffic safety and accidents with emphasis in Vietnam motorcycle dominated traffic flow.
Analysing to understand driver behaviours of violating traffic regulations at intersections in urban areas.
Constructing concepts and methodology of risk analysis and driver behaviours in motorcycele-dominated traffic flow.
Establishing a modular structure of cause-and-effect chain to conduct risk analysis of driver behaviours in a specific scenario.
1.4. Organization of the Study
The study is structured into seven Chapters:
After the first chapter of Introduction, chapter 2 provides general overview on the literature review, dealing with human behaviour and risk analysis (focusing on introducing both qualifying and quantifying models). Some researches on motorcycle traffic flow and driver behaviour at intersections are also mentioned in order to provide guidelines for the whole research.
Chapter 3 describes methodologies using in the research. After providing concepts and terminology using in the whole study, there is a brief comparison between risk analysis methodologies and traditional diagnosis methodologies. From that point, a methodology of risk analysis, named as DRAM, is discussed briefly. The progress of constructing cause-and-effect chain of driver behaviour as well as working with probability distribution variables/data (so-called risk values) is consequent topics in this chapter.
Chapter 4 aims at understanding left-turning movements at intersection in the motorcycle traffic flow. The chapter focuses firstly on the accident progress, which deals with the gap between normal driving and reaction to critical situations. Description on the scenario of left-turning movement as well as different approaches to conduct risk analysis at intersections in motorcycle dominated traffic flow in big cities in Vietnam is provided. There are arguments on two concepts of ―conflict zones‖ and ―conflict time segments‖ which can be further developed to determine the hazard that drivers have to face with in their left-turning movement at intersections in motorcycle-dominated traffic flow. Both concepts are developed from the physolophy of Conflict Technique in car traffic flow, with the modification in order to be relevant in case of the distinguishing characteristics of non-lane based movement of motorcycles.
Chapter 5 deals the driver behaviour of violating road traffic regulations. The chain of ―Driver behaviours of violating traffic regulations‖ based on ―General attitudes towards road traffic regulations‖ and ―Specific-scenario acceptance of rules‖ is then constructed. This chapter would like to analyse the influence of external parameters on the behaviour of violating traffic regulations. Enforcement and its effects on driver attitudes towards driver behaviour is the very first topic. Congestion and ―fear of getting stuck‖ are mentioned the next. The other interested parameters are those of traffic signals, infrastructure and rules of priority at intersections.
Briefly speaking, in order to construct the cause-and-effect chain, the research focuses on the central idea that driver behaviour of violating traffic regulations are results from ―general attitude towards legislation‖ (long-term) and ―specific-scenario acceptance of rules‖ (short-term). The final target of chapter 5 is explaining all (external) influencing parameters as well as (internal) driver cognition-motivation-action (behaviour) chain.
In chapter 6, the constructed cause-and-effect chain of violating traffic regulations will be described with all parameters and their developments. Discussion on parameter classifications/values and their probability distribution will be provided. Data requirements and data availability as well as suggested methodology of collecting and processing data will be the next theme. Final topic will be case study from field surveys in Vietnam.
2. State of the Art
2.0. Introduction
This chapter provides general overview on the literature review, dealing with human behaviour and risk analysis (focusing on introducing both qualifying and quantifying approaches). Some researches on motorcycle traffic flow and driver behaviour at intersections are also mentioned in order to provide guidelines for the whole research.
2.1. Human Behaviour and Risk Analysis
2.1.1.General Overview on Methods to Analyse the Past Events
Most of the recent investigations were based on statistical analysis of accidents. They focus on subject-specific parts of the complex system road traffic. Knoflacher et. al. [1983], Baumann [1984] and Durth, Bald [1988] already mentioned that the complexity often leads to practical and methodical problems.
On the one hand, practical problems raise due to lack of data because accidents are very rare events. On the other hand, accident data is often of poor quality as the police officers have to produce them in addition to other tasks. The poor quality of data may be solved by special training programs but in reality there is still no practicable solution.
The main methodical problem is the difficulty to make safe statements because of the complex system road traffic with many degrees of freedom of many non-linear correlations and lack of knowledge on variable correlations.
Statistical Regression and Correlation
Regression analysis tries to find the correlations among variables (―input‖, ―output‖) by analysing the dispersion (correlation) and approximately by finding formulas (regression) [e.g. Durth, Bald 1988]. Many research groups worked on the task of regression and correlation analysis on road traffic systems during the 1980s. They used this methodology to work on traffic safety and find the correlations between the road environment (road design and infrastructure) and accident causes (e.g., Neuman, Glennon and others [1983], Palavisini [1983]).
In general, correlation analysis is a statistical technique that evaluates the relationship between/among two or more variables; i.e., how closely they match each other in terms of their individual mathematical change. The question is whether the second variable (Y) also moves or changes in such a similar or complementary direction if one variable (X) moves or changes in a certain direction,.
The partial correlation considers not only of the connections between one input variable and the output variable but between different input variables [Durth, Bald 1988].
The goal of regression analysis in the stricter sense is to determine the best coefficients for a function to fit the real/practical correlations. In linear regression, the function is a linear (straight-line) equation. If there is more than one response variable, it is called multivariate regression.
A special case of this analysing method is the analysis of variance (ANNOVA). It is used if the correlations can not be described by a formula. The influences of the system are grouped in several independent nominal variables with assumed different effects to the system. The analysis of variance
investigates whether the differences between the influence of the different variables is bigger than the variance of the influence of each variable itself. The analysis can confirm the purpose of the subdivision of the variables.
The research does not lead to well founded results because of the non-linearity of the whole system. There is a need for another methodology which considers the real cause-and-effect-chain between the variables and the accident. The driver behaviour, the design of the vehicles, infrastructure, etc. should be included in analysing the chain of causes and effects.
Conflict Analysing Techniques
A big problem of statistical analysis of accidents is the lack of data. Accident events is very rare. To enlarge the amount of data the analysis of conflict situations started in the 1960s. In Germany, Erke et. al. [1978] and Zimolong [1982] gave a first overview. Perkins and Harris [1968] started using conflict analysing techniques consequently [PIARC, 2003]. In 1985, Erke et. al. formulated a handbook for such topic.
The assumption for using that method is that situations with many conflicts have a higher probability than accidents. Trained observers regard traffic situations, classify with specific (target) criteria and count ―conflicts‖. Conflicts are actions of road users, which may lead to problems (late braking, cutting of bends, …). Several measurements have been proposed to characterize traffic conflicts in detail. For example time to collision (TTC), deceleration rate (DR), encroachment time (ET), post encroachment time (PET), etc. are used to determine the severity of a traffic conflict objectively [PIARC, 2003]. This technique enlarges the amount of data but the used parameters resulting from the manoeuvres are not necessarily direct indicators for risk of accident and reduction of severity.
Those methodologies are constructed at the aim at well understanding events which already happened. Risk analysis methodologies have the central idea of conducting diagnosis and forecasting for the future events.
Risk-based methodologies
In the 1980s Mahalel [1983] proposed the methodology of analysing the whole system ―road traffic‖ to describe the correlation between reference values and accidents. Most of these correlations are non-linear. Therefore Mahalel demands on considering complex correlations: ―The task of the researcher involved in risk analysis may be seen as the search for a black box in which input is exposure and in which output is accidents and their probabilities‖.
Risk analysis in general is a systematic, model orientated and modular approach to analyse safety issues and impacts on road traffic system. Different methods are available in the domain of (traffic) safety to model a system and to obtain risk values. Among them are such techniques as hazard and operability analysis (HaZOP) (CCPS 2008), event and fault trees, elicitation of expert judgement, human reliability analysis (e.g., Bieder et al. 1998, Macwan and Mosleh 1994, Swain and Guttman 1983), simulation, FMEA (Failure Mode Effect Analysis). In order to estimate risk values, there may be such techniques as quantitative, semi-quantitative, qualitative techniques, or a combination.
Based on FMEA methodology, Darmstadt Risk Analysis Methodology (DRAM) with its tool Darmstadt Risk Analysis Tool (DRAT) have been constructed 15 years ago. Details on the methodology will be explained in the next chapter. The methodology is also further developed in order to apply into solving traffic safety problems in motorcycle-dominated traffic flow.
Durth et al. (1994) distinguishes qualitative and quantitative models based on criteria of diagnosis correctness and application easiness.
Figure 1. Qualitative and quantitative models
The following parts discuss on the state of art related to different approaches of risk analysis.
2.1.2. Qualitative Models
The importance of human factors in transport policy discussion is growing. There is a realisation that policy options that appear beneficial in principle have to be checked for implementation feasibility. O. Carsten (2001) argues that the problem is not unsafe drivers or unsafe road users, but the unsafe complex system. If we identify human error as the major component in traffic accidents and then implicitly blame the driver, we are in danger of blaming the victim of a poor traffic system. We know that the individual accident is an unpredictable event, but we also know that accidents as an aggregate are systematically over-represented at certain locations and in certain circumstances (at junctions, urban junctions, at night, ...).
Understanding and describing driver behaviour become a challenge when one tries to identify driver errors in determining crash causal factors and countermeasures. Access to data related to crashes is usually based on crash statistics and restricted to general characteristics of the involved drivers, such as gender, age, type of vehicle driven (Kim et al. 1999). Very rarely are the actions and manoeuvres that led to a crash addressed. The investigation of pre-crash actions and manoeuvres usually relies on either focus groups involving officers who respond to crashes or drivers involved in crashes (Wierville et al. 2002, Larsen and Kines 2002). They therefore rely on subjective sources. Another approach adopted for understanding why crashes occur consists of linking general characteristics with known issues of specific group, such as age linked with perceptive and cognitive deficits (Hakamies- Blomqvist 1996).
Wierville et al. (2002) proposes the following definition of driver error based on Reason‘s seminal work: ―… the failure to achieve a sequence of mental or physical activities through a thought-out plan-of-action. For example, within the driving environment, an error is committed when a driver does not successfully stop for a red traffic light because he or she depresses the accelerator instead of the brake pedal‖. Safety research Qualitative modell Quantitative modell Correctne ss in diagnosi s Easin ess in a pplicat ion
Wierville et al. 2002 classified driver errors into groups of inadequate knowledge, training, skill (lack of understanding or misunderstanding of traffic laws, vehicle kinematics, physics, driving techniques, driver capabilities, limitations), impairment (fatigue and drowsiness, Use of illegal drugs, alcohol , health related to illness , lack of use of, incorrect use of medication, disability, uncorrected disability), wilful inappropriate behaviour (purposeful violation of traffic laws, regulation, aggressive driving, use of vehicle for improper purposes), infrastructures/environment problems (traffic control device related; roadway related: alignment, sight distance, delineation; weather, visibility related). The driving performance problem can be raised up as: failure to perceive or perceive correctly; incorrect assumption; incorrect cognitive processing; failure to act and incorrect action.
TRB 2002, [118] also mentioned the definition of human risk factors as those factors attributing to the people in the system and ―include both factors that cannot be directly changed (e.g., age, gender, personality, information processing, cognitive ability) and those that can be changed (e.g., experience levels; training, education, and qualifications; substance use; compliance; peer pressure)‖. Relating to this approach, there are many states of art conducting in-depth analysis of a limited amounts of real accidents in order to have good understanding on accidents and their causes. Then give out qualitative assessments of driver behaviour. Many researches classify drivers based on their age, genders, etc. and evaluate risk levels of each group of road users. The following part tries to summarize some common models of risk analysis in this approach.
One technical discipline that provides methods and tools for modelling and analysing human contribution to risk is known as human reliability analysis (HRA) (TRB 2008, Special report 293). Objectives of HRA are (i) to identify human failure events in the context of risk scenarios; (ii) estimate human error probabilities; and (iii) provide a causal explanation for the errors to support the development of preventive or mitigating measures.
The application of decision-making models to driving behaviour has recently included the application of naturalistic models to drunk driving and speeding behaviour (Harrison, 1998, 1999b). Naturalistic models of decision-making describe the processes underlying decision-making by experienced people in dynamic, complex environments such as those experienced when driving. They are well suited to application in the more-general area of hazard perception and are discussed here as a framework for better understanding hazard perception as a cognitive process with behavioural outcomes.
The recognition-primed decision making model (RPD) of Klein (1989, 1993) was used by Harrison (1998, 1999b) in relation to speeding and drink-driving behaviours. It seeks to provide an underlying cognitive structure for decision-making in contexts such as driving, where behaviours must be generated in response to complex, dynamic sensory inputs when the decision-maker is time-pressured and operating under competing motivations. The model is summarised as follows.
Figure 2. Recognition-primed decision making model
The RPD model emphasise the role of experience in decision-making, recognising that experience in a particular behavioural context provides the basis for the cognition of common situations and the generation of behaviours or choices based on previous experience. The RPD model therefore provides a mechanism that allows faster, more efficient (and potentially more reliable) decision-making in complex situations such as those faced by drivers. Where situations and cues in the driving environment can be matched to commonly-experienced situations, behaviours associated with them in the past can be used in the present to reduce the need for a conscious decision-making process. The potential value of this mechanism for hazard-related behaviours is clear.
Klein suggests that there are a number of stages in the behavioural decision making process. The first stage (Situation Recognition) involves the classification of the context or situation as either novel or familiar. This most likely involves the mapping of current perceptions onto internal representations of previously experienced situations until a match is found. Where a match is found, potential behavioural responses depend on what behaviours were successfully used in that situation before.
Thus the send stage (Serial Option Evaluation) of the RPD model involves the generation of an ―action queue‖ of potential behaviours ordered in terms of their ―typicality‖ as responses to similar situations in the past, and then the evaluation of them one at a time until one is judged to be a satisfactory behaviour in the current context or situation. Evaluation of the potential behaviours is based on a mental simulation of the likely consequences of the behaviour based on prior experience and other expectations, and under the RPD model the cognitive computations required to evaluate these consequences are only required for as long as it takes to find a satisfactory (not necessarily optimal) behavioural response.
Perception
Test for Satisfaction Search long-term store for
same or similar cues
Behaviour Situational Cues
Situation Recognition
Serial Option Evaluation Search long-term store for
same or similar cues
Search long-term store for same or similar cues
Thus the driver might be viewed as responding to the changing situation in the driving environment by a constant mapping of current perceptual cues onto stored information about prior driving experience, and favouring behavioural responses that match behaviours commonly associated with those cues in the past.
Qualitative parameters are normally stated in the verbal ways at which point, DRAM methodology shows one of its advantages which allows to describe and coordinate parameters and their relationship in verbal variables
There are some qualitative models to describe driver behaviour including (applying in order to proceed predicting and ultimately changing the behaviour that leads to crashes): HBM (the health belief model), TRA (Theory of reasoned action), TPB (Theory of planned behaviour). These theories draw mainly on the disciplines of sociology and psychology; in particular, social psychology.
The HBM was developed in the 1950s, with the central idea of concerning over people‘s unwillingness to take up disease prevention initiatives. Essentially it consists of four aspects such as:
Perceived susceptibility: the extent to which someone feels that they are likely to contract the condition;
Perceived severity: how severe the consequences would be if they did contract the condition; Perceived benefits: whether the individual feels that taking preventative action would indeed reduce the risk of contracting the condition; and
Perceived barriers: the estimated negative effects of taking the health action (costs, discomfort, time, pain, difficulty, etc.)
(Janz & Becker, 1984)
HBM theory was applied in some works, for instance, Rutter et al., 1995 with 2051 postal questionnaires to assess beliefs relating to behaviour and crashes. Then a second questionnaire was posted 12 months later to examine the self reported behaviours, crashes, and other measures such as exposure that had occurred during that 12 month period. They found that the best predictor of crashes was the self-reported behaviour of breaking laws and rules (i.e., speeding, breaking traffic law, breaking the highway code, riding too close). Once demographic factors such as age, sex, education, experience and training were accounted for, four significant predictive factors of law breaking behaviours are such as feeling safe, having fun, good bike performance and safety, and risk of crash (Rutter et al., 1995).
TRA (Theory of reasoned action) (Ajzen & Fishbein, 1980; Fishbein, 1980; Fishbein & Ajzen, 1975) postulates that intentions are the best predictor of behaviour. Intentions are formulated via a reasoned process whereby the individual considers the consequences of their actions, either implicitly or explicitly. The behaviour reasoned to be the most likely to achieve the most positive outcome for the individual is then enacted.
The TRA Hypothesises two determinants of intentions: attitudes and subjective norms (see Figure 4) which are underpinned by attitudinal and normative beliefs about the consequences of the behaviour. The strength of a person‘s attitude (i.e., their positive or negative evaluation of performing the behaviour) combined with the weight of social pressure they perceive they are under to perform the behaviour (subjective norm) will influence the strength of their intention to perform the behaviour and the sub-sequent action.
Figure 3. The theory of reasoned action
(Source: Figure adapted from Fishbein and Ajzen (1975))
Some other researchers also study driver behaviours using TRA models such as Budd, North and Spencer (1984), Stasson and Fishbein (1990), Rutter et al. (1992), Trafimow and Fishbein (1994), Beck (1981) and Carbonell Vaya et al.
The theory of planned behaviour (TPB) has been used as the basis of a number of road safety studies in an attempt to understand issues such as speeding and other traffic violations (Newnam, Watson & Murrary, 2004; Parker, Manstead & Stradling, 1995; Parker, Manstead, Stradling, Reason & Baxter, 1992; Parker, Stradling & Manstead, 1996), bicycle helmet use (Lajunen & Räsänen, 2004; Quine et al., 1998; Quine, Rutter & Arnold, 2001), pedestrian behaviour (Evans & Norman, 1998), transport modal choice (Bamberg, Ajzen & Schmidt, 2003; Forward, 2004), drink driving (Gordon & Hunt, 1998; Sheehan et al., 1996) and seatbelt use (Gordon & Hunt, 1998).
Aen (1985; 1988; 1991) formulate the TPB to take account of behaviours which are subject to factors over and above an individual´s motivation to perform the behaviour; that is, factors which may be outside the volitional control of the individual (see Fig. Duoi). Essentially, like the TRA, the TPB assumes that a person´s salient beliefs underpin behaviour. With the TRA, beliefs influence the attitudes and subjective norms, which in turn are determinants of intention, which then leads to the resuliting behaviour. The TPB introduces a third determinant, perceived behavioural control (PBC). PBC is also underpinned by beliefs and is included to take account of factors which are perceived to be not completely under an individual´s control.
Attitudinal beliefs Normative beliefs Attitude Subjective norm Intention Behaviour
Figure 4. The theory of planned behaviour
Ajzen (1991) argues that the predictive value of the determinants of intention and behaviour will vary across situations and individuals. For example, for some situations, attitudes may be a more important predictor than normative influences. In others, or for other individuals in the same situation, perceived behavioural control may be the best predictor. In short, the theory Hypothesises that these three factors (attitude, subjective norm, perceived behavioural control) influenced the behaviour of most people, although the exact amount of influence exerted by any one of these factors varies according to the particular person and the particular situation. In most people, however, the strength of intention in conjunction with estimates of perceived behavioural control (PBC) will determine the behavioural outcome. Where a person has sufficient actual control over the behaviour in question, intentions alone will predict this behaviour.
Applying Theory of planned behaviour (TPB), Bary Watson et al. reveal six types of behaviours which were commonly believed to influence the safety (or risk levels) of motorcycle riding.
Extending the TPB. The TPB model allows for additional predictive constructs to be included in the model provided they can be argued as causal to intention or behaviour and independent of the theory‘s existing constructs (attitude, subjective norm, and PBC) (Ajzen, 1991). In an attempt to develop a better predictive model for a given behaviour, many recent studies have extended the TPB to incorporate other independent variables. This is at least in part, due to the relative weakness of the subjective norm to predict intentions or behaviour found in many studies Ajzen, 1991; Armitage & Conner, 2001a; Farley, Lehmann & Ryan, 1981; Johnston, White & Norman, 2004; Terry & Hogg, 1996; Terry, Hogg & White, 1999). The poor performance of subjective norm, according to Ajzen, shows the importance of ―personal considerations‖ over ―perceived social pressure‖ (Ajzen, 1991). However, Terry and Hogg (1996) argue that social influences are important and have not been adequately captured by the traditional TPB realisation of this construction.
The weakness of the subjective norm may also be partially explained by findings which show that, for the majority of people, their attitudes are most likely to predict their intentions. Some people‘s intentions are influenced primarily by the social component of the model which is represented by the subjective norm (Trafimow & Finlay, 1996). Whilst this finding suggests that people are predisposed to being more attitudinally or normatively controlled, further studies have found that specific behaviours may also be more usually attitudinally or normatively controlled, regardless of the individual‘s
Attitude
Subjective norm Intention Behaviour
Perceived behavioural control
disposition, and that attitudinally controlled intentions are more likely to be carried out than normatively controlled intentions (Sheeran, Norman & Orbell, 1999; Trafimow & Finlay, 2001). These findings were supported by Johnston, White, and Norman (2004) who further speculated that strengthening the subjective norm with a social identity construct may improve the norms-intention relationship for all people, regardless of their attitudinal or normative disposition.
In summary, Barry Watson et al. conclude that there are empirical evidence of main factors relating to motorcycle crashes, providing clear evidence that the vast majority of motorcycle crashes are the result of human error.
Whilst external factors, such as other vehicles and poor road surfaces, are acknowledged as serious problems that require separate attention and intervention, the fact remains that a more defensive and attentive riding style could reduce the frequency and seriousness of these types of crashes.
The authors also raised up three research questions.
- What behaviours do riders identify as being directly related to safe and risky riding? - What are the psychological factors that influence rider intentions and behaviour?
- What is the impact of other riders on intentions and behaviour in a group riding situation? Such questions reflects exactly three main research question in the approach of risk analysis. Theory of Planned Behaviour will be applied to give the first clue in the research when taking into consideration driver behaviours of violating road traffic regulations.
2.1.3. Quantifying Models
There are also many researches aiming at quantified elements related to driver behaviours in order to conduct modelling and simulation with computer supports. This approach focuses on distinguishing driver behaviours between different groups of drivers. The common criteria to separate driver groups are age, experience and gender.
Factors related to driver behaviours which are taken into consideration are those of hazard perception skill, sensation seeking and risk behaviour (Jonah, 1997), personality and social factors (Jung & Huguenin, 1992), drink driving (Deery & Love, 1996), automation, and workload management.
Quantified elements applied in the fields are such as perception – reaction (decision) time, acceleration/deceleration, headway, gap acceptance,… Then some models calculating risk levels in traffic flow have been developed such as: models of lane-keeping, car-following, gap acceptance… Karin F. M. Aronsson (2006) reviewed researches on speed and factors influencing drivers´ speed choice. Karin F.M.Aronson summaried models (mathematical) of operating speed for urban conditions. Numerous studies measured speed on rural roads and in free flow traffic conditions. The free vehicles are in many studies defined as having a minimum headway of 5s to the vehicle ahead.
A number of methods for speed modelling were developed and used. The collected empirical data built a foundation for analysis of speed and flow relationships and the estimation of passenger car equivalences (PCU/PCE) for all vehicle types.
There are some speed models on urban roadway in the U.S which is summarised by Wang, Dixon, Li and Hunter (2006) and are listed in the following table (see review of Karin F.M.Aronsson (2006)). The models are based on operating speed, which is defined as the speed at which drivers are observed
operating their vehicles under free-flow conditions as defined in the AASTO Green Book 2001 (Fitzpatrick, Carlson, Brewer et al. 2003). The 85th percentile of the distribution of observed speeds is frequently used as a measure of the operating speed in the U.S. for design purposes. The majority of the speed models are empirical and based on spot speed measured at horizontal curves. Local roadway characteristics serve as the independent variables.
Wang et al. (2006) developed operating speed models for low speed urban street segments based on roadway alignment, cross-section characteristics, roadside features, and adjacent land uses. The model was computed from second-by-second in-vehicle GPS data from two hundred randomly selected vehicles in Atlanta, Georgia. Regression analysis was used to select the model variables. Conclusions of the study were firstly that the number of lanes per direction of travel has the most significant influence on drivers‘ speed on urban streets. Variables such as kerbside parking, pavement presence, roadside object density and offset, T-intersection and driveway density, raised kerb, and adjacent land use were also significant.
Karlgren (2005) developed a speed model for nine streets in Gothenburg, Sweden, by use of multiple regression analysis. Observed mean speed for street segments was formulated as a function of the parameters average carriageway width, number of passing vehicles per hour in the current direction, number of parked vehicles per 100 metres, number of pedestrians and cyclists crossing the street per hour and 100 metres, and average width from pavement to nearest building or tree. A simplified model was developed and presented in an equation of segment speed (as the output) and vehicle flow per hour, average carriageway width and number of crossing pedestrians and cyclists per hour (as input values).
Godthelp, Milgram and Blaauw (1984) proposed that drivers control their lane keeping task using time-to-line-crossing (TTL) as a control variable. This means that, for every moment on the road, a driver knows (or he/she has an impression of) how much time it takes before the vehicle crosses the edge or center line and drives off the road.
Another continuous control task in driving is car following, for which a time-base control variable can be defined as well. It was first proposed by Lee (1976) who described a model in which drivers, when following the car ahead, control braking by means of a time-related measure, or time-to-contact. In this, driver adjust speed by accelerator and brake application to control the time available to the moment of collision with the rear-end of the vehicle ahead.
Besides, there are also other researches conducting on other quantified values such as PRT (perception and reaction time), acceleration rate, gap acceptance, etc.
In conclusion, there are three big groups of quantified values which are often deal with time, distance and vehicle dynamics (speeds, acceleration rates, etc.). However, this study would like to work with driver behaviour as the central point of the whole traffic system. The major target will be constructing fundamental concepts and framework to deal with the new methodology of risk analysis. Therefore, the study just applies the physolophy of TPB as the fundamental for analysing driver behaviours of violating traffic regulations in MD traffic flow. Other quantified values can be applied in the next step of working with the modelling and simulating driver behaviours.
2.2. Motorcycle-dominated Traffic Flow
2.2.1. Movement Characteristics of MotorcyclesSo far, researches in the field of transportation and traffic engineering in general and road traffic safety in particular are normally proceeded in the knowledge basement of car flow traffic. However, in Vietnam and most of developing countries in the area of South East Asia, motorcycles are the dominating transportation mode, causing Asian cities significantly different from other regions. In Hanoi and Hochiminh city, Vietnam, for example, two-wheelers accounted for more than 80% of the total transportation means. Motorcycle ownership and usage in Asia are influenced by several agents different from those of western countries. These include the weather, climate, the economic and infrastructure development, population density and social/cultural environment. While providing affordable mobility to millions of people, these vehicles significantly contribute to transportation and traffic system.
In Asian countries, the term ―motorcycle dependent city‖ has been used to indicate a city with low income, high density land use and motorcycles‘ domination in traffic flow. Chu (2001) gived out a list of distinctively advantageous characteristics that validate the popular usage of motorcycles in this region/Asia. Among them, he focuses on the size, flexibility and manoeuvrability of the motorcycle, economy in fuel consumption and price. Besides, there are such disadvantages in comparison with cars as being easily effected by bad weather, requiring balancing during the travel, inability to carry cumbersome or heavy goods or high number of passengers. The motorcycle is a rather suitable with developing countries because of their distinguished climate, national economics status, crowded traffic, etc. The author emphasized that ―motorcycles have agility and capability to weave through queues in congested area. Motorcycles are capable of zigzag manoeuvres and creep up slowly to the front of the queue while four-wheelers need to stop during red light at a signalised intersection‖. This movement characteristics of motorcycles may be used to explain the motorcyclist behaviours during the ―waiting phase‖ in the signalised intersections. The research also argued that the safety concern is one of the main reasons against the development of motorcycles. It does not provide sufficient protection like a four-wheeled vehicle. It has a high degree of exposure which makes the motorcyclist and passengers more vulnerable if a collision occurs. Motorcycles seem to be the most hazardous traffic mode. This characteristics is also mentioned in many other studies, when motorcyclists, bicyclists and pedestrians are considered as vulnerable road users.
So far, there have been very few researches conducted on traffic operation of motorcycles. In literature review, there are several researches on bicycle traffic which may be useful and applicable to motorcycles since they are all two-wheeled vehicles, especially in the aspect of driver behaviour. Dealing with driver behaviour at intersections, there are several researchers paying attention to bicycles´ speed distribution. Opiela et al (1980) determined intersection approach speeds for bicycle traffic, then found the normal distribution of speed is closed to the field collected data. Forester (1994), Navin (1994), Botma et al (2000) also computed speeds of bicycles on links. Ling et al (2004) identified the signalised intersection crossing speeds for bicycle traffic. The speed values were classified into through and left-turning manoeuvres, both of which are proved to have the normal distribution. However, the results must be reconsidered and recalculated before applying in motorcycle traffic flow as bicycles are not motorized.
Bary Watson et al. proves that riding a motorcycle is associated with a higher risk of injury or death than driving a car. The design of a motorcycle provides the rider with little protection in the event of a crash compared to that provided by a car, and undoubtedly, this fact contributes to this higher risk of injury.
Paolo Perco (2008) says that motorcyclists are a particularly vulnerable group of road users because they run a higher risk of being injured or killed in an accident compared with passenger car drivers. In fact, accidents involving motorcycles and mopeds can easily result in severe injuries or fatalities. In the research, the author conclude that PTW (Powered two wheelers) speeds are always considerably higher than passenger car speeds. Moreover, the corresponding operating speeds are correlated. Therefore a prediction equation to estimate the PTW operating speed in urban areas starting from passenger car operating speeds was developed:
V85PTW = 1,162 x V85PC
with R2 = 0,94
Whereas: V85PTW = 85th percentile speed on tangent of PTW (km/h)
V85PC = 85th percentile speed on tangent of passenger cars (km/h)
R2 = coefficient of determination
The author discussed that this equation can help highway designers to estimate expected PTW speed that can be effectively used in safety evaluations when the significant percentage of PTWs in the traffic flow suggests that this vehicle type should also be considered.
Narelle Haworth and Christine Milvihill (2006) argued that motorcyclists are subject to the hazards faced by car drivers but, because motorcycles have only two wheels, they are more susceptible to difficulties and hazards created by the design, construction, maintenance and surface condition of roads (ROSPA, 2001). For example, motorcyclists are at risk from situations such as gaps in bridge decking wide enough to catch a motorcycle wheel but too narrow to affect a car tyre. The reactions required from riders also need to be different, as motorcycles handle differently to cars. The extent of potential harm associated with any given hazard is commonly greater for motorcyclists, given their comparative lack of protection.
In this research, the authors point out that there are two major groups of hazards to motorcyclists which are road-based hazards and hazards associated with the behaviour of the other road users. In their opinions, while road based hazards can, in some cases, cause loss of control over the motorcycle, their roles are more often contributory when the motorcycle is performing a complex manoeuvre such as turning or braking. The hazards associated with the behaviour of other road users can be thought of as arising from failures of hazard perception by other road users. Thus, many factors that interfere with hazard perception by car drivers (e.g. distraction associated with mobile phone use) contribute to those car drivers being hazardous to motorcyclists.
Many researches in Australia also focus on motorcycle safety since in this country, percentage motorcycles participating in traffic flow and involving in accident is rather considerable (Bary Watson et al. (1997)).
However, in fact, it is rather inappropriate to apply such researches in motorcycle safety in developed countries in Vietnam situation. The reason is that in such countries automobile vehicles (four-wheeled)