Comparison of Owned, Earned
and Paid Website Visitors: A
Case Study
Master’s Thesis
Jesse Ketonen
28 April 2017
Information and Service
Economy
Approved in the Department of Information and Service Economy __ / __ / 20__ and awarded the grade
Aalto University, P.O. BOX 11000, 00076 AALTO www.aalto.fi Abstract of master’s thesis
i Author Jesse Ketonen
Title of thesis Comparison of Owned, Earned and Paid Website Visitors: A Case Study Degree Master of Science in Economics and Business Administration
Degree programme Information and Service Economy Thesis advisor(s) Matti Rossi, Noora Pinjamaa
Year of approval 2017 Number of pages 103 Language English Abstract
This thesis explores website traffic and visitors by analysing website customer behaviour. The thesis expands the current research on web analytics to consider the rising categorization of media into owned, earned and paid media types. The research is first of its kind to further explore if there is significant difference between owned, earned and paid website visitors measured by web metrics. In addition to academic contributions, it is desired that the research helps marketers and publishers to invest their resources between generating each type of traffic in order to reach their individual goals and maximize the return-on-investment.
In this paper, a framework for measuring owned, earned and paid website visitors is created. The research framework is tested in a case study where owned, earned and paid traffic is driven from Facebook to a fashion magazine’s online articles. Data on visitor-level website behavior of 2739 visitors is collected from the case website using Piwik analytics. The data was analyzed using two quantitative methods: chi-square test of homogeneity and one-way analysis of variance. These methods were used in order to determine whether statistically significant differences in website between owned, earned and paid visitor groups exists. Further, the case study demonstrates how to use the framework and appropriate techniques to effectively collect, extract, and analyze website visitor’s web behavior and the differences between owned, earned and paid website visitors.
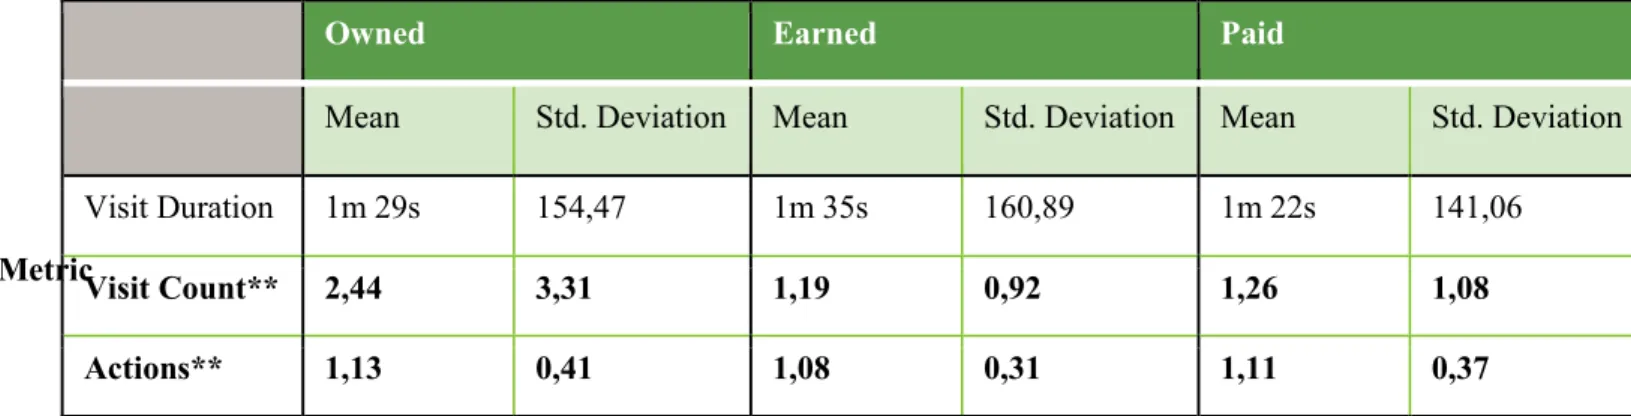
The empirical research reveals that significant differences between different types of website visitors exists. The chi-square test of homogeneity indicated a statistical significant difference of binomial proportions of ‘new / return user rate’, ‘bounce-rate’ and ‘mobile / desktop rate’ variables. One-way ANOVA indicated a statistical significant difference between the means of owned, earned and paid visitors of “visit count” and “actions”, but also a non-significant difference of “visit duration”. Thus also the usability of the research framework is confirmed.
This thesis expands the research on clickstream data into social networking and earned media in media and journalism, and so contributes to the existing research on web analytics. This thesis also contributes to the existing literature on owned, earned and paid media and web analytics by adding owned and earned social media exposure to clickstream research and comparing them to paid social media exposure it in assessing user’s behavioral response in a cross-site context. Thus the thesis also combines social marketing with web analytics and expands the use ‘owned’, ‘paid’ and ‘earned’ jointly in a digital environment. This study is also first one to apply ‘heart rate monitoring’ measurement, redefined visit duration and bounce-rate metrics. The thesis provides useful technical and methodological information about website visitor tracking and web metrics for both academics and businesses seeking benefits from web analytics and online channels.
Keywords Web analytics, clickstream, visitor statistics, owned media, earned media, paid media, social media
ii Tekijä Jesse Ketonen
Otsikko Omien, ansaittujen ja maksettujen verkkosivukävijöiden vertailu: tapaustutkimus Tutkinto Master of Science in Economics and Business Administration
Tutkinto-ohjelma Tieto- ja palvelutalous Ohjaajat Matti Rossi, Noora Pinjamaa
Hyväksymisvuosi 2o17 Sivut 103 Kieli Englanti
Abstrakti
Tutkielma tarkastelee verkkosivuliikennettä ja verkkosivuvierailijoita analysoimalla verkkokäyttäytymistä. Tutkielma laajentaa nykyistä web-analytiikan tutkimusta käsittelemään omaa, ansaittua ja maksettua mediaa. Tutkielma on ainutlaatuinen tieteenalallaan tarkastellessaan omien, ansaittujen ja maksettujen verkkosivuvierailijoiden välisiä eroja web-metriikoilla mitattuna. Akateemisen kontribuution lisäksi tutkimuksen toivotaan auttavan markkinoijia ja julkaisijoita allokoimaan resurssejaan kullekin yksilöllisten tavoitteiden näkökulmasta paremmin eri tyyppisten liikennevirtojen generoimiseen, saavuttaen näin parhaan mahdollisen tuoton investoinneilleen. Tutkielmassa esitellään uusi viitekehys omien, ansaittujen ja maksettujen verkkosivuvierailijoiden mittaamiseen. Tutkimuskehys testataan tapaustutkimuksessa, jossa omaa, ansaittua ja maksettua liikennettä ohjataan Facebookista valitun muotilehden verkkoartikkeleihin. Tapaustutkimuksen aineisto koostuu Piwik-analytiikkajärjestelmällä kerätyn 2789 verkkosivuvierailijan vierailija-tason verkkokäyttäytymiseen. Aineisto analysoidaan käyttäen kahta kvantitatiivista menetelmää: khii-neliön testiä ja yhdensuuntaista varianssianalyysia. Valituilla keinoilla selvitetään onko oman, ansaitun ja maksetun vierailijaluokkien välillä tilastollisesti merkitseviä eroja. Tapaustutkimus osoittaa, kuinka viitekehystä ja käyttötarkoitukseen soveltuvia tekniikoita käytetään omien, ansaittujen ja maksettujen verkkosivuvierailijoiden verkkokäyttäytymistietojen keräämiseen, analysointiin ja vertailuun. Tutkielman empiirinen tutkimus todistaa, että tilastollisesti merkitseviä eroja omien, ansaittujen ja maksettujen verkkosivuvierailijoiden välillä on olemassa. Khii-neliön testi osoittaa, että ero on olemassa ‘uudet / palaavat käyttäjät’, ‘poistumissuhde’’ ja ‘mobiili / työpöytä – käyttäjät’ muuttujien tapauksessa. Yksisuuntainen varianssianalyysi osoittaa, että omien, ansaittujen ja maksettujen verkkosivuvierailijoiden keskiarvojen välillä on tilastollisesti merkitsevä ero ‘vierailumäärän’ ja ‘toimintojen’ tapauksissa, mutta myös ei-merkitsevä ero ‘vierailun keston’ tapauksessa. Näin ollen myös tutkimuskehyksen käytettävyys on todennettu tapaustutkimuksen kautta.
Tutkielma avartaa nykyistä klikkaustietoihin liittyvää tutkimusta sosiaalisiin verkostoihin sekä ansaittuun mediaan. Tämä tutkielma kontribuoi myös olemassa olevaan omaa, ansaittua ja maksettua mediaa sekä web-analytiikkaa käsittelevään kirjallisuuteen 1) tuomalla oman ja ansaitun sosiaalisen median näkyvyyden osaksi klikkaustietoihin liittyvää tutkimusta ja 2) vertaamalla näitä maksettuun sosiaalisen median näkyvyyteen verkkokäyttäjän käyttäytymissä ilmenevien reaktioiden arvioinnissa toisistaan erillisten verkkosivujen tapauksessa. Näin ollen tutkielma yhdistää sosiaalisen markkinoinnin web-analytiikkaan ja laajentaa oman, maksetun ja ansaitun median rinnakkaista seurantaa digitaalisessa ympäristössä. Tutkimus soveltaa ‘sykemonitorointia’ mittauksessa sekä uudelleen määriteltyjä vierailun kesto sekä poistumisaste –mittareita. Tutkielma tarjoaa hyödyllistä teknistä ja metodologista tietoa verkkosivuvierailijoiden seurannasta sekä web-metriikoista digitaalisten kanavien hyödyntämistä harkitseville akateemisille tutkijoille sekä yrityksille.
Avainsanat: Web-analytiikka, klikkaustieto, verkkosivukävijätilastot, oma media, ansaittu media, maksettu media, sosiaalinen media
iii
Acknowledgements
I want to thank the thesis instructors Prof. Matti Rossi and Noora Pinjamaa for their extensive and lasting support thorough the research process. I also want to thank Prof. Merja Halme for her contribution and help with the selection and assessment of quantitative methods used in the study. I’m also obliged to the thesis opponents Aimo Järvinen and Ville Lehtonen from Aalto University. I want to give special recognition to Aller Media Oy and ELLE magazine that provided the opportunity and resources to profoundly explore the subject. I want especially thank to Aller’s Insight & Analytics Director Kristina Hännikäinen, ELLE Editor-in-Chief Taru Marjamaa, Aller’s former B2B Director Janne Pullinen and other people across the Aller IT-, digital- and Elle magazine departments who made the empirical research possible.
iv
Table of Contents
Acknowledgements ... iii 1 Introduction ... 7 1.1 Definitions ... 11 1.1.1 Web analytics ... 12 1.1.2 Web Metrics ... 12 1.1.3 Website Traffic ... 13 1.1.4 Website Visitors ... 131.1.5 Website Visits / Sessions ... 13
1.1.6 Bounce Visit... 13
1.1.7 Bounce Rate ... 14
1.1.8 Visit Duration... 14
1.1.9 Corrected Visit Duration ... 15
1.1.10 Adjusted Bounce Rate ... 16
1.1.11 New Visitor ... 16
1.1.12 Return Visitor... 16
1.1.13 Mobile vs. Desktop users ... 17
1.1.14 Visitor Actions ... 17
1.1.15 Conversions... 17
1.1.16 Visit Count ... 18
1.1.17 Owned, Earned and Paid Media ... 19
1.1.18 Owned, Earned and Paid Traffic and Website Visitors ... 19
1.2 Research problem ... 21
1.3 Research question ... 23
2 Literature Review ... 25
2.1 Web Analytics ... 25
2.2 Current research on Web Analytics ... 27
2.2.1 Theme 1:Peoples’ navigation in the new medium ... 28
2.2.2 Theme 2: Online advertising methods ... 30
2.2.3 Theme 3: Online shopping and online purchase prediction ... 31
2.2.4 Research on Web Traffic and Behavior ... 32
2.3 Popularity of Web Analytics amongst practitioners ... 34
2.4 Choosing the relevant metrics ... 35
2.5 Challenges with Web Analytics ... 37
v
2.7 Measuring Owned, Earned and Paid Traffic ... 42
3 Research Framework and Methodology ... 45
3.1 Web Analytics frameworks ... 45
3.1.1 Major components of an online marketing system ... 45
3.1.2 Trinity approach ... 46
3.1.3 Levels of analysis & five-dimensional model of web attention ... 46
3.2 Research Framework ... 48
3.3 Research Methodology ... 50
3.3.1 Website Visitor Grouping ... 51
3.3.2 One-Way ANOVA ... 51
3.3.3 Chi-square test of homogeneity ... 53
3.4 Research tools ... 54
3.5 Getting visitor-level data ... 55
4 Case study and data ... 57
4.1 Case Introduction ... 57
4.2 Case Data ... 60
4.2.1 Comments on metrics ... 61
5 Data analysis and findings ... 63
5.1 Chi-Square test of Homogeneity ... 63
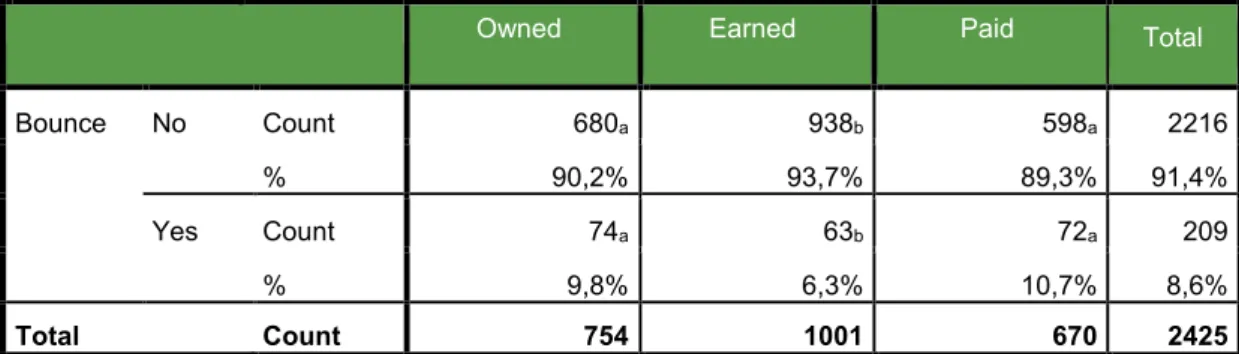
5.1.1 Bounce vs. Non-bounce visitors ... 64
5.1.2 Mobile vs. Desktop visitors ... 64
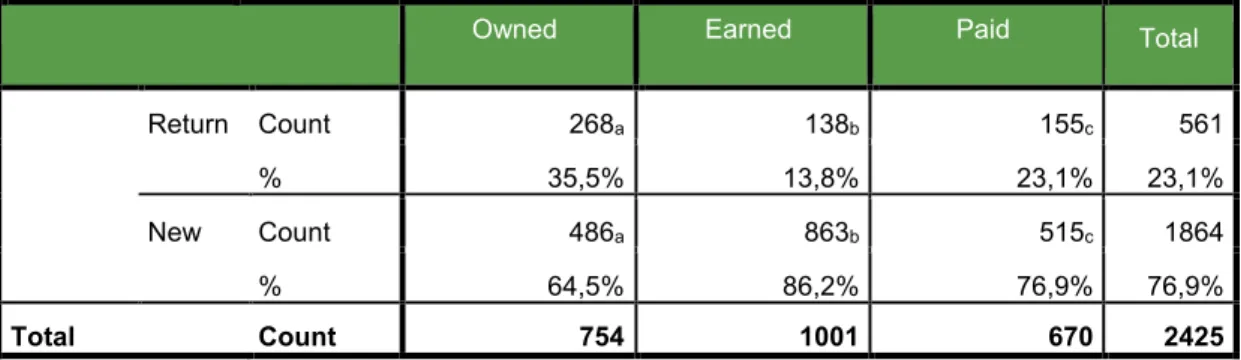
5.1.3 New vs. Returning visitors ... 65
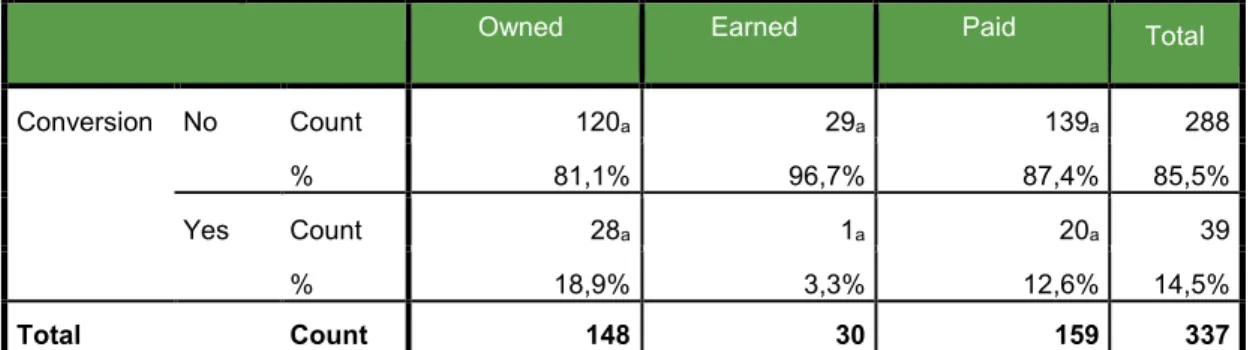
5.1.4 Conversions... 66
5.1.5 Summary of findings ... 66
5.2 One-Way ANOVA ... 67
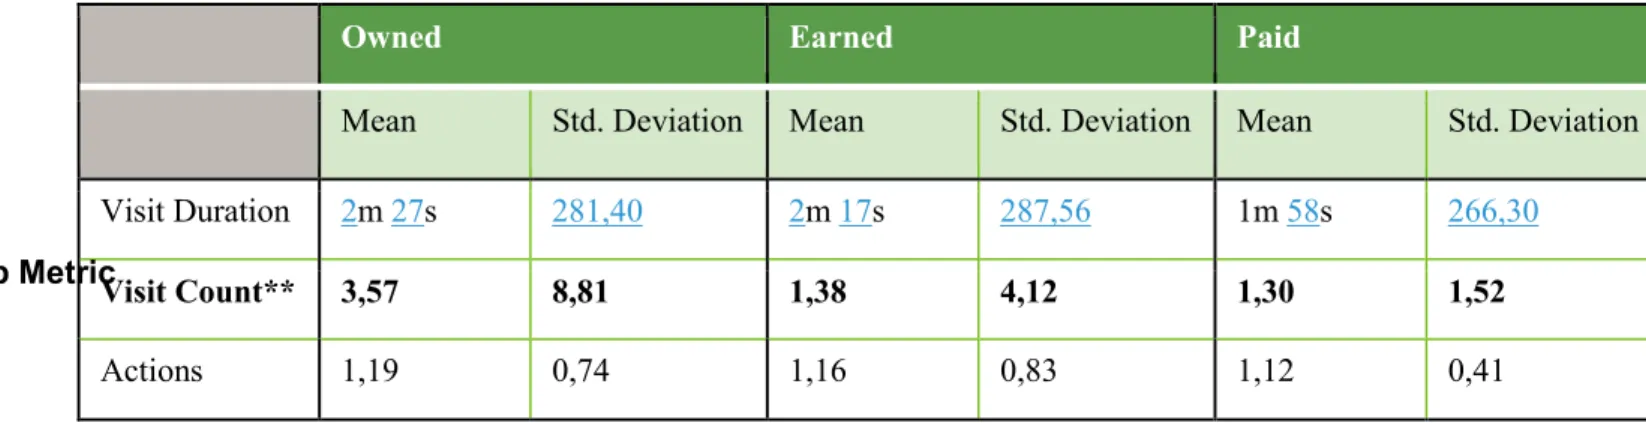
5.2.1 Results of One-way ANOVA ... 68
5.2.2 Summary of findings ... 71 5.3 Discussion ... 73 6 Conclusions ... 78 6.1 Thesis Summary ... 79 6.2 Managerial implications ... 80 6.3 Theoretical contributions ... 82 6.4 Limitations ... 83
6.5 Suggestions for future research ... 84
vi
Appendices ... 94
List of figures
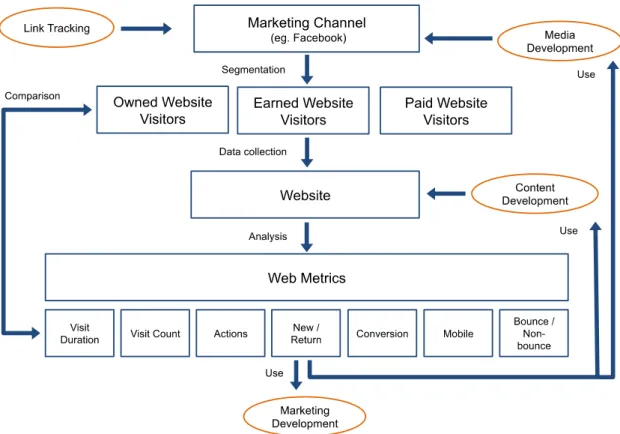
Figure 1:Levels of analysis and corresponding metrics (Zheng et al., 2012) ... 47Figure 2: Analysis of website behavior of owned, earned and paid website visitors ... 49
List of tables
Table 1: OEP visitor conversion logic ... 19Table 2: The chosen metrics and what they indicate ... 21
Table 3: Owned, Earned and Paid Media definitions ... 42
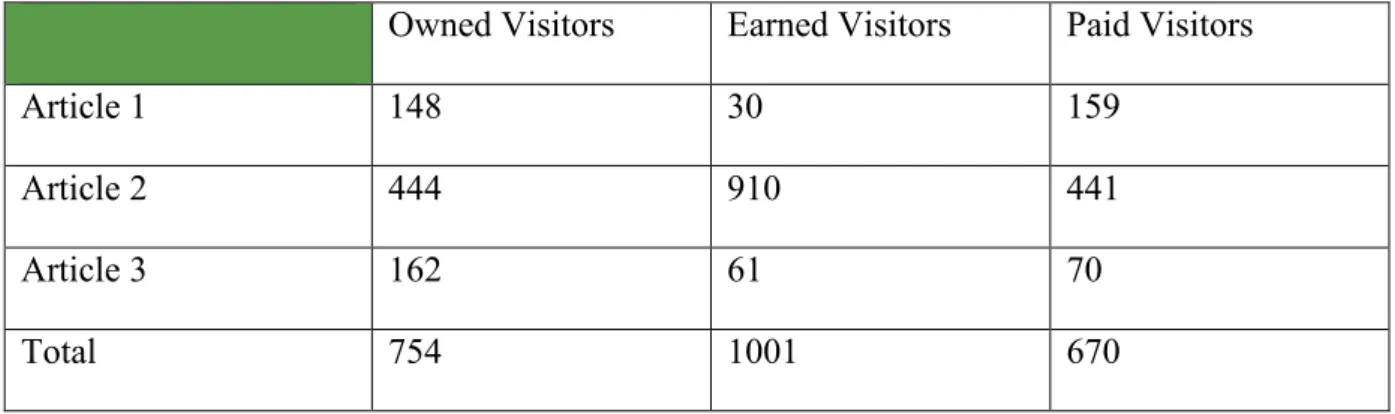
Table 4: Breakdown of case study data set ... 61
Table 5: Bounce / Non-bounce contingency table ... 64
Table 6: Mobile / Desktop contingency table ... 64
Table 7: New / Return contingency table ... 65
Table 8: Conversion contingency table... 66
Table 9: Chi-square tests of homogeneity summary... 66
Table 10: One-way ANOVAs summary (no outliers removed) ... 68
Table 11: One-way ANOVA output (no outliers removed) ... 69
Table 12: One-way ANOVAs summary (1% outliers removed) ... 69
Introduction
7
1 Introduction
For the past several years, the media and entertainment industry has been in turmoil. Consumers are at an accelerated rate replacing their traditional media consumption with digital experiences (Berman, Battino, & Feldman, 2011). Online readership is hoped to save the struggling publishers from declining revenues (Vu, 2014). Digital experiences in digital channels grow their share of people’s time. Companies aim to capitalize this by maximizing the attention towards themselves. Therefore, the role of digital marketing in a firm’s marketing strategy is becoming central. This can be seen from increasing investments in digital marketing activities. An additional reason for the shift of budgets to digital marketing are the cost-effectiveness and easier measureability of its results (Järvinen & Karjaluoto, 2015).
Due to increased connectivity, growing interaction between customers and companies in digital channels, and development of technologies, companies need to serve and attract clients through digital channels irrespective of industry. According to Berman, Battino & Feldman (2011), especially established media and entertainment companies face challenges to monetize their digital channels successfully while they possess great opportunities that only a few relatively new industry entrants have successfully grasped. According to Berman, Battino, & Feldman (2011), media and entertainment companies must embrace new
distribution platforms and strategically optimize between them capitalize on the
opportunities. In order to successfully do this, the companies need to utilize analytics, have a consumer-centric approach, and embrace multi platform delivery (Berman et al., 2011). Unlike traditional media, Internet-driven digital media allows easy, fast and unobtrusive collection of information on individual activities on a detailed level (R. E. Bucklin &
Sismeiro, 2009). This information can be harnessed for making better business decisions. For example, the retail giant Target has used its collected data to identify buying patterns, lift customer satisfaction, select promotions, predict trends, create strategies, and increase revenue (Corrigan, Craciun, & Powell, 2014).
For these reasons, companies need to utilize Web analytics (WA), defined as “the measurement, collection, analysis and reporting of Internet data for the purposes of understanding and optimizing Web usage” (Web Analytics Association, 2008, p. 3). Web
Introduction
8
analytics have become a popular subject ever since the rise of the Internet and company websites, as it helps companies to define the purpose and objectives of their web presence (Riihimäki, 2014). Nakatani and Chuang (2011) emphasize that these objectives are not limited to optimizing web sites but the ultimate objective is to drive the success of an organization’s overall targets.
The digitalization of media has emphasized the importance of owned channels such as a company’s website and mobile apps. Today, websites serve multiple purposes, which makes it also hard to evaluate their performance (Welling & White, 2006). Earlier research has investigated the value of websites from different perspectives. Welling & White (2006) propose that online sales is a key goal alongside customer support for a retail company. They continue saying brand awareness and education to be the purpose across different industries, whereas business-to-business companies commonly use it for recruiting. Benefits are gained by offering services and information to various stakeholders (Welling & White, 2006). Many firms use websites as the most important contact point between them and their potential or current clients (Riihimäki, 2014). However, the existence of online services and websites does not make sense without continuous and relevant high-quality traffic from external sources. Web traffic is a valid measure for performance for companies (Luo & Zhang 2013; Vaughan 2008; Vaughan & Yang 2013). Especially for online businesses, whose revenue relies purely on this traffic –with no traffic, there would be no revenue streams (Ghandour, Benwell, & Deans, 2010).
One way to study web traffic’s relevance and quality is to look at a visitor’s website behavior. Website behavior’s importance has been widely acknowledged in previous studies across different academic disciplines. In the literature review, past research on website behavior from marketing, communications, and information and service economy perspectives is covered.
Based on the previous studies, it seems necessary to study web traffic more, and understand the different aspects of it. Given that we know that web traffic generally creates value, the existing research does not fully consider different traffic types that could have different effects on chosen performance metrics. Web traffic may be generated by various parties, channels, contents or mechanisms (Vaughan & Yang, 2013). Many of these have not yet been studied in detail. This research aims to narrow the gap of measuring and
Introduction
9
understanding different types of traffic on a visitor level. Taking into consideration the current state of the Internet, there are many different types of traffic, which can lead to very different results from a business perspective. Ghandour et al. (2010) state that online businesses can end up making no sales even with a high amount of traffic. This is because traffic may originate from different sources and there can be many different reasons why it has been generated. For example, a person might have seen a video on a social media platform, which has triggered him to click a link that leads to a company’s website. The trigger behind the click might have been the content’s headline or the video shown beside it or because it was shared by one of his best friends. The video might have come to him as a targeted ad, offering something new and interesting that took him to the website to explore more of its contents. Or maybe the ad was only generating a click but could not engage the visitor to further explore the website. This study proposes that website visitors who came through different kinds of media channels are different and behave differently on a website. Knowing these differences would bring marketing and media professionals an advantage in driving the most relevant and valuable traffic for their business goals instead using resources to generate traffic that does not provide return on investment. Companies and organizations should focus on bringing more relevant traffic to their own channels in order to maximize the positive business impact; in the context of our study – maximize the attention and reach the desired website behavior of their website visitors. In a case study by Järvinen & Karjaluoto (2015) one company saw the ability to measure website visits and traffic generated by different marketing actions as the greatest benefit of web analytics. Therefore it is necessary to more profoundly understand the existence of different types of traffic on the Internet. As the traffic is generated by different marketing communication activities, this raises the need to study how firms can measure the effects of different types of marketing communication and how they compare with each other (Trusov, Bucklin, & Pauwels, 2009).
The concepts of owned, earned and paid media
In today’s business marketers, publishers and media professionals classify media into three types: owned, earned, and paid media. According to Stephen and Galak (2012), a typical situation is that a company has a combination of owned, earned and paid (OEP) media
Introduction
10
activity. This is true because most companies tend to advertise, have their own websites and engage in social media activities, which already covers all these types of media.
Businesses may intentionally increase the amount of any of these types of media reach for their company or brand using different strategies and tactics. For example, a company may focus on social networking through earned media. In this case, the company may target social influencers and aim to become a topic for networked social groups (Berman et al., 2011). Also, a company may aim to build large online communities to increase the baseline of their owned media exposure. The company may further utilize these strategies to drive traffic to their own channels and conduct campaigns utilizing their owned communities and social network to maximize the results. DiStaso & Brown (2015) found that many of the Fortune’s “World’s Most Admired Companies” and “Best Companies to Work For” listed companies utilize earned and owned media in their communications and that there is an increasing trend in the return on efforts regarding this activity. This study aims to further investigate the difference in the benefits that traffic generated by each type of media brings to marketers and publishers. With this kind of information, businesses can better plan their investments between different types of media according to their individual goals. Owned, earned and paid media is however rarely referred to in WA research. Article of Chaffey & Patron (2012) on WA driven digital marketing performance development is an exception, combining WA with the concept of owned, earned and paid. This thesis expands the analysis of clickstream data in social networking and owned, earned and paid media in media and journalism, and so contributes to the existing research on web analytics.
Today, businesses are seeing increasing amount of traffic coming from social media. The digital media analytics company Parse.ly has reported that social media is the lead traffic referrer for online publishers (Ingram, 2015; VanNest 2016). Especially Facebook has taken its place as a major traffic source (Ingram, 2015; VanNest 2016). In 2016 only, Facebook drove 42% of all traffic to Parse.ly’s network of online publishers according to VanNest (2016). In addition to having a major role for publishers, owned, earned and paid media coexist in Facebook, which makes it excellent source material for study. This thesis introduces a way to divide owned, earned and paid traffic in a social media context and further explores the meaningful differences between visitors generated by each traffic type towards common web metrics. The case study focuses on a fashion media brand driving visitors from Facebook to its web articles during a measurement period.
Introduction
11
The remainder of the article is organized as follows: First, the most important terms and concepts in web analytics, as well as owned, earned and paid media, traffic and visitors are defined. Next, the research problem and research question are introduced. After the introduction, the existing literature on web analytics and owned, earned and paid media is reviewed. Concluding the methodology section, the research framework and methodology are introduced. Next, our case study approach and data collection and analysis methods are explained in detail. This is followed by the actual data analysis and findings. In the final section, the findings are summarized, managerial implications and theoretical contributions are presented. Finally, the limitations of the study and future research opportunities are discussed.
1.1 Definitions
To have a clear picture of the research problem, various metrics should be understood. In August 2007, the Digital Analytics Association (DAA, former Web Analytics Association) has defined the most important web analytics metrics (Burby & Brown, 2007). DAA has also introduced a Definition Framework, which puts Web analytics metrics into three types: counts, ratios and KPIs. Count is the most basic unit of measurement and it is a single number (Burby & Brown, 2007). An example of count is ‘time spent on page’. According to Burby and Brown (2007), ratio is usually a count divided by a count, but it may as well use either a count or a ratio in the numeral denominator. An example of a ratio is ‘bounce rate’. Burby and Brown (2007) state that KPI (Key Performance Indicator) is used to distinguish the most important metrics to follow related to the business strategy. They amplify that KPI typically differs between site and process types. A KPI can be either a count or ratio (Burby & Brown, 2007).
DAA also adds a fourth type of definition for “terms that describe concepts instead of numbers.” That is dimension, defined as “a general source of data that can be used to define various types of segments or counts and represents a fundamental dimension of visitor behavior or site dynamics.” Traffic referral sources and website events are some examples. “They can be interpreted the same as counts above, but typically they must be further
Introduction
12
qualified or segmented to be of actual interest. Therefore these define a more general class of metrics and represent a dimension of data that can be associated with each individual visitor” (Burby & Brown, 2007). According to Burby and Brown (2007), “metrics are measured across the dimensions.”
Next, we go through some definitions of common terms and concepts that are relevant for the topic and used in this thesis. We also discuss the means of each metric used in the case study.
1.1.1 Web analytics
Web analytics (WA) refers to a “tool that collects clickstream data regarding the source of website traffic (e.g. e-mail, search engines, display ads, social links), navigation paths, and the behavior of visitors during their website visits and that presents the data in a meaningful format” (Järvinen & Karjaluoto, 2015). Web analytics data are used to understand customer behavior online and to measure customer responses to digital marketing in online environment and to optimize elements and actions of digital marketing that have been identified to drive customer behavior that is beneficial for the business (Nakatani & Chuang, 2011).
1.1.2 Web Metrics
Web analytics enable website owners to monitor how website visitors behave online by providing web metrics (Tandoc, 2015). According to (Krall, 2009), web metrics is “any quantitative measure of passive viewing or consumption of content by internet users” According to (Burby & Brown, 2007), “a metric can apply to three different universes.” They are, aggregate, segmented and individual. According to Burby and Brown (2007), “Aggregate is the total site traffic for a defined period of time”. Segmented on is a “subset of the site traffic for a defined period of time, filtered in some way to gain greater analytical insight”. Examples of filters are campaigns, referrers or visitor types such as new vs. returning visitors. Owned, earned and paid traffic are subsets of site traffic filtered by visitor type. The third universe is individual, defined as the “activity of a single web visitor for a defined period of time” (Burby & Brown, 2007).
Introduction
13
1.1.3 Website Traffic
According to Marketingterms.com (2017), website traffic is “the amount of visitors and visits a Web site receives.” In this thesis, we use web traffic as a synonym for website traffic.
1.1.4 Website Visitors
Website visitors represent “the number of unique users (identified by cookies) accessing a specific website” (Yang, Pan, & Song, 2013). Cookies are tiny text files saved in user’s computer and they are sent to a web browser by a web server in order to identify the user. During the reporting period, each individual visitor is usually counted only once (Burby & Brown, 2007). However, a visitor does not always equal a unique person. A person may use different browsers or devices to access a website but cookies do not follow website visitors across them. An individual session initiated by a website visitor is called a “visit” (Yang et al., 2013). In this thesis we commonly refer to website visitors simply as “visitors”. In practice, web traffic generates website visitors and their amount is equal on a single website.
1.1.5 Website Visits / Sessions
Website visits are “the number of individual sessions initiated by all visitors on a website” (Yang et al., 2013). One access by a unique IP address equals one visit. It is worth noting that most web analytics tools require a 30-min time interval between each access before it can be counted as an additional visit (Booth & Jansen, 2008). Website visits are also known as “sessions”.
1.1.6 Bounce Visit
A bounce visit, also known as Single Page View Visit, is a visit that is formed on one page-view (Burby & Brown, 2007). A bounce visit is usually interpreted as a non-engaged visit, which might not be always true. If all the relevant content is placed on a single page, a bounced visitor may have actually spent a lot of time and consuming the content.
Introduction
14
1.1.7 Bounce Rate
According to Plaza, Beatriz (2009), “Bounce rate is the percentage of visitors who enter a site (or a page) and then leave immediately without visiting any other pages.” A similar definition is used by (Ghandour et al., 2010). According toBurby and Brown (2007), bounce rate is “single page view visits divided by entry pages”. According to Plaza, Beatriz (2009), bounce rate could also be defined through visit duration regardless the number of page views. For example, visitors who spend 10 seconds or less on the site can be viewed as bounced visitors and therefore the percentage of visitors who spend under 10 seconds on site compared to total visitors counts as bounce-rate (Plaza, Beatriz, 2009).
According to Pakkala et al., (2012) bounce-rates indicate website relevancy to a visitor. Low bounce rate tells that a website is relevant to the visitor. Plaza, Beatriz (2009) state that high bounce rate visits are problematic and they are especially common amongst referring site visits.
1.1.8 Visit Duration
“Visit Duration is the length of time in a visit” (Burby & Brown, 2007). Burby and Brown (2007) clarify the measurement further: “calculation is typically the timestamp of the last activity in the session minus the timestamp of the first activity of the session”. Visit duration is often mixed with “time spent on a page”. The purpose of use is similar for both metrics, but there are technical differences that web analytics users should be aware of. As a default, most web analytics tools’ calculation of visit duration record bounce visitsas 0-second visits, where as time spent on a page excludes bounce visits. Therefore, due to bounce visits, many pages report lower visit duration than time spent on a page on average. This also means that as a default, visit duration is a skewed metric and does not report the true time of a visitor’s visit. Further in this thesis, we explore this problem and try to find solutions to it.
Visit duration is arguably one of the most used metric in Web Analytics, and its significance has been studied in prior literature. Panagiotelis et al., (2013) found a relation to sales, whereas quite a few studies have discovered a connection to purchase incidence (Moe & Fader, 2004; Montgomery, Li, Srinivasan, & Liechty, 2004; Panagiotelis et al., 2013). Danaher & Smith (2011) suggest that visit duration is linked to sales volume. For certain types of products, this might be especially true. Visit duration have been found to bring value
Introduction
15
through maximizing expected sales for books, travel service and digital media (Panagiotelis et al., 2013). Visit duration has been used as proxy indicator of web “stickiness”. This is due to its noted positive effect in visitor-to-buyer conversion rates and online loyalty (Xun, 2015). Long visit duration is not always necessarily an indicator of success: long visits may be caused by bad and difficult website design and unease use of a website leading to
decreased sales (R. E. Bucklin & Sismeiro, 2009).Long visit durations without positive outcome are also a non-productive use of the web servers capacity (Wilson, 2010).
Pakkala et al. (2012) distinguishe two different groups of visitors: “experimenters” and “real visitors”. They define experimenters as visitors “who try the website and visit for less than 10 seconds and “real visitors” as visitors “who typically spend 1–10 minutes on the website”. An online media research company Compete has used visit duration to rank web sites based on the total time spent on a website compared to the total time Americans spend online (Zheng, Chyi, & Kaufhold, 2012). A similar metric, time spent on a page, may be used in assessing the time visitors spend consuming web site content and using its services. Pakkala et al., (2012) used the average time spent on a page to assess website importance as a source for different visitor groups. In our study, we focus on time spent on the whole website. For businesses, it is essential to understand what affects visit duration. Danaher, Mullarkey and Essegaier (2006) concluded that variation in visit duration is driven mostly by the situation and less by qualities of the individual or website text, graphics advertising content and functionality. However, according to R. E. Bucklin & Sismeiro (2009), prior research suggests that “behavior follows regular patterns and that design issues might play an important role”. Therefore, we do not have clear viewpoint on whether visit duration will be significantly varied across visitor types.
1.1.9 Corrected Visit Duration
Corrected Visit Duration reports the real visit duration, where total time spent on a page is calculated using a different method that also counts the visit duration from single page view visits. We explore corrected visitor duration more precisely later in the thesis.
Introduction
16
1.1.10 Adjusted Bounce Rate
This study proposes corrected visit duration as the determining factor of bounce rate. Therefore, adjusted bounce rate is defined as percentage of visitors who spend under 10 seconds on site, calculated from corrected visit duration.
Our definition of bounced visitors is that the visitors that truly spend under 10 seconds on a website will count “experimenters” as bounced visitors. Similarly as with bounce-rate, adjusted bounce-rate is proposed to indicate website relevancy to a visitor.
1.1.11 New Visitor
A unique visitor that records its “first-ever visit to a site during a reporting period” (Burby & Brown, 2007).
1.1.12 Return Visitor
A unique visitor that records a visit and has recorded a former visit to a site during a reporting period(Burby & Brown, 2007).
The rate of return visits has been identified a key web metrics that is connected with website effectiveness (Riihimäki, 2014). Both new visits and return visits should be followed because they correlate strongly with the total number of conversions (Riihimäki, 2014). Based on a regression analysis, Riihimäki (2014) find a that the “amount of new visits can be used as a predicator towards the conversion rate”. An insight from their regression and correlation analysis is there is a negative relationship between the rate of return and the conversion rate, meaning that new visitors are more likely to convert making them a more valuable than return visitors. Contradictory, Plaza, Beatriz (2009) claims that return visits foster longer visit duration, making it indirectly have a positive effect on conversion (Xun, 2015). Riihimäki (2014) found similarly the return visitors to spend a longer time on the site and have higher number of page views, but state that this does not turn into a higher conversion rate.
Introduction
17
1.1.13 Mobile vs. Desktop users
The device used naturally affects how the website is experienced by the user. This study takes into account the differences in mobile vs. desktop traffic between the categories and investigates if device differences explain variations in other metrics.
1.1.14 Visitor Actions
According to Piwik (2017), Visitor Actions consist of page views, internal site searches, file downloads and clicks on external websites.
Montgomery et al., (2004) found that purchase conversion can be predicted from visitor page views on a site using a modeling approach. The more pages a visitor viewed, the more likely it led to a purchase.
1.1.15 Conversions
Conversion is a target action completed by the visitor (Burby & Brown, 2007). It can be very different depending on the objectives of the website and the business.
Conversions are commonly tracked in e-commerce and other transactional websites, where the end goal is to get the visitor to make a purchase (Croll & Power, 2009). In this case, the purchase is one kind of a conversion. In the way to purchase, visitor usually completes a set of different activities, which may also be seen as conversions, sometimes defined as “micro-conversions”. This path is from the beginning of visitor landing to a website to making a purchase is referred as conversion funnel (Croll & Power 2009). There are websites that serve different purposes so many different conversions are being used. For example, it is more difficult to determine a conversion on an information-oriented website. Downloads of a white paper or sign-ups on a newsletter are often monitored as conversions amongst them (Kaushik, 2010). In order to evaluate overall objectives, they should be broken into a more specific goals that visitors are wanted to complete on a website. A website can have multiple conversion goals. When at least one conversion goal is completed by a visitor, it is seen as converted visitor (Riihimäki, 2014). Conversions are often reported as rates of converted visitors. This conversion rate is the number of converted visitors compared to total unique visitors. According to Riihimäki (2014), “the total number of conversions can be used
Introduction
18
as an indicator for the overall performance of a site while the conversion rate tells about the quality of a single visit”.
Two categories of conversion goals are introduced by Tonkin et al. (2010): “transaction goals” and “engagement goals”. Transactional goals have direct monetary value whereas engagement goals “relate to a threshold or interaction without direct monetary value”. An example of direct monetary value is purchase of a product or becoming a lead by registering an account. Indirect value can be spending a desired amount of time on web page consuming certain content. In our case a transactional conversion goal is set: sign-up in a competition through a form on the website.
1.1.16 Visit Count
Visit Count is the amount visits of a website visitor added together over time. Visit count is often referred as number of visits (Burby & Brown, 2007).
Visit count is commonly understood and referred to as visitor loyalty. According to Pakkala et al., (2012), visitor loyalty was used to determine whether visitors found website content and layout satisfactory enough so they would be willing to return to the website. Internet users have been found to have considerable website loyalty and high switching costs (R. E. Bucklin & Sismeiro, 2009). Moe and Fader (2004) found that changes in individual-level visit frequencies can indicate which visitors are more likely to buy online. On a retail site, they found that frequent visits translated into a higher likelihood of buying. The number of visits per visitor is widely accepted as being one of the key metrics to measure site performance whether the purpose of the site is to sell products or attract and retain regular readers (Moe & Fader, 2004). However, Sismeiro and Bucklin (2004) found that the number of site visits do not predict purchases. This may be because hedonic browsing and knowledge building may be a very different for different kind of product categories, such as cars and books. For example in the case of cars, many users might visit the site multiple times without making a purchase. We analyze visitor loyalty from the perspective of a publishing and content website that aims to maximize reader retention and the number of individual visits.
Introduction
19
1.1.17 Owned, Earned and Paid Media
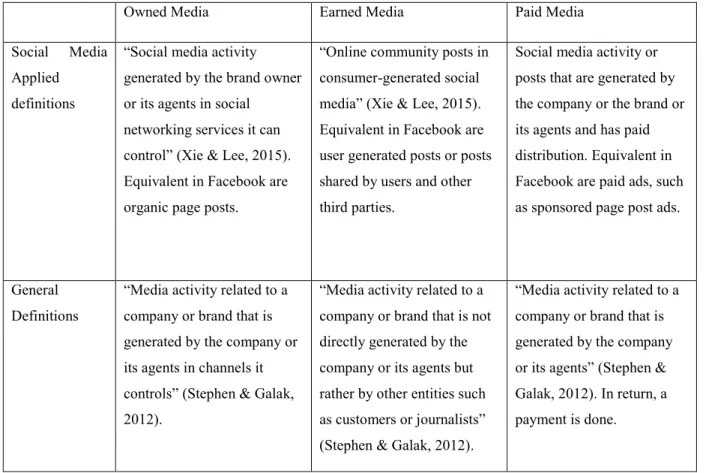
Xie and Lee (2015) suggest that owned media refers to “media activity generated by a company or its agents” in channels that they have control over. They suggest that earned media refers to “media activity that is not generated directly by the company”, but instead by other stakeholders such as consumers or journalists. According to Xie and Lee (2015) an alternative, widely used term for earned media is Word-Of-Mouth (WOM). More precisely, earned media in online channels have been named electronic Word-Of-Mouth (eWOM). A company’s marketing can support in generating earned media, but they do not generate the earned media activity directly (Xie & Lee, 2015). Paid media is often used as a synonym for advertising. According to Xie and Lee (2015), it refers to “media activity that a company or its agents generates” and pays for the distribution of the content. Today, these three types of media are widely recognized in the media industry.
1.1.18 Owned, Earned and Paid Traffic and Website Visitors
Web traffic can be divided to owned, earned and paid according to their source and redirect link distribution method. In this thesis it is proposed that owned, earned and paid traffic are defined after the media type that generates the traffic. For example, if the user comes via a link attached to owned media, we can say it belongs to owned traffic. If the user comes via a link that is not distributed by the brand or its agents, it is earned traffic and if the user comes through an advertised link, it would belong to paid traffic. Further, I propose that owned, earned and paid (web) traffic converts to owned, earned and paid (website) visitors when landing on a website by recording a visit on the website
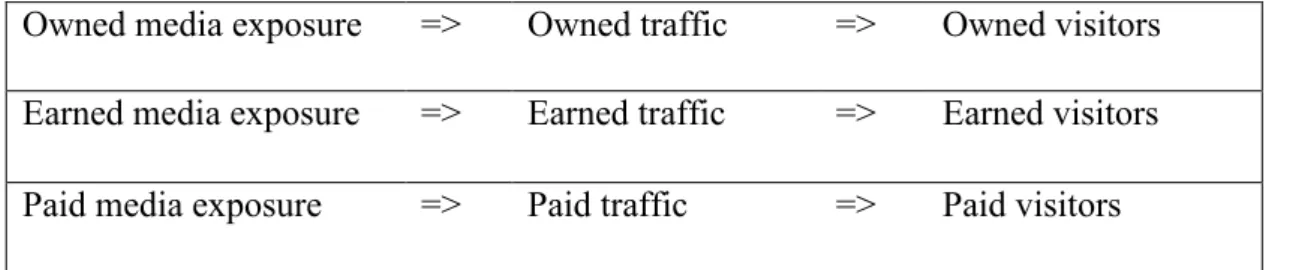
The following table illustrates our conversion logic:
Owned media exposure => Owned traffic => Owned visitors
Earned media exposure => Earned traffic => Earned visitors
Paid media exposure => Paid traffic => Paid visitors
Introduction
20
To conclude definitions section, we present the following table to sum what implications can be made from each of the metric used in the case study:
Metric Indication
Visit Duration Related to sales (Panagiotelis et al., 2013).
Connected to purchase incidence (Moe & Fader, 2004; Montgomery et al., 2004; Panagiotelis et al., 2013).
Linked to sales volume (P. J. Danaher & Smith, 2011).
Positive effect on visitor-to-buyer conversion rates and online loyalty (Xun, 2015). Not always an indicator of success: may lead to decreased sales (Wilson, 2010).
Visitor Actions Page views can predict purchases. The more pages a visitor viewed, the more likely it leads to a purchase (Montgomery et al., 2004).
Bounce Rate Indicates website relevancy to a visitor. (Pakkala et al., 2012) Adjusted
Bounce Rate
Indicates website relevancy to a visitor. (Pakkala et al., 2012) but fits better to websites with a lot of single page content and visits.
Conversion Conversion is a sign of quality of a single visit (Riihimäki, 2015). New / Return
visitors
Return visits foster visit duration (Plaza, Beatriz, 2009).
Connected with website effectiveness (Riihimäki, 2014).
“Both new visits and return visits have strong correlation with the total number of conversions” (Riihimäki, 2014).
“Amount of new visits can be used as a predicator towards the conversion rate” (Riihimäki. 2014).
“Rate of return visits has a negative relationship with the conversion rate”, meaning that new visitors are more likely to convert making them more valuable than return visitors (Riihimäki, 2014).
Return visitors visit duration is higher and they have higher number of page views, but this may not translate into a higher conversion rates (Riihimäki, 2014).
Mobile / Desktop users
Mobile users are hard to monetize for publishers (eMarketer, 2016).
Mobile users show better user engagement in video advertising (Heine, C., 2014). Mobile users have undivided attention (Heine, C., 2014)
Mobile offers better qualifications for location based personalization (Heine, C., 2014)
Introduction
21
Visual impact is greater for desktop users (Heine, C., 2014)
Visit Count More frequent retail site visitors have a greater propensity to buy. (Moe & Fader, 2004)
Visit frequency’s evolution on individual level can explain which customers are more likely to buy online (Moe & Fader, 2004).
Visitor loyalty was used to determine whether visitors found website content and layout satisfactory enough so they would be willing to return to the website (Pakkala et al., 2012).
Change in individual-level visit frequency can indicate which visitors are more likely to buy online (Moe and Fader, 2004). On a retail site, they found visitors that visit that visit more often are more likely to buy.
Widely accepted to be one of the key metrics to measure site performance whether the purpose of the site is to sell products or attract and retain regular readers. (Moe & Fader, 2004).
Not predictive of purchase (Sismeiro and Bucklin, 2004)
Table 2: The chosen metrics and what they indicate
1.2 Research problem
Companies from various industries are seeing website traffic as increasingly important. Firms can design and execute online and offline marketing campaigns that aim to increase traffic to their digital channels (Järvinen & Karjaluoto, 2015). The campaign effectiveness is usually measured by its impact on website customer behavior (Järvinen & Karjaluoto, 2015). Website traffic is important especially for media companies, whose online businesses are tied to the amount and quality of their website traffic. This traffic is further monetized by selling advertisement solutions to advertisers or by converting the visitors into paying customers. Järvinen & Karjaluoto (2015) find that firms' ability utilize WA to improve marketing performance remains limited. They claim that the majority of marketers think that measuring digital marketing performance is important. However, they say that less than one third of marketers think they are doing it well.
As web traffic plays a key role in value generation for businesses in the digital era, firms should know about what kind of traffic to invest in and how they differ. The businesses
Introduction
22
should also understand better what makes the traffic relevant and of high quality. Plaza, Beatriz (2009) ask whether a strategic plan to increase website traffic should focus on a certain source of traffic. In order to answer this question and explain it, it is necessary to understand how to measure traffic source effectiveness. Analysis of different types of traffic, such as owned, earned and paid traffic can be similarly compared to the analysis of different sources of traffic. Research focusing on individual types of media and traffic has previously been done but the differences between owned, earned and paid traffic concurrently have been studied very little so far.
This study aims to find out if, and for what reasons firms should invest in generating owned and earned traffic in addition to paid traffic by investigating the website behavior of the visitors of an online fashion media site by analyzing its web metrics. Web metrics have been found to correlate with financial performance of an online business across different industries (Ghandour, Benwell & Deans 2010). Also, a categorization to owned, earned and paid media is being recognized. For these reasons, we want further to learn if there is significant difference between owned, earned and paid website traffic and visitors measured by web metrics. Online marketers need to decide how they invest their resources between generating each type of traffic in order to reach their goals and maximize the return-on-investment. eMarketer (2010) suggests that “some of today’s greatest success stories in branding blend ingredients from the three kinds of marketing media: paid, owned and earned” but does not go further into the subject.
As mentioned earlier, traffic classification to owned, earned and paid has been studied very little. Terms ‘owned’, ‘paid’ and ‘earned’ are were used jointly in a digital environment by Srinivasan, Rutz, & Pauwels (2016). They explored how consumer activity metrics of owned, paid and earned influence differ in terms of brand performance and sales with fast moving consumer goods. They found that the difference is significant, and the effect on sales is positive. Their empirical study took place in a cross-channel context, whereas as the focus in this thesis is to study owned, paid and earned media that originates from social media. Instead of sales, this thesis focus solely on web metrics and website visitors. By exploring the subject from a new viewpoint, this study aims to complement the current research. It is a relevant subject as companies may affect the amount of owned, earned and paid traffic they are getting by investing in building online communities and directing people to their websites from them for example, or by creating shareable content that attracts people to spread links
Introduction
23
that direct to their website. Knowing the differences between different traffic types should direct a company’s decision making. For example, if companies see the best returns from using paid traffic, it would be relevant for them to focus on establishing paid traffic generation strategies and invest in paid traffic over other types of traffic. This study will contribute to research on website behavior and metrics by exploring owned, paid and earned media in the context of the media industry.
Finally, it is also important to understand how the different types of traffic may be
interconnected and how to actually define them before taking action to shape a company’s marketing efforts. Companies have to make decisions on how to split their limited resources. There is a vast amount of options, so businesses need to have a good understanding of which drivers are the most critical for realizing their business goals. In online environments, investing in the right kind of media exposure and traffic is decisive. Therefore, this thesis investigates if investing based on the traffic type categorized as owned, earned and paid makes sense. This kind of categorization is already common practice amongst marketing and communications professionals, but the true value of it remains unclear. An example of the how companies invest in different types of media is given by the marketing communications manager of Lincoln Electric, Craig Coffey in based on their previous marketing campaign budget split in a CMO.com interview: “from a spend standpoint, it was 80% paid, 10% earned, and 10% owned, but from a conversion standpoint, it was almost the inverse: 81% earned, 12% owned, and 8% paid” (Schwarz, M., 2016). According to Statista (2017), marketing budgets in UK in 2015 were split 39% paid, 26% earned and 35% owned.
1.3 Research question
One of the key challenges for any organization’s digital business is to learn how to identify the most impactful website visitors and sources to its website. The main research question for this thesis draws from the insight that website behavior measurement is critical for online businesses (R. E. Bucklin & Sismeiro, 2009) and web traffic analysis benefits firms performance (Luo & Zhang, 2013, Moe & Fader, 2004, Vaughan, 2008, Vaughan & Yang 2013). Website behavior analysis and web traffic analysis are equal to website visitor
Introduction
24
analysis. Today businesses typically have a combination of owned, earned and paid media activity (Stephen & Galak, 2012), yet their connection with website visitors is not well known. Therefore, the main research question is:
How does website behavior differ between owned, earned and paid website visitors? The main research question is examined through a case study, where each type of traffic is being driven from Facebook to an online media website. The website behavior data is collected using the web analytics tool Piwik, and analyzed using Chi-Square analysis and One-Way ANOVA.
In order to find out answers to the main research question, there is a need to identify each type of website visitors and build a measurement model for owned, earned and paid traffic. Therefore, the supporting research questions is:
How to measure owned, earned and paid traffic and visitors?
A research framework is proposed for the measurement of traffic and visitors in third chapter. In the case study, we propose an application of the measurement model and test it in the social media context.
In the next chapter we will conduct a literature review about web analytics and then continue our review of owned, earned and paid media.
Literature Review
25
2 Literature Review
2.1 Web Analytics
Marketers have realized that interactions and performance of website visitors needs to be tracked as clients are interacting with companies through digital channels more and more (Chaffey & Patron, 2012). Traditionally, this has been measured by conducting market research and interviewing customers on their website experiences. According to Weischedel and Huizingh (2006), this method is expensive, time-consuming and requires a long time interval. However, it can answer the questions “how” and “why” (Weischedel & Huizingh, 2006). Web technology on the other hand can collect massive amounts of data on visitor traffic and activities on websites on a very detailed level (Ghandour et al., 2010). Data collection about people visiting the site can be automated and enable the aggregation of data over many visitors, granting managers the ability to assess their website performance more holistically (Ghandour et al., 2010; Schonberg, Cofino, & Hoch, 2000).
The modern method of utilizing web technology to assess digital channels is referred as web analytics. It is used to “understand online customers and their behaviors, design actions influential to them, and ultimately foster behaviors beneficial to the business and achieve the organization’s goal” (Nakatani & Chuang, 2011). An advantage of WA is its ability to collect objective data on actual “online customer behavior and subsequent business outcomes” (Järvinen & Karjaluoto, 2015). Järvinen & Karjaluoto (2015) refer to WA as a “tool that collects clickstream data regarding the source of website traffic (e.g., e-mail, search engines, display ads, social links), navigation paths, and the behavior of visitors during their website visits and that presents the data in a meaningful format.” Clickstream data are defined as the “electronic record of Internet usage collected by Web servers or third-party services” by (R. E. Bucklin & Sismeiro, 2009). Clickstream data is obtained by tracking website visitors’ mouse clicks on a website. Wilson (2010) conducted a study in b2b context that claims the data gathered can be used well to get insight on how visitors get and use online information, react to digital marketing and make purchases. Marketing executives may use performance measures obtained from clickstream data and web analytics software also as
Literature Review
26
a competitive asset to increase their overall digital marketing effectiveness (Wilson, 2010). The clickstream data of WA help managers to answer the questions “when” and “what” (Weischedel & Huizingh, 2006). For example, when the visitors entered the website and when did they complete a conversion? What did the visitors do on the site before converting? A manager at a publishing company might ask what were the top performing articles of the month and so forth. Since clickstream datasets contain the “activities of online users and records the virtual trail each user leaves behind while surfing the Web” (R. E. Bucklin & Sismeiro, 2009), many possible questions may be answered by analyzing this data.
Even though web analytics enable its users with many capabilities and offers vast amount of potential use cases, the usual case is that WA remains underutilized. Academic research on WA is limited and majority of it shows that there is a great development potential for WA utilization (Järvinen & Karjaluoto, 2015). Hong (2007) and Welling & White (2006) report that WA is used poorly and mostly occasionally on an operational level. They point out that there is lack of WA usage on strategic level and benefits of the usage on long-term business benefits remain unclear. WA has been studied in the fields of marketing, sales, communications information systems, information management, computer science, informetrics, webometrics, customer relationship management, performance measurement, website design, e-commerce, statistics and journalism in both b2b and b2c context across different industries. The next section of this chapter explores these studies.
According to R. E. Bucklin & Sismeiro (2009), clickstream data analysis potential for both practical and academic marketing is clearly untapped. For example, the number of published academic papers that base on clickstream data is much higher in the fields of computer mediated interactions and computer science than marketing (R. E. Bucklin & Sismeiro, 2009). Use of WA and clickstream data is even less common in the fields of information systems and information technology. In the next section we will also review research on clickstream analysis.
Literature Review
27
2.2 Current research on Web Analytics
Research on web analytics has been covered across multiple different academic disciplines. In this section, we review the most relevant ones for our research objectives.
Chaffey & Patron (2012) study WA from a digital marketing performance perspective. They find that companies often fail to get the potential return from web analytics. In turn, other research show that digital marketing performance measurement with WA has positively affected the efficiency of marketing actions and later increased sales revenue (Phippen et al., 2004; Wilson, 2010). Chaffey & Patron (2012) propose that the scope of WA should be enlarged beyond website optimization to other forms of digital media in order to emphasize the role of marketing optimization activities in marketing performance improvement. When discussing about the scope, they bring up the model of owned, earned and paid media as a current model considering this. Compared to other WA research, this is a rare case where the model of OEP is mentioned in a web analytics focused research. Järvinen & Karjaluoto (2015) enlarge the scope to online customer behavior measurement, online customer response measurement, and optimization of digital marketing elements and actions (Nakatani & Chuang, 2011). Companies can demonstrate short-term results of marketing actions in digital environments, because actions and resulting outcomes are linked to each other directly (Järvinen, Töllinen, Karjaluoto, & Platzer, 2012). This can be further utilized to optimize results by adjusting marketing actions in real-time.
In many former studies, the benefits of WA are discussed and proven regarding businesses whose transactions can be done online. Although WA is limited to digital environments, it drives the important development of more measurable marketing in a larger context (Järvinen & Karjaluoto, 2015). As a matter of fact, many offline marketing elements can already be tracked with WA (Järvinen & Karjaluoto, 2015). Also, Järvinen & Karjaluoto (2015) found that benefits from WA are extended also to business sectors in which transactions cannot be processed online. For B2B businesses it is still very typical that transactions are not processed online. Nonetheless, clickstream data analysis offers B2B marketers a more comprehensive picture of how Internet is affecting is B2B buying decisions according to previous studies (eg. Deeter-Schmelz & Kennedy, 2002; Wilson, 2010). Wilson (2010) support their claim by saying that clickstream analysis offers the ability to gain
Literature Review
28
knowledge about website visitors and their website behavior, such as how much time they spend on a website and what products and services they are interested about. Connecting these web metrics to a database through cookie data or log-on information will give B2B a more complete picture of individual website visitor’s behavior over time (Wilson, 2010).
Analysis of clickstream data, that is relevant for marketing, has developed through the last decades. R. E. Bucklin & Sismeiro (2009) group these advances in clickstream-based research into three broad research themes:
Theme 1. Peoples’ navigation in the new medium including research papers of website choice, browsing behavior and the extent and nature of search across websites.
Theme 2. Online advertising methods including research papers of banner advertising, paid search, and email.
Theme 3. Online shopping and online purchases prediction including research papers on purchase conversion, completion of activities prior to purchase, online auctions and consideration sets.
2.2.1 Theme 1:Peoples’ navigation in the new medium
Website browsing behavior was studied on the early days of clickstream analysis by Huberman, Pirolle, Pitkow, & Lukose (1998). They discuss the subject of understanding and predicting online behavior of an individual and suggest that cost-benefit perspective could be useful for that. However, they did not consider user navigation behavior changes over time and possible learning effects. Johnson, Bellman & Lohse (2003) explored the idea of visitors learning to use a website more effectively as they navigate and become more familiar with the website’s content. They found evidence that website visitors’ time per session decreases the more they visit the same website. Also R. Bucklin & Sismeiro (2003) explored learning effects and found that repeat visits by the same visitor had no effect on page view duration but led to fewer page views. Similar finding were made by Johnson, Bellman and Lohse (2003) with the addition that having fewer page views leads to decreased session duration but not less time spent viewing each page. When trying to determine whether having less or more page views or shorter or longer visit duration is better, it clearly depends on the business and its objectives. For an ecommerce business it might be good to get visitors to spend less time and browse fewer pages in order to speed up the purchase process. However, in media and
Literature Review
29
entertainment it might be beneficial to maximize the number of page views in order to increase the amount of served ads on the site (R. E. Bucklin & Sismeiro, 2009), leading to increased revenue. If this is done by spreading content across different pages, the number of page views and page view duration may not be good metrics for site quality and users’ engagement. In this case, the visit duration metric might be more appropriate in assessing site usage. (R. E. Bucklin & Sismeiro, 2009). According to R. E. Bucklin & Sismeiro (2009), detailed browsing records can be used to identify different site usage patterns across visitors. Moe (2003) did a cluster analysis based on visitor website behavior, where she identified four shopping strategies: search/deliberation, direct buying, hedonic browsers and knowledge-building. Each cluster was identified to have different navigation patterns and propensities to purchase from the site. Also Montgomery, Li, Srinivasan & Liechty (2004) studied browsing patterns by modeling website within-site transition choices. They explain browsing behavior through two states: deliberation and browsing. They suggested that visitor may switch from a state to other during a website visit and found evidence that this occasionally occurs. R. E. Bucklin & Sismeiro (2009) explored also other studies that investigate browsing behavior and search across multiple websites from visitor-level clickstream data. They brought up that doing this might help in predicting behavior on other websites based on the behavior in previous ones. Later, Park & Fader (2004) developed a stochastic timing model of cross-site visit behavior exploring the correlations in visit behavior between competing websites. They found that data on visit behavior on another site increases predictability of future visit behavior on another site. Park and Fader (2004) showed how this finding can be applied in forecasting when a visitor might make their first visit to a website based on their visits on competing websites.
R. E. Bucklin & Sismeiro (2009) remark that “click-stream based studies have found Internet users to have substantial site loyalty and high switching costs.” Johnson, Moe, Fader, Bellman & Lohse (2004) report that shoppers and air travel site visitors stay loyal to a very few websites on a monthly basis. Smith and Brynjolfsson (2001) support these findings on their study of an Internet price-comparison service. They found that the biggest online book retailers could have a considerable price advantage over others that helps to get clicks from the comparison service. Visitor-level data on households was used by Goldfarb (2006) when discovering that users do have switching costs for online portals, which leads to loyalty that drives a large portion of the website traffic to the sites and generate substantial revenue.
Literature Review
30
Evidence on switching costs was also discovered by Chen and Hitt (2002) when they studied online brokerage firms’ clickstream data. The variation of switching costs varied significantly across visitors, which was explained mostly system usage measures and firm characteristics that were associated with reduced switching costs.
The “lock-in” situation of having learning effects and switching costs, discovered from cross-site clickstream research is an important factor in daily Internet usage and recommends firms to pay attention to techniques in driving visitor retention (R. E. Bucklin & Sismeiro, 2009).
2.2.2 Theme 2: Online advertising methods
As reported by Bucklin and Sismeiro (2009), Clickstream data can be used to measure Internet advertising exposure and users’ reactions to it, such as clickthroughs or purchases. This allows us to connect advertising exposure to a user’s behavioral response (R. E. Bucklin & Sismeiro, 2009). The main categories of online advertising according to Bucklin and Sismeiro (2009) are display advertising, also known as banner advertising and paid search advertising, also known as search engine marketing, which usually occurs in services such as Google and Yahoo. Bucklin and Sismeiro (2009) found that clickstream research primarily focuses on banner advertising, but more research is happening around paid search. Also, e-mail has been studied as an advertising medium in clickstream-based research. Bucklin & Sismeiro (2009) point out that online word-of-mouth and recommendation systems and medium have become important topics but click-stream based studies have not been conducted in these areas in significant amounts. Social media, such as Facebook can be thought-of as an online word-of-mouth and recommendation system. Facebook also serves paid display advertising and therefore is an interesting subject for us to conduct clickstream related research.
Banner type advertising success can be measured with clickthroughs, but it is also argued that part of the value advertisers see in the format may come from other results that are generated by the exposure to paid banner advertising. All of this might not be measurable in clickstream data. (R. E. Bucklin & Sismeiro, 2009). Drèze and Hussherr (2003) suggest that brand awareness and recall would be more suitable measures for display advertising performance than clickthrough. Ilfeld and Winer (2002) found in their click-stream based