Abstract-- This paper deals with the analytical -statistical method for the face recognition. Although the bases of the face recognition are known by researchers worldwide, the statistical tests of data obtained by measuring chosen anthropometrical points can be found in several articles. Our aim is to show how the data act during the various emotions of one face, which will be helpful for deeper knowledge of how the face behaves. The focus is also aimed at study of aging. The data were tested in the S TATIS TICA software using e.g. the ANOVA, the S hapiro-Wilk test, the k-Means clustering and the t-test. Acquired results reflect the difficulty of describing the face and the applicability of combination of different recognition methods (e.g. methods based on neural networks, recognition of facial contours, distribution of the gray scale in the image, deformation models) to get the best results in the verification/identification of a human.
Index Term-- pattern recognition, face recognition, statistical methods, biometrics
I. INT RODUCT ION
The face recognition is one of the most utilized technologies for protection of assets. The roots of this technique lie in the anthropology, respectively in the judicial anthropometry by A. Bertillon. As can be apparent this method from the 19th century evolved into criminalistic portrait identification (also called photo-anthropometry). This attitude was utilized mainly in the 1960s with the advancement in analytical-statistical and graphical methods for identification of a person. This paper is focused on analytical-statistical method, which was mainly used in the 1970s, and is a representative of one of the simplest methods of today’s techniques . The obtained information is characterized by the space and linear structure of the face, which characterized the individuality. The scientific analysis proved that only 12 basic anthropometrical points are quite
T his work was supported by the Internal Grant Agency at T omas Bata University in Zlín, project No. IGA/FAI/2013/001, and by the European
Regional Development Fund under the Project CEBIA-T ech No. CZ.1.05/2.1.00/03.0089.
K. Sulovská is with T omas Bata University in Zlín, Faculty of Applied Informatics, Department of Security Engineering, nám. T. G. Masaryka 5555, 76001 Zlín, the Czech Republic (phone: +420 57 603 5133; fax: fax: +420
57 603 2717; e-mail: [email protected]).
S. Bělašková is with T omas Bata University in Zlín, Faculty of Applied Informatics, Department of Mathematics, nám. T. G. Masaryka 5555, 76001
Zlín, the Czech Republic (e-mail: [email protected]). M. Adámek is with T omas Bata University in Zlín, Faculty of Applied Informatics, Department of Security Engineering, nám. T. G. Masaryka 5555,
76001 Zlín, the Czech Republic (e-mail: [email protected]).
adequate for this characterization (Fig. 1) [14]. As the anthropometry is a three-dimensional measurement, the photo-anthropometry deals with the two-dimensional photographs, which can bring serious difficulties [9], [10], [11], [12]. One of the limiting factors is the quality and the angulation of the photograph [16].
Fig. 1. Extended number of anthropometrical points (marked order meets [14]) When focusing on statistical approaches to the face recognition, especially focused on emotional changes in faces, only the machine recognition is disposable [1], [2], [5], [6], [7], [13], [18], [19]. This type of recognition shows the utilization of the bases made by the photo -anthropometry in the way enriched by the novel computational methods [8], which raises the accuracy of verification/identification.
Although 12 points are enough, we may add extra points adapted to the image. Such points need to be clearly visible in the image. Features like hair features or hairlines, which can be easily modified, should be omitted as they are unreliable and unpredictable for computerized methods. Features like face shape have higher rates of interobserver agreement, and pronounced ear projection is said to be the best discriminators [3], [4], [15], [16]. The resolution of processed image for the use in police-court (forensic) applications is set to be standardly 500 dpi (e.g. used by FBI also for fingerprint
Study of Face Recognition Using Statistical
Analysis
recognition) [17].
The aim of this paper is to introduce statistically evaluated data to get the picture of changes in the face while changing emotions or aging. This may help to develop or improve existing algorithms for the face recognition systems for commercial applications (e.g. login into computers in varying conditions).
II. MET HODS A. Images and Data Acquisition
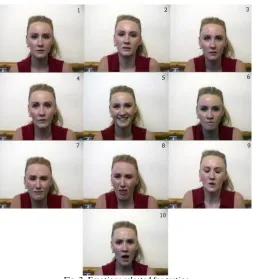
The images were obtained from the Psychological Image Collection of the University of Stirling (UK) in the 720 × 576 pixels (≈ 25.40 cm × 20.32 cm) resolution. The camera stayed in the same position and the model did not change the position/rotation of her head (frontal faces), only the emotional expression changed.
Fig. 2. Emotions selected for testing
The second set of pictures was obtained from the Google picture gallery of Elizabeth Taylor, aging from the age of 5 to 78 years. The resolution of images in average is 340 × 450 pixels, all images were normalized to ensure same measuring conditions.
Only 10 faces from emotion set and 12 from aging set were selected, as the calculation and measuring process would be very demanding in bigger amount of pictures. For each face, 28 anthropometrical points (Fig. 1) were selected and marked in the image, according to [16] and [21], which means 16 more points against the basic research and 12 points. The distance between each pair of points, respectively the lengths of chosen abscissae were measured manually three times; the average values were calculated and further processed, while the standard deviations were omitted due to their inconsiderable
values. In a few cases, the measurement was impossible to be done due to the insufficiency of the chosen point or its covering. Distances are in pixels (1 px ≈ 3.528 × 10⁻² cm) for higher accuracy. Following emotions were measured: anger, sadness, aversion, pain, disdain, shock, and dislike. The aging was surveyed with c. 7 year step if possible. These experiments follows our previous work [17] focusing on normal expression of faces.
B. Software equipment
The measurements were done manually by the Adobe Photoshop CS 5 ver. 10.0 (64 bit version), where the images could be easily measured in pixels or centimeters. The manual measurement on the computer was chosen to avoid errors made by the solo software solution.
Statistical software package Statistica 10 (StatSoft, Inc.) and R version 2.15.1 were used for all statistical analysis. Significance was accepted at 0.05 level. Both programs communicate with Microsoft Office, which was used for data collection (MS Excel).
III. RESULT S AND DISCUSSION A. Emotional influence
Data are highly correlated as expected at the beginning of the measurements and statistical testing. Distribution of the faces (Fig. 3) was compared using paired t-test. The picture shows the similarity of various expressions of one face. In each face, some slight differences can be found. This was expected as the changes in faces were significant in some cases and easy to describe. The most frequent changes may be found in the size of the mouth, jaw-bones, nose/nostrils and eyes.
Mean Mean SD Mean±2SD Outlier face 1
face 2 face3
face 4 face 5
face 6 face 7
face 8 face 9
face 10 -100
-50 0 50 100 150 200 250 300 350 400
Fig. 3. Box plot for 10 chosen faces
very analogical. This fact is enhanced by the cluster graph (Fig. 4).
face 4 face 5 face 8 face 10 face 7 face 6 face 3 face 9 face 2 face 1 20
30 40 50 60 70 80 90 100 110 120
Dis
tan
c
e
s
of
c
on
n
ec
ti
on
s
Fig. 4. Cluster graph for various faces
Fig. 4 shows the resemblance, respectively the congruence of faces. The most diverse face from the set is the aforementioned face No. 4. This face is also different from the other ones in the size of the nostrils (the length of the abscissa between the edges of the nostrils; abscissa 15 - 16), the length of the face (led by the center of the face; abscissa 17 - 14), and by the width of the face (abscissae 27 – 28 and 11 – 12. The fact that the Face 4 is different the most is reflected in the (paired) t-test values.
The significance level 0.05 shows two most different faces as the pair of:
- Face 1 and 4 (E1: Mean 84.05, SD 57.3), (E4: Mean 88.25, SD 64.07), No. of valid 83, t = -2.69, DF = 82, p-value = 0.0085
- Face 1 and 5 (E5: Mean 81.13, SD 55.91), No. of valid 83, t = 2.44, DF = 82, p-value = 0.0178
The p-value achieves higher values, which means that within ten measurements the values are reciprocally statistically similar, and thus shows the invariability within the measurement for each distance.
Another tested method is based on mathematical modeling, where the General linear model and 3rd type decomposition are used for orthogonal estimation. Response in this model is Face 1, independent continuous variables included remaining emotions. We want to show which faces describes the normal face most, respectively which faces are the most similar ones . The results of model show that the biggest influence on the Face 1 (the normal neutral state) has the Face 3 and 9. This influence is biggest in the meaning of statistical significance, which means that those faces are closest to the Face 1. The model as whole is also statistically significant: R2
(determination coefficient) = 0.997006, F = 3072.100, corresponding coefficients E3 (p-value = 0.000386, F = 13.83332) and E9 (p-value = 0.017831, F = 5.87181).
The last test is the k-Means clustering as nonhierarchical clustering method. The main idea of k-Means clustering is to
define (assume of clustering) centroids, one for each cluster. To know which faces are most similar, three (normal, happy and sad face) groups were subjectively chosen to be grouped on the basis of the Euclidean distances between clusters computed from the respective cluster means on the dimensions used for the classification. For distance between two objects or cluster centers use the Statistica algorithm computed as unscaled squared Euclidean distances for the distance measure
(1)
where is number of continuous variable and is the
mean for variable and cluster .
Then, the faces could be divided into these clusters:
TABLE I
CLUSTERING OF FACE WITH EMOTIONS
1st cluster 2nd cluster 3rd cluster Face Distance Face Distance Face Distance
1 5.510045 5 4.757356 4 -
2 4.460480 7 3.423933
3 2.387733 8 4.686604
6 3.817505 9 3.586104 10 4.626791
Cluster 1 Cluster 2 Cluster 3 1-15 2-16 3-10 3-18 5-18 7-8 9-10 14-17 17-28 23-25
-200 -150 -100 -50 0 50 100 150 200 250 300 350 400 450
Fig. 5. k-mean clustering graph (various emotions)
difference can be also made unconsciously when taking images of the girl at Stirling from a slightly different distance, which could change the face features distances by millimeters/pixels. The 2nd cluster consists of three faces, which are again not similarly emotional colored. Faces No. 5 and 7 have similar width and height, although one express es happiness and the second one sadness. Face 8 is in comparison to the rest again elongated.
The 1st cluster may be described similarly to the 2nd one, as the group is inconsistent for the first sight, too. This situation probably occurs due to selected points (Fig. 1), which are not able to affect some of the gentle expression lines that are visible for human eyes.
As this study is focused es pecially on abscissae’s length, the study of angles between selected points is its minor part. While studying faces together with angles, the grouping process may change a little. The presumption is that each face would be described better, which would be clearer from the data analysis and different clustering results. Unfortunately, this may cause
problems during programming the face
recognition/identification software.
As a matter of interest, the table of means and variances is attached. As is evident from Table III, the highest value of the mean can be found in the variable 17-5, while the minimal angle has the pair 8-24 and the maximal one pair 14-5. Far the largest variance (variability of values) can be found for the pair 13-26 (53.0023), whilst the smallest variance can be seen at the pair 14-5 (3.4760).
TABLE III
EXAMP LE OF ANGLES IN THE FACE
Variable Emotions - angles
Mean Min. Max. Variance SD
8-23 10.36 5.3 17.8 15.9071 3.9884
8-24 8.83 3.1 14.9 13.4179 3.6630
13-25 58.54 47.1 64.1 24.5627 4.9561 13-26 57.27 39.3 65.0 53.0023 7.2803 14-4 98.69 78.1 84.5 4.5188 2.1257 14-5 82.14 79.3 85.3 3.4760 1.8644 14-15 75.42 70.0 79.4 9.5218 3.0857 14-16 77.19 74.0 80.0 5.1321 2.2654 17-4 77.83 72.5 81.1 7.2223 2.6874 17-5 99.95 77.1 85.1 6.7294 2.5941 18-6 51.00 47.5 55.4 5.5711 2.3603 18-7 50.63 45.4 54.1 9.7446 3.1216
The calculated median of the standard deviations is 2.45°. The biggest value difference (difference between the minimal and the maximal angle value) is 25.70° for the pair 13-26 and the lowest one is 5.60° for the pair 17-26, while the average value is 10.5°. The agreement of all examined faces is 88.37%, which can be considered as satisfactory, because of the fact that faces’ expressions changed.
B. Aging
The approach to statistical analysis of the aging is different, as we do not compare one main face to differences caused by
emotional changes. To insight deeply the aging issue, the ANOVA focused on main effects was chosen to describe properly the changes in the face. Again, k-mean clustering was done to see how the data behave when grouped.
Two-way ANOVA without interaction uses two effects – the first one is aging of all 12 faces , the second one is in our case measured size abscissae and its influence on distance. The value of testing statistics is for the aging effect F = 2.54, DF = 11 and corresponding p-value is 0.0036 with the test power 0.97 (α = 0.05). For the variable measured abscissae is the testing statistics F = 4.52, DF = 82 and p-value < 0.0001 with the test power 1 (α = 0.05). To multiple data comparison is done through the Tukey HSD test with following results: the different faces are couples Face 1 and 4 (p-value 0.013), Face 1 and 5 (p-value 0.036), Face 1 and 7 (p-value 0.008). This result can be incurred by different stages of life of each face in comparison to Face 1 where the image was taken in the age of 5 years. The most significant abscissae are 13-17 and 14-17 (Fig. 1), which demarcate the face halves, respectively forms the line stretched from chin to the top center of forehead over the center of the abscissa 1-2 on the lips.
Aging effects are also tested by the k-Means clustering (Fig. 6). Three cluster groups were chosen in this case – youth, middle age and old age. The k-Means averages clustering runs in two iteration steps creating clusters with closes distances between them.
TABLE IV CLUSTERING OF AGING FACES
1st cluster 2nd cluster 3rd cluster Face Distance Face Distance Face Distance
1 6.991059 2 5.386596 4 8.60504
8 6.991059 3 4.337937 5 8.05444
6 5.253891 7 7.61941
9 5.820103 12 15.38497
10 4.926516 11 5.885256
TABLE V
K-MEAN CLUSTERING GRAP H (AGING)
Cluster 1 Cluster 2 Cluster 3 1-15 2-16 3-10 3-18 5-18 7-8 9-10 14-17 17-28 23-25
The 1st cluster contains only two images, taken in different stages of the life (age of 45 and age of 5). These two images were clustered together probably due to shapes and contours of used features points. As we do not us e more than 28 points, the measurement result is unable to “see” slight variations in aging face like wrinkles, signs, etc.
The 2nd cluster is more homogenous, although it does not contain faces from approximately similar life period. In this group, faces throughout the life (18 – 60 years) are presented and have one common sign – the face in all images is a bit wider in contrast to narrow faces in the 1st cluster.
The 3rd cluster also contains heterogeneous faces which are paired together except the Face 12, which is narrower and was taken in the age of 75 years . The biggest distinction is therefore the Face 12, where a weight loss that can be seen in old people mostly after 70 birthdays occurs.
Though the data seem to be clustering inappropriately, clustering of aging faces has, according to our opinion, better results and is clustered more logically than clustering in case of various emotions, which seems to be more accidental at first sight.
IV. SCOPE AND LIMIT AT IONS OF T HE WORK In this study we gathered statistical information about how the emotional changes in one face and aging changes of one person acts during their evaluation for the recognition purposes. We studied only small sample of faces as such manual measurements is a time-consuming process.
This study was limited to the images of one woman and images of Elizabeth Taylor during her life. We did not study the effects of aging by analysis of angles between selected points, analyzing the fat mass on both women’s face and its variability during life, and determine the exact phase of the hormonal cycle of the examined persons (e.g. the research of Dr. Lisa M. DeBruine), which can influence the sharpness of face features and their rigorous determination in space.
V. CONCLUSION
The face recognition is a very difficult process. In the age of automated systems, the probability of finding similar faces, apart from its possible emotional changes, rises with every modern algorithm. This paper’s aim was to show, how the data are variable if measured by clas sical statistical-analytical technique used by the photo-anthropometry. According to the performed tests, the changes in one face’s emotions are statistically evaluated as similar for the intra-individual group, although testing with the inter-individual group showed the insufficiency of method [17]. For such cases, the innovative approaches of the modern face recognition (e.g. neural networks, recognition based on gray-scale, etc.) or addition of more anthropometrical points (up to 600) focusing on bigger amount of features can be marked as the only solution for databases with dozens more faces, respectively their etalons.
The further research should be aimed in additional deep studies of bigger amount of normal faces, faces with emotional changes and aging faces, together with the study of angles between chosen points, and the face relief. It is also necessary
to focus on the issue of faces with plastics, after losing and putting on weight, hormonal changes in different life times, and changes like temporary adenoncosis or temporary skin color change (e.g. bruises, burns, etc.). The recognition difficulties with movements of faces are being resolving by the software way, and may be supported by further research to get better exactness. Alternatively, the study of affinity and inheritance of faces’ features of family members may be an interesting research conductive to the prevention of security risks and threads, e.g. terrorism, organized crime.
ACKNOWLEDGMENT
We would like to thank the project “Psychological Image Collection” at Psychology, School of Natural Sciences, University of Stirling, Scotland, UK accessible at pics.stir.ac.uk for the variable datasets of faces.
REFERENCES
[1] Abdallah S.: Investigation of New T echniques for Face Detection. Blacksburg, Virginia, 2007, Virginia polytechnic institute
[2] Atick J. J. et al.: Statistical approach to shape from shading: reconstruction of three-dimensional face surfaces from single two-dimensional images. In Neural Computation, 8, 1321 –1340, 1996 [3] Bettadapura V. K.: Face Expression Recognition and Analysis: T he State
of the Art. Tutorial May 2009, Columbia University, 12/01/09, available on: <http://www.cc.gatech.edu/~vbettada/files/FaceExpression RecSurvey.pdf>
[4] Brunelli R., Poggio T .: Face recognition: features vs. templates. In IEEE T rans. Pattern Analysis and Machine Intelligence, 15(10), 1042 –1053, 1993
[5] Chellappa R. et al.: Human and machine recognition of faces: a survey. In Proc. IEEE, 83(5), 705–740, 1995
[6] Daugman J.: Face and gesture recognition: overview. In I EEE T rans. Pattern Analysis and Machine Intelligence, 19(7), 675 –676, 1997 [7] Etemad K., Chellappa R.: Discriminant analysis for recognition of
human face images. In J. Opt. Soc. Am. A/ Vol. 14, No. 8/August 1997 [8] Fukunaga K.: Introduction to Statistical Pattern Recognition. 2nd edition,
Academic Press, 1991
[9] Jain A. K., Li S. Z.: Handbook of Face Recognition. Springer Science + Business Median Inc., New York, 2005, ISBN 0 -387-40595-X [10] Jain, A. K. et al.: An Introduction to Biometric Recognition. IEEE
T ransactions on Circuits and Systems for Video T echnology, 2004, vol. 14, no. 1
[11] Koschan A. et al (eds): 3D Imaging for Safety and Security. Springer, Netherlands, 2007, e-ISBN 978-1-4020-6182-0
[12] Maurer D. E., Baker J. P.: Fusing multimodal biometrics with quality estimates via Bayesian belief network. In Pattern Recognition, Elsevier, 41 (2008) 821 – 832
[13] Mou, D.: Machine-based Intelligent Face Recognition. Berlin Heidelberg: Springer-Verlag, 2010, ISBN 978-3-642-00750-7 [14] Rak, R. et al.: Biometry and Identity of the Person in Forensic and
Commercial Applications. Prague, Grada Publishing, 2008, ISBN 978-80-247-2365-5
[15] Samal A., Iyengar P. A.: Automatic Recognition and Analysis of Human Faces and Facial Expression: A Survey. In Pattern Recognition, 25 (1), 65 – 77, 1992
[16] Siegel J. A. et al.: Encyclopedia of Forensic Sciences. Four-volume set, pgs. 773 – 815, Elsevier, 2000, ISBN: 978-0-12-227215-8 [17] Sulovská K. et al: Comparing Manually Measured Anthropometrical
Points of Human Faces with Fully Computerized Ones. In XX IMEKO World Congress 2012 - Proceedings [CD-ROM]. Busan: IMEKO, 2012, 5 pgs., ISBN 978-89-950000-5-2
[19] Wayman J. et al.: Biometric Systems: technology, design and performance evaluation. Springer-Verlag London Limited, 2005, ISBN 1-85233-596-3
[20] Lübbers H. T . et al.: T he influence of involuntary facial movements on craniofacial anthropometry: a survey using a three-dimensional photographic system. In British Journal of Oral and Maxillofacial Surgery, Volume 50, Issue 2, March 2012, Pgs. 171 – 175
[21] Han K. et al.: Comparison of anthropometry with photogrammetry based on a standardized clinical photographic technique using a cephalostat and chair. In Journal of Cranio-Maxillofacial Surgery, Volume 38, Issue 2, March 2010, Pgs. 96 – 107
![Fig. 1. Extended number of anthropometrical points (marked order meets [14]) When focusing on statistical approaches to the face recognition, especially focused on emotional changes in faces, only the machine recognition is disposable [1], [2], [5], [6],](https://thumb-us.123doks.com/thumbv2/123dok_us/1374044.1647546/1.612.358.522.266.494/anthropometrical-statistical-approaches-recognition-especially-emotional-recognition-disposable.webp)