487
International Journal of Pharmaceutical Sciences and Drug Research 2018; 10(6): 487-491
Research Article
ISSN: 0975-248X
CODEN (USA): IJPSPP
A Validated RP-HPLC Method for the Determination of Diltiazem
in Raw Material and Pharmaceutical Dosage Form
B M S Kumar
*, B. Rajkamal, B. Chandramowli
Mewar University, NH-79, Gangrar, Chhitorgarh-312901, Rajasthan, India
Copyright © 2018 B M S Kumar et al. This is an open access article distributed under the terms of the Creative Commons Attribution-NonCommercial-ShareAlike 4.0 International License which allows others to remix, tweak, and build upon the work non-commercially, as long as the author is credited and the new creations are licensed under the identical terms.
ABSTRACT
The objective of this work is to develop and validate a reverse phase high performance liquid chromatography (RP-HPLC) method for the quantitative analysis of Diltiazem in bulk and pharmaceutical dosage form. Chromatographic analyses were performed on RP C-18 column with a mobile phase consisting of 0.01M ammonium acetate in water, methanol and acetonitrile in the ratio 700:240:60 at a flow rate of 1 mL/min. The Diltiazem was detected and quantitated using a photodiode array detector at a wavelength of 295 nm with a retention time of 11.57 min. The detector response was linear in the concentration of 20-60µg/ml, the respective linear regression equation being Y=3000181x+356238.2. The limit of detection and limit of quantification were 0.5µg/ml and 0.15µg/ml respectively. The assay of Diltiazem in bulk was found to be 99.85%. From the recovery studies it was found that about 101% on average of Diltiazem was recovered which indicates high accuracy of the method. The method was validated by determining its accuracy, precision and system suitability. The method fulfilled the requirements for reliability and feasibility for application to the quantitative analysis of Diltiazem in bulk and pharmaceutical dosage form.
Keywords:Diltiazem, calcium channel blockers, hypertension, method validation, ICH guidelines.
DOI: 10.25004/IJPSDR.2018.100609 Int. J. Pharm. Sci. Drug Res. 2018; 10(6): 487-491
*Corresponding author: Mr. B M S Kumar
Address: Mewar University, NH-79, Gangrar, Chhitorgarh-312901, Rajasthan, India Tel.: +91-9848514228
E-mail: [email protected]
Relevant conflicts of interest/financial disclosures: The authors declare that the research was conducted in the absence of any commercial or financial relationships that could be construed as a potential conflict of interest.
Received: 02 October, 2018; Revised: 25 October, 2018; Accepted: 06 November, 2018; Published: 20 November, 2018
INTRODUCTION
Calcium channel blockers (CBCs) are used as antihypertensive drugs, i.e., as medications to decrease blood pressure in patients with hypertension. CCBs are particularly effective against large vessel stiffness, one of the common causes of elevated systolic blood pressure in elderly patients. Calcium channel blockers are also frequently used to alter heart rate, to prevent cerebral vasospasm and to reduce chest pain caused by
Int. J. Pharm. Sci. Drug Res. November-December, 2018, Vol 10, Issue 6 (487-491)
amino) ethyl]-2,3-dihydro-2-(4-methoxyphenyl)-1,5-benzothiazepin-4(5H)one) (Figure 1).
Literature survey reveals few spectrophotometric methods for estimation of Diltiazem in human plasma [5-6] and pharmaceutical dosage forms. [7-15] The aim of the study was to develop a simple, precise and accurate reversed-phase HPLC method for the estimation of Diltiazem in bulk drug samples and in pharmaceutical dosage form.
Fig. 1: Structure of Diltiazem
MATERIALS AND METHODS
Diltiazem was obtained as a gift sample from Hetero Drugs Ltd Hyderabad. Ammonium acetate, acetonitrile and methanol used were of HPLC grade (Qualigens). Commercially available Diltiazem tablets (Dilcontin® 60 mg) were procured from local market.
Instrument
Quantitative HPLC was performed on a Waters Alliance 2695 Separations Module is a high performance liquid chromatographic system with variable wave length PDA-Detector and powered with Empower-2 Software. The column used was Waters Spherisorb® RP C-18, 4.6 × 250 mm (250 × 4.6 mm i.d; particle size 5μm).
HPLC Conditions
The mobile phase comprises of 0.01M ammonium acetate in water, methanol and acetonitrile in the ratio 700:240:60. The contents were filtered through a 0.45μm membrane filter, pumped from the respective solvent reservoirs to the column at a flow rate of 1.0 ml/min. The run time was set at 20.0 min and the column temperature was 45°C. Prior to the injection of the drug solution, the column was equilibrated for at least 30 minutes with the mobile phase flowing through the system. The eluents were monitored at 295 nm.
Preparation of standard stock solution
A standard stock solution of the drug was prepared by dissolving 50 mg of Diltiazem in 100 ml volumetric flask containing 50 ml of water, sonicated for about 15 min and then made up to 100 ml with water to get approximately 500µg/ml.
Preparation of working standard solution:
5ml of the primary standard stock solution of 500µg/ml was taken in 50 ml volumetric flask and thereafter made up to 50 ml with mobile phase to get a concentration of 50µg/ml.
Preparation of sample solution
Dilcontin® tablets equivalent to 50 mg of the active
ingredient was mixed with 70 ml of mobile phase in 100 ml volumetric flask. The mixture was allowed to stand for 1 hour with intermittent sonication for complete solubility of the drug, and then filtered through a 0.45μm membrane filter, followed by addition of mobile phase up 100 ml to obtain a stock solution of 500µg/ml. The resultant solution was further diluted by taking 5 ml of the stock solution with 50 ml of mobile phase to get the concentration of 50µg/ml.
Fig. 2: Typical System suitability Chromatogram of Diltiazem standard solution.
Fig. 3: Typical Chromatogram of Diltiazem working sample
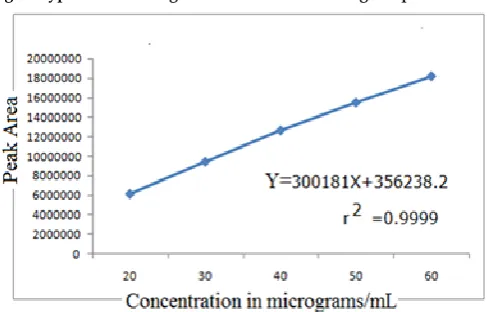
Fig. 4: Standard Calibration Curve of Diltiazem
RESULTS AND DISCUSSION Analytical method validation
The HPLC method was validated according to the International Conference on Harmonization (ICH) guidelines (2005). [16] The following characteristics were considered for validation: specificity, linearity, range, accuracy, precision, LOD, LOQ and robustness.
Int. J. Pharm. Sci. Drug Res. November-December, 2018, Vol 10, Issue 6 (487-491)
Diltiazem. Linearity was determined from plot peak area vs. concentration for the five concentrations (20-60μg/ml). The regression equation and regression coefficient were calculated using least square methodology. The accuracy was tested by calculating the percent recovery of the mean concentration of Diltiazem at three different concentration levels (40, 50 and 60μg/ml), and the relative standard deviation (RSD) was determined.
The precision of the method was ascertained separately from the peak area obtained by actual determination of 6 replicas of a fixed amount of drug and formulation. The results were reported as %RSD. The LOD and LOQ were determined from the specific calibration curve obtained using six standard solutions that were the closest to the LOQ.
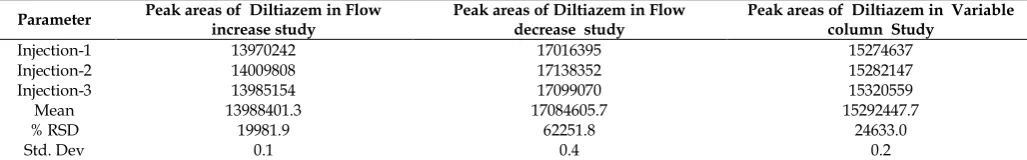
Robustness was evaluated by deliberately varying the flow rate and using similar columns.
System suitability
The system suitability tests were carried out on freshly prepared stock solution of Diltiazem standard and sample. The system was suitable for use, the tailing factors for Diltiazem were 1.85 and USP theoretical plates were found to be significantly high around 7245 (Figure 2, 3).
Precision
The precision of the method was ascertained separately from the peak area obtained by actual determination of 6 replicas of a fixed amount of drug and formulation. The HPLC systems was set up at described Chromatographic conditions, mentioned as above and follow the system to equilibrate, injected 50µg/ml of Diltiazem standard 6 times and recorded the response (peak area). The proposed method was extended to the pharmaceutical dosage forms by injecting the 50µg/ml of Diltiazem sample with the formulated sample from Dilcontin containing Diltiazem of same concentration 6 times and recorded the response (peak area). The percent relative standard deviation and percent range of error (at 0.05 and 0.01 confidence limits) were calculated and presented in Table 2.
Linearity
Aliquots of standard Diltiazem stock solution were taken in different 10 ml volumetric flasks and diluted up to the mark with the mobile phase to obtain the final concentrations of Diltiazem in the range of 20-60μg/ml. Each of these drug solutions (20μL) was injected three times into the column, and the peak areas and retention times were recorded (Table 3, 4). Evaluation was performed with PDA detector at 295 nm and a calibration graph was obtained by plotting peak area versus concentration of Diltiazem. The linearity chromatograms presented in Figure 4.
Assay and recovery studies
Recovery studies were conducted by analyzing pharmaceutical formulation in the first instance for the active ingredient in the working standard of concentrations 80% (40µg/ml), 100% (50µg/ml) and 120% (60µg/ml) by the proposed method. Each
concentration was injected 3 times and the peak area recorded. Known amounts of pure drug 80% (40µg/ml), 100% (50µg/ml and 120% (60µg/ml) was then added to each 3 previously analyzed formulation and the total amount of the drug was once again determined by the proposed method (each concentration was again injected 3 times) after keeping the active ingredient concentration within the linearity limits. The Recovery data is given in Table 5.
Table 1: Performance & Detection Characteristics of HPLC method
Parameter
Results of the proposed HPLC method Diltiazem
Standard solution sample solution Diltiazem
Retention time (min) 11.570 11.823 Theoretical plates (n) 7245 7430
Plates per meter (N) 28980 29720 HETP 3.45065 × 10⁻⁵ 3.36473 × 10⁻⁵
Peak asymmetry (T) 1.85 1.92 Linearity range (µg/mL) 20-60
Limit of Detection
(µg/mL ) 0.05 Limit of Quantification
(µg/mL) 0.15
Table 2: Precision of Standard drug with statistics Injection
No.
Name of the drug & conc. (50 µg/ml)
Retention
time in min. Peak Area
1 Diltiazem sample-1 11.597 15589654 2 Diltiazem sample -2 11.605 15153698 3 Diltiazem sample -3 11.616 15874596 4 Diltiazem sample -4 11.622 15658794 5 Diltiazem sample -5 11.630 15658974 6 Diltiazem sample -6 11.637 15356894 Mean 11.618 15548768.33 % RSD. 0.015 254944.14
Std.
Deviation 0.13 1.63
Table 3: Linearity data of Diltiazem
S. No Concentration(µg/ml) Area
1 20 6125691
2 30 9965893
3 40 13125612
4 50 16003642
5 60 18904934
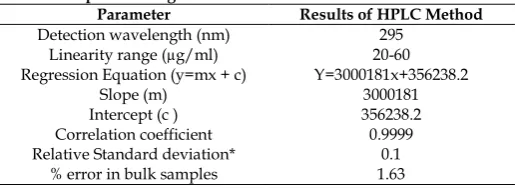
Table 4: Optical & Regression Characteristics of HPLC method
Parameter Results of HPLC Method
Detection wavelength (nm) 295 Linearity range (µg/ml) 20-60 Regression Equation (y=mx + c) Y=3000181x+356238.2
Slope (m) 3000181 Intercept (c ) 356238.2 Correlation coefficient 0.9999 Relative Standard deviation* 0.1
% error in bulk samples 1.63
Robustness
Int. J. Pharm. Sci. Drug Res. November-December, 2018, Vol 10, Issue 6 (487-491)
the retention time and chromatographic response of the method, indicating that the method was robust. When the chromatographic conditions were deliberately altered, system suitability results remained within acceptance limits and selectivity for individual substance was not affected. The results of the study prove the robust nature of the method (Table 6 and Table 7).
Limit of detection [LOD] and Limit of quantification [LOQ]
The detection limit of the method was investigated by injecting standard solutionsDiltiazeminto the HPLC column. By using the signal-to-noise method the peak-to-peak noise around the analyte retention time is measured, and subsequently, the concentration of the analyte that would yield a signal equal to certain value of noise to signal ratio is estimated. A signal-to-noise ratio (S/N) of 3 is generally accepted for estimating LOD and signal-to-noise ratio of 10 is used for estimating LOQ. This method is commonly applied to analytical methods that exhibit baseline noise.
The limit of detection (LOD) and limit of quantification (LOQ) for Diltiazem were found to be 0.05µg/ml and 0.15µg/ml respectively.
The author has developed a sensitive, accurate and precise RP-HPLC for the estimation of Diltiazem in bulk drug and in pharmaceutical dosage form. From the typical chromatogram of Diltiazemit was found that the retention time was 11.570 min. The mobile phase consisting of 0.01M ammonium acetate in water, methanol and acetonitrile in the ratio 700:240:60 at a flow rate of 1.0 ml/min and eluents were monitored at 295 nm. The method was found to be most suitable to obtain a peak well defined and free from tailing. In the present RP- HPLC method, the standard and sample preparation required less time and no tedious extraction were involved. A good linear relationship (r2=0.999) was observed between the concentration range of 20-60µg/ml. The assay of Diltiazemin bulk was found to be 99.85%. From the recovery studies it was found that about 101% on average of Diltiazem was recovered which indicates high accuracy of the method.
Table 5: Recovery Peak areas of Diltiazem by Accuracy studies
S. No Recovery at 80% dilution level Recovery at 100% dilution level Recovery at 120% dilution level
Standard Spiked Standard Spiked Standard Spiked
1 12105542 13995406 15166296 16982253 18393278 19937765 2 12062082 13993842 15149180 16975559 18204944 20143657 3 12063724 13994795 15192077 16994139 18223729 20046329 Avg 12077116.0 13994681.0 15169184.3 16983983.7 18273983.7 20042583.7
SD 24631.3 788.2 21593.9 9410.1 103738.0 102997.1
%RSD 0.2 0.0 0.1 0.1 0.6 0.5
% Recovery 104.5 98.08 99.41
Table 6: Robustness study of Diltiazem Standard solution at 100 % level (50μg/ml)
Parameter Peak areas of Diltiazem in Flow increase study Peak areas of Diltiazem in Flow decrease study Peak areas of Diltiazem in Variable column Study
Injection-1 14069361 17028319 15322433 Injection-2 13979535 17091603 15357329 Injection-3 13951021 17129794 15365196 Mean 13999972.3 17083238.7 15348319.3
% RSD 61760.4 51252.0 22760.7
Std. Dev 0.4 0.3 0.1
Table 7: Robustness study of Diltiazem sample solution at 100 % level (50μg/ml)
Parameter Peak areas of Diltiazem in Flow
increase study
Peak areas of Diltiazem in Flow decrease study
Peak areas of Diltiazem in Variable column Study
Injection-1 13970242 17016395 15274637 Injection-2 14009808 17138352 15282147 Injection-3 13985154 17099070 15320559 Mean 13988401.3 17084605.7 15292447.7
% RSD 19981.9 62251.8 24633.0
Std. Dev 0.1 0.4 0.2
The validation results demonstrate that the developed HPLC method is simple, linear, accurate, sensitive and reproducible. Thus, can be easily used for the routine quality control of bulk and pharmaceutical dosage form of Diltiazem within a short analysis time. Results of the analysis of pharmaceutical formulations revealed that proposed methods are suitable for their analysis with virtually no interference of the usual additives present in the pharmaceutical formulations.
REFERENCES
1. Colin. D. Therapeutic Drug, Churchill Livingstone. Division of Longman Group, London, UK, 2nd edition, 1999.
2. Sweetman S.C, Martindale: The Complete Drug Reference, Pharmaceutical Press, 33rd edition, 2002.
3. MazzoD J, Obetz CL, Shuster J. Diltiazem hydrochloride. Analytical Profiles of Drug Substances and Excipients. 1994; 23:53–98.
4. Sweetman SC. Martindale: the complete drug reference, 36th edition London: Pharmaceutical Press, 2009; 1265-1268. 5. Li K, Zhang X, Zhao F. HPLC determination of Diltiazem in
Int. J. Pharm. Sci. Drug Res. November-December, 2018, Vol 10, Issue 6 (487-491) 6. Scott Johnson M, Wahba Khalil SK. An HPLC Method for the
Determination of Diltiazem and Desacetyl Diltiazem in Human Plasma. J Liq Chromatogr. 2006; 10(4):673-685. 7. Vivekanand A. Chatpalliwar PK, Neeraj U. Validated
gradient stability indicating HPLC method for determining Diltiazem Hydrochloride and related substances in bulk drug and novel tablet formulation. J Pharm Anal. 2012; 2(3):226-37. 8. Sultana N, Arayne MS, Shafi NA. Validated method for the analysis of Diltiazem in raw materials and pharmaceutical formulations by RP-HPLC. Pak J Pharm Sci. 2007; 20(4):284-90.
9. Mateus A, Carlos E, Fernando H, Gerson Antônio P.
Development and validation of a stability indicating HPLC method to determine Diltiazem hydrochloride in tablets and compounded capsules. Braz. J. Pharm. Sci. 2017; 53(3):1-8. 10. Khalid H. HPLC method development for the simultaneous
determination and validation of Diltiazem hydrochloride and its major metabolite desacetyl Diltiazem hydrochloride.Der Pharma Chemica.2014; 6(6):358-65.
11. Shafi N, Farhan A, Huma N, Nawab S, Arif Z, Azhar H, Ali Akbar S, Mirza T. An Overview of Analytical Determination of Diltiazem, Cimetidine, Ranitidine, and Famotidine by UV Spectrophotometry and HPLC Technique. Journal of Chemistry. 2013; Article ID 184948:16 pages.
12. Imran A, Mohd S, Mohammad N, Zeid A, Abdulrahman A. Chiral resolution of multichiral center racemates by different modalities of chromatography. J Liq Chromatogr Relat Technol.2016; 39(9):435.
13. Ayad MM, Abdellatef HE, Hosny MM, Sharaf YA. Application of 4-chloro-7-nitrobenzofurazan for the analysis of propafenone and Diltiazem hydrochlorides using kinetic spectrophotometric and spectrofluorimetric methods. Eur J Chem. 2013; 4(1):35–43.
14. Pravin Cumar R, Vasudevan M, Raman D. RP-HPLC method development and validation for the estimation of Diltiazem in bulk and tablet dosage forms. Asian J Pharm Clin Res. 2012; 5(3):62-64.
15. Sojitra R, Virani P, Raj H. Diltiazem Hydrochloride: A Review on Analytical Method and Its Determination in Pharmaceuticals Dosage Form and Biological Matrix. Inventi Rapid: Pharm Analysis & Quality Assurance. 2014; (4):1-8. 16. International Conference on Harmonization, ICH Guidelines,
Validation of Analytical Procedures Technical Requirements for Registration of Pharmaceuticals for Human Use: Text and Methodology Q 2 (R1), International Conference on Harmonization, Geneva, Switzerland, November 2005.