e-ISSN: 2278-067X, p-ISSN: 2278-800X, www.ijerd.com
Volume 12, Issue 3 (March 2016), PP.20-27
Validation of Deration of Heat Transfer Coefficient with
Brine Usage
Nikhil Tamhankar
1, Atharv Godhamgaonkar
2, Shaunak Sathe
3, Salil Inamdar
41
Mechanical Department, Smt. Kashibai Navale College of Engineering, Sr. No. 44/1, Off Sinhgad Road, Vadgaon (Bk), 411041 Pune, Maharashtra, India
2 Mechanical Department, Smt. Kashibai Navale College of Engineering, Sr. No. 44/1, Off Sinhgad Road,
Vadgaon (Bk), 411041 Pune, Maharashtra, India
3 Mechanical Department, Smt. Kashibai Navale College of Engineering, Sr. No. 44/1, Off Sinhgad Road,
Vadgaon (Bk), 411041 Pune, Maharashtra, India
4 Mechanical Department, Smt. Kashibai Navale College of Engineering, Sr. No. 44/1, Off Sinhgad Road,
Vadgaon (Bk), 411041 Pune, Maharashtra, India
Abstract:- The lowest possible recommended temperature of the chilling water as refrigerant in industrial LiBr vapor absorption systems can go down to about 44°F or 6.67°C. In cold countries, especially in Europe and North America this poses a major problem in the usage of vapor absorption system chillers in the colder part (major part) of the year, as water freezes at 0°C and the temperatures are way below that mark. The solution to this problem is the use of brines or antifreeze agents instead of water. Ethylene and propylene glycols are found to be most suitable for this purpose, especially ethylene glycol, due to several favorable thermo-physical properties. However, the usage of brines leads to change in the heat transfer characteristics of the fluid in the heat exchanger. Also, fouling takes place due to the usage of brines. This leads to lowering of the heat transfer coefficient, also known as deration of the heat transfer coefficient. The authors have attempted to study the deration that occurs with the use of various concentrations of ethylene glycol and suggest optimum concentration of ethylene glycol for general industrial purposes.
Keywords:- glycol, deration, heat transfer coefficient, chiller
I.
INTRODUCTION
Vapor compression cycle commonly used in refrigeration systems uses mechanical energy as the work input. An alternative to such system is the vapor absorption system, which uses heat as the work input. Vapor absorptions systems are of various types, depending on what refrigerant they use. One such popular system is the LiBr system which is used throughout the world. In lithium bromide absorption system lithium bromide salt solution is used as the absorbent and water as the refrigerant. A concentrated solution of lithium bromide has a great affinity for water. Since water is the refrigerant, the refrigerant operating temperature in the evaporator (heat exchanger) has to be above the freezing point of water (0oC) of water. Hence, in order to use this system in the cold countries water needs to be replaced with brine solutions which have lower freezing points. The use of brines solves the problem of freezing of water, however creates a new problem, that of decrease in heat transfer characteristics as well as fouling in the tubes of the heat exchanger. As a result, both these phenomenon result in lowering of the heat transfer coefficient. This is known as deration in the heat transfer coefficient.
II.
MATERIALS
AND
METHODS
The testing took place at a factory located in Chinchwad, Pune. A U-tube shell and tube heat exchanger designed by Bell-Delaware method was used for testing. Auxiliaries used were manometers, thermometers, a hydrometer, a pump, a secondary heat exchanger, a mixing barrel, a supply for process steam and water.
Table I: Specifications of the primary heat exchanger used for testing
Particulars Symbol Unit Value
Number of Tubes Nt 26
Tube side Passes Pst 2
Shell I.D Ds m 0.1541
Bundle dia Db m 0.1434
Tube thickness T m 0.0010
Tube I.D di m 0.0170
Tube Pitch Pt m 0.0240
Tube Length L m 0.685
No of baffles 2
Baffle Pitch lB m 0.228
Tube vertical pitch Pt' m 0.0210
Baffle height Bh m 0.0930
Baffle cut height Hc m 0.0610
height between baffle tips m 0.0320
Baffle cut fraction Bc m 0.3962
O/S Area m² 1.063
III.
TEST
SETUP
As seen in the fig, the setup prominently consisted of two shell and tube heat exchangers - a) Primary heat exchanger
b) Secondary heat exchanger
The secondary heat exchanger carried steam on the shell side and the brine solution i.e. ethylene glycol solution from concentrations 0% (water) to 30% on the tube side. The steam is required to heat the brine solution to the required range of temperatures for testing in the primary heat exchanger. The primary heat exchanger had two inlets for the hot brine solution and for the cooling water, and two outlets- one for the cooled brine solution and one for the heated water. In the primary heat exchanger which is a U-tube type, the hot brine solution flowed through the tubes while the cooling water flowed on the shell side. Two U tube manometers were used to measure the pressure heads at the hot brine solution inlet and the cooling water inlet to the primary heat exchanger. Four thermometers were used to measure temperatures at the tube side and shell side inlets and outlets to the primary heat exchanger. A mixing barrel received the cooled brine solution. A centrifugal pump was used to pump the same solution back into the system.
Fig.1: Block diagram of Brine testing setup
IV.
TESTING
PROCEDURE
AND
CALCULATIONS
a) Initially, the steam and cooling water inlets were opened. b) The pump motor was started.
c) The various pipes and joints were tested for any leaks.
d) Leaks, if found were immediately repaired after stopping the system e) Once, the system was found to be reasonably perfect, it was restarted.
f) The various parameters were then measured and the readings were noted down only when the steady state of temperatures and pressures was obtained.
g) The pressure heads at both inlets to the primary heat exchanger were measured from the manometers. h) A chart was available to directly calculate the mass flow rates for the brine solution and the cooling
i) The inlet and outlet temperatures for the tube side were measured- Thi and Tho. j) The inlet and outlet temperatures for the shell side were measured-Tci and Tco. k) The heat transfer on the tube and shell side was then calculated.
Qh = mh.cph (Thi - Tho) (1) Qc = mc. Cpc (Tco - Tci ) (2)
l) The percentage error in between Qh and Qc was then calculated. m) (Qh – Qc) / (Qh or Qc) x 100
n) If the error was less than 5% only then were the readings accepted. o) For each concentration, on an average five acceptable readings were noted.
p) For every set of acceptable readings, the total heat transfer coefficient U was calculated.
q) The deration in heat transfer coefficient was calculated by comparing the U calculated for concentrations (>0%) of ethylene glycol with the U calculated for 0% of ethylene glycol solution. r) The graphs for the same were plotted.
V.
OBSERVTIONS
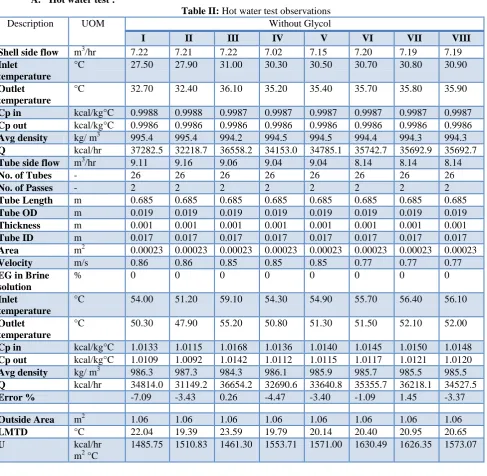
A. Hot water test :
Table II: Hot water test observations Description UOM Without Glycol
I II III IV V VI VII VIII
Shell side flow m3/hr 7.22 7.21 7.22 7.02 7.15 7.20 7.19 7.19
Inlet temperature
°C 27.50 27.90 31.00 30.30 30.50 30.70 30.80 30.90
Outlet temperature
°C 32.70 32.40 36.10 35.20 35.40 35.70 35.80 35.90
Cp in kcal/kg°C 0.9988 0.9988 0.9987 0.9987 0.9987 0.9987 0.9987 0.9987
Cp out kcal/kg°C 0.9986 0.9986 0.9986 0.9986 0.9986 0.9986 0.9986 0.9986
Avg density kg/ m3 995.4 995.4 994.2 994.5 994.5 994.4 994.3 994.3
Q kcal/hr 37282.5 32218.7 36558.2 34153.0 34785.1 35742.7 35692.9 35692.7
Tube side flow m3/hr 9.11 9.16 9.06 9.04 9.04 8.14 8.14 8.14
No. of Tubes - 26 26 26 26 26 26 26 26
No. of Passes - 2 2 2 2 2 2 2 2
Tube Length m 0.685 0.685 0.685 0.685 0.685 0.685 0.685 0.685
Tube OD m 0.019 0.019 0.019 0.019 0.019 0.019 0.019 0.019
Thickness m 0.001 0.001 0.001 0.001 0.001 0.001 0.001 0.001
Tube ID m 0.017 0.017 0.017 0.017 0.017 0.017 0.017 0.017
Area m2 0.00023 0.00023 0.00023 0.00023 0.00023 0.00023 0.00023 0.00023
Velocity m/s 0.86 0.86 0.85 0.85 0.85 0.77 0.77 0.77
EG in Brine solution
% 0 0 0 0 0 0 0 0
Inlet temperature
°C 54.00 51.20 59.10 54.30 54.90 55.70 56.40 56.10
Outlet temperature
°C 50.30 47.90 55.20 50.80 51.30 51.50 52.10 52.00
Cp in kcal/kg°C 1.0133 1.0115 1.0168 1.0136 1.0140 1.0145 1.0150 1.0148
Cp out kcal/kg°C 1.0109 1.0092 1.0142 1.0112 1.0115 1.0117 1.0121 1.0120
Avg density kg/ m3 986.3 987.3 984.3 986.1 985.9 985.7 985.5 985.5
Q kcal/hr 34814.0 31149.2 36654.2 32690.6 33640.8 35355.7 36218.1 34527.5
Error % -7.09 -3.43 0.26 -4.47 -3.40 -1.09 1.45 -3.37
Outside Area m2 1.06 1.06 1.06 1.06 1.06 1.06 1.06 1.06
LMTD °C 22.04 19.39 23.59 19.79 20.14 20.40 20.95 20.65
U kcal/hr
m2 °C
B. 10% Ethylene Glycol solution:
Table III: 10% Brine solution test Observations
Average Deration = 4.72%
Description UOM With 10% Ethylene Glycol
I II III IV V VI VII VIII
Shell side flow m3/hr 7.22 7.19 7.19 7.19 7.19 7.19 7.22 7.22
Inlet temperature
°C 32.00 32.10 32.50 32.60 32.50 32.60 32.60 32.80
Outlet temperature
°C 36.40 36.30 39.50 38.80 38.50 38.10 37.80 37.20
Cp in kcal/kg°C 0.9986 0.9986 0.9986 0.9986 0.9986 0.9986 0.9986 0.9986
Cp out kcal/kg°C 0.9987 0.9986 0.9988 0.9987 0.9987 0.9987 0.9987 0.9987
Avg density kg/ m3 994.0 994.0 993.4 993.5 993.6 993.6 993.7 993.7
Q kcal/hr 31539.2 29980.5 49963.0 44253.6 42826.5 39257.9 37271.7 31537.9
Tube side flow m3/hr 9.83 9.83 9.25 9.36 9.35 9.47 9.47 9.70
No. of Tubes - 26 26 26 26 26 26 26 26
No. of Passes - 2 2 2 2 2 2 2 2
Tube Length m 0.685 0.685 0.685 0.685 0.685 0.685 0.685 0.685
Tube OD m 0.019 0.019 0.019 0.019 0.019 0.019 0.019 0.019
Thickness m 0.001 0.001 0.001 0.001 0.001 0.001 0.001 0.001
Tube ID m 0.017 0.017 0.017 0.017 0.017 0.017 0.017 0.017
Area m2 0.00023 0.00023 0.00023 0.00023 0.00023 0.00023 0.00023 0.00023
Velocity m/s 0.93 0.93 0.87 0.88 0.88 0.89 0.89 0.91
EG in Brine solution
% 10 10 10 10 10 10 10 10
Inlet temperature
°C 54.90 54.60 69.70 65.20 63.50 61.50 59.40 56.80
Outlet temperature
°C 51.80 51.70 64.30 60.50 59.20 57.50 55.70 53.70
Cp in kcal/kg°C 0.9733 0.9731 0.9832 0.9802 0.9791 0.9777 0.9763 0.9746
Cp out kcal/kg°C 0.9712 0.9711 0.9796 0.9771 0.9762 0.9750 0.9738 0.9725
Avg density kg/ m3 1000.7 1000.8 995.2 996.9 997.5 998.2 999.0 999.9
Q kcal/hr 30741.5 28752.8 51027.8 44771.4 40861.1 38432.6 35486.1 30388.7
Error % -2.59 -4.27 2.09 1.16 -4.81 -2.15 -5.03 -3.78
Outside Area m2 1.06 1.06 1.06 1.06 1.06 1.06 1.06 1.06
LMTD °C 19.14 18.94 30.99 27.14 25.84 24.14 22.34 20.24
U kcal/hr
m2 °C
1510.62 1427.82 1548.73 1551.58 1487.44 1497.46 1494.09 1412.11
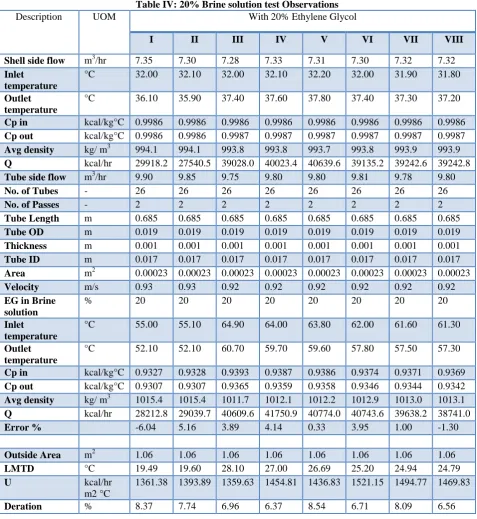
C. 20% Ethylene Glycol solution:
Table IV: 20% Brine solution test Observations
Description UOM With 20% Ethylene Glycol
I II III IV V VI VII VIII
Shell side flow m3/hr 7.35 7.30 7.28 7.33 7.31 7.30 7.32 7.32
Inlet temperature
°C 32.00 32.10 32.00 32.10 32.20 32.00 31.90 31.80
Outlet temperature
°C 36.10 35.90 37.40 37.60 37.80 37.40 37.30 37.20
Cp in kcal/kg°C 0.9986 0.9986 0.9986 0.9986 0.9986 0.9986 0.9986 0.9986
Cp out kcal/kg°C 0.9986 0.9986 0.9987 0.9987 0.9987 0.9987 0.9987 0.9987
Avg density kg/ m3 994.1 994.1 993.8 993.8 993.7 993.8 993.9 993.9
Q kcal/hr 29918.2 27540.5 39028.0 40023.4 40639.6 39135.2 39242.6 39242.8
Tube side flow m3/hr 9.90 9.85 9.75 9.80 9.80 9.81 9.78 9.80
No. of Tubes - 26 26 26 26 26 26 26 26
No. of Passes - 2 2 2 2 2 2 2 2
Tube Length m 0.685 0.685 0.685 0.685 0.685 0.685 0.685 0.685
Tube OD m 0.019 0.019 0.019 0.019 0.019 0.019 0.019 0.019
Thickness m 0.001 0.001 0.001 0.001 0.001 0.001 0.001 0.001
Tube ID m 0.017 0.017 0.017 0.017 0.017 0.017 0.017 0.017
Area m2 0.00023 0.00023 0.00023 0.00023 0.00023 0.00023 0.00023 0.00023
Velocity m/s 0.93 0.93 0.92 0.92 0.92 0.92 0.92 0.92
EG in Brine solution
% 20 20 20 20 20 20 20 20
Inlet temperature
°C 55.00 55.10 64.90 64.00 63.80 62.00 61.60 61.30
Outlet temperature
°C 52.10 52.10 60.70 59.70 59.60 57.80 57.50 57.30
Cp in kcal/kg°C 0.9327 0.9328 0.9393 0.9387 0.9386 0.9374 0.9371 0.9369
Cp out kcal/kg°C 0.9307 0.9307 0.9365 0.9359 0.9358 0.9346 0.9344 0.9342
Avg density kg/ m3 1015.4 1015.4 1011.7 1012.1 1012.2 1012.9 1013.0 1013.1
Q kcal/hr 28212.8 29039.7 40609.6 41750.9 40774.0 40743.6 39638.2 38741.0
Error % -6.04 5.16 3.89 4.14 0.33 3.95 1.00 -1.30
Outside Area m2 1.06 1.06 1.06 1.06 1.06 1.06 1.06 1.06
LMTD °C 19.49 19.60 28.10 27.00 26.69 25.20 24.94 24.79
U kcal/hr
m2 °C
1361.38 1393.89 1359.63 1454.81 1436.83 1521.15 1494.77 1469.83
Deration % 8.37 7.74 6.96 6.37 8.54 6.71 8.09 6.56
Sample Calculation for average deration:
U hot water =
(𝟏𝟒𝟖𝟕.𝟕𝟓+𝟏𝟓𝟏𝟎.𝟖𝟑+𝟏𝟒𝟔𝟏.𝟑𝟎+𝟏𝟓𝟓𝟑.𝟕𝟏+𝟏𝟓𝟕𝟏.𝟎𝟎+𝟏𝟔𝟑𝟎.𝟒𝟗+𝟏𝟔𝟐𝟔.𝟑𝟓+𝟏𝟓𝟕𝟑.𝟎𝟕) 𝟖
= 1551.6
Uavg for glycol solution:
Uavg =
(1361 .38+1393.89+1359 .63+1454 .81+1436 .83+1521 .15+1494 .77+1469.83) 8
= 1436.53625
Average Deration = Uhot water −U avg
= (1551 .6−1436 .53625 )
1551 .6
= 7.42%
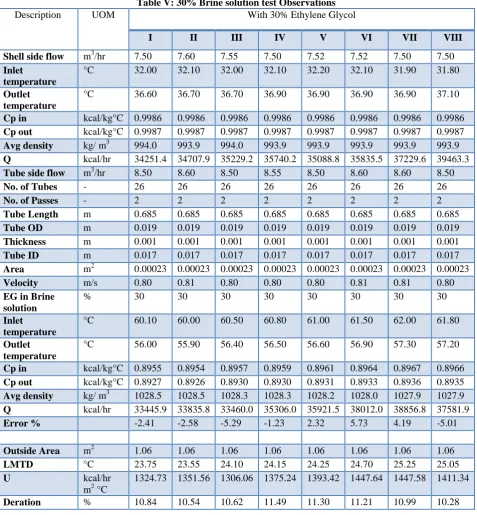
D. 30% Ethylene Glycol solution:
Table V: 30% Brine solution test Observations
Description UOM With 30% Ethylene Glycol
I II III IV V VI VII VIII
Shell side flow m3/hr 7.50 7.60 7.55 7.50 7.52 7.52 7.50 7.50
Inlet temperature
°C 32.00 32.10 32.00 32.10 32.20 32.10 31.90 31.80
Outlet temperature
°C 36.60 36.70 36.70 36.90 36.90 36.90 36.90 37.10
Cp in kcal/kg°C 0.9986 0.9986 0.9986 0.9986 0.9986 0.9986 0.9986 0.9986
Cp out kcal/kg°C 0.9987 0.9987 0.9987 0.9987 0.9987 0.9987 0.9987 0.9987
Avg density kg/ m3 994.0 993.9 994.0 993.9 993.9 993.9 993.9 993.9
Q kcal/hr 34251.4 34707.9 35229.2 35740.2 35088.8 35835.5 37229.6 39463.3
Tube side flow m3/hr 8.50 8.60 8.50 8.55 8.50 8.60 8.60 8.50
No. of Tubes - 26 26 26 26 26 26 26 26
No. of Passes - 2 2 2 2 2 2 2 2
Tube Length m 0.685 0.685 0.685 0.685 0.685 0.685 0.685 0.685
Tube OD m 0.019 0.019 0.019 0.019 0.019 0.019 0.019 0.019
Thickness m 0.001 0.001 0.001 0.001 0.001 0.001 0.001 0.001
Tube ID m 0.017 0.017 0.017 0.017 0.017 0.017 0.017 0.017
Area m2 0.00023 0.00023 0.00023 0.00023 0.00023 0.00023 0.00023 0.00023
Velocity m/s 0.80 0.81 0.80 0.80 0.80 0.81 0.81 0.80
EG in Brine solution
% 30 30 30 30 30 30 30 30
Inlet temperature
°C 60.10 60.00 60.50 60.80 61.00 61.50 62.00 61.80
Outlet temperature
°C 56.00 55.90 56.40 56.50 56.60 56.90 57.30 57.20
Cp in kcal/kg°C 0.8955 0.8954 0.8957 0.8959 0.8961 0.8964 0.8967 0.8966
Cp out kcal/kg°C 0.8927 0.8926 0.8930 0.8930 0.8931 0.8933 0.8936 0.8935
Avg density kg/ m3 1028.5 1028.5 1028.3 1028.3 1028.2 1028.0 1027.9 1027.9
Q kcal/hr 33445.9 33835.8 33460.0 35306.0 35921.5 38012.0 38856.8 37581.9
Error % -2.41 -2.58 -5.29 -1.23 2.32 5.73 4.19 -5.01
Outside Area m2 1.06 1.06 1.06 1.06 1.06 1.06 1.06 1.06
LMTD °C 23.75 23.55 24.10 24.15 24.25 24.70 25.25 25.05
U kcal/hr
m2 °C
1324.73 1351.56 1306.06 1375.24 1393.42 1447.64 1447.58 1411.34
Deration % 10.84 10.54 10.62 11.49 11.30 11.21 10.99 10.28
Fig.2:Graph of deration Vs concentration
VI.
CONCLUSIONS
a) As we can see from the graph of deration of heat transfer coefficient versus the concentration of ethylene glycol solution, the heat transfer coefficient decreases with increase in the concentration of glycol.
b) The optimum concentration of ethylene glycol varies according to the user requirements. But for general purposes, 10% by volume is the most suitable concentration which gives a balance between required freezing point depression and sufficient heat transfer rate.
c) The results that are calculated for the various concentrations of ethylene glycol can be extrapolated for temperatures below the freezing point of water to plot the corresponding heat transfer characteristics.
REFERENCES
[1]. Sinnott R.K., Chemical engineering design: Volume 6, 4th edition, Elsevier Butterworth-Heinemann,(2005) [2]. Kuppan T., Heat exchanger design handbook, 2nd edition, Marcel Dekker Inc., (2000)
[3]. Shah R.K and Sekulic´ D.P, Fundamentals of heat exchanger design, John Wiley & Sons Inc., (2003) B [4]. Kakac S. & Liu H., Heat exchangers: Selection, rating and thermal design. 2nd edition, CRC Press
LLC,(2002)
0 2 4 6 8 10 12
0 5 10 15 20 25 30 35
Deration Vs Concentration
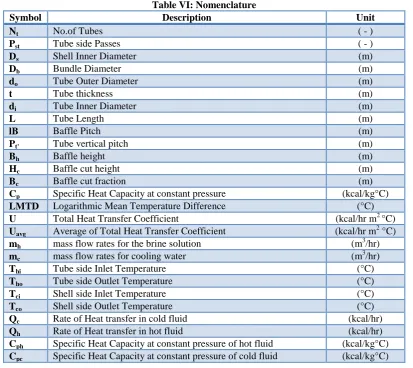
Table VI: Nomenclature
Symbol Description Unit
Nt No.of Tubes ( - )
Pst Tube side Passes ( - )
Ds Shell Inner Diameter (m)
Db Bundle Diameter (m)
do Tube Outer Diameter (m)
t Tube thickness (m)
di Tube Inner Diameter (m)
L Tube Length (m)
lB Baffle Pitch (m)
Pt' Tube vertical pitch (m)
Bh Baffle height (m)
Hc Baffle cut height (m)
Bc Baffle cut fraction (m)
Cp Specific Heat Capacity at constant pressure (kcal/kg°C)
LMTD Logarithmic Mean Temperature Difference (°C)
U Total Heat Transfer Coefficient (kcal/hr m2 °C)
Uavg Average of Total Heat Transfer Coefficient (kcal/hr m
2 °C) mh mass flow rates for the brine solution (m
3/hr)
mc mass flow rates for cooling water (m3/hr)
Thi Tube side Inlet Temperature (°C)
Tho Tube side Outlet Temperature (°C)
Tci Shell side Inlet Temperature (°C)
Tco Shell side Outlet Temperature (°C)
Qc Rate of Heat transfer in cold fluid (kcal/hr)
Qh Rate of Heat transfer in hot fluid (kcal/hr)