R E S E A R C H
Open Access
From quality to outcomes: a national study
of afterschool STEM programming
Patricia J. Allen
1*, Rong Chang
2, Britt K. Gorrall
2, Luke Waggenspack
2, Eriko Fukuda
2, Todd D. Little
2,3and
Gil G. Noam
1Abstract
Background:State afterschool networks across the US are engaged in system-building efforts to improve the quality of science, technology, engineering, and math (STEM)-focused afterschool programming. This study examined national trends in STEM program quality, youth outcomes, and the connections between these two data sources.
Methods:One thousand five hundred ninety-nine youths (grades 4–12) enrolled in 158 STEM-focused afterschool programs across 11 state networks completed a retrospective self-assessment measuring STEM attitudes and social-emotional learning (SEL)/twenty-first-century skills. Two hundred fifty standardized observations of STEM activities were performed to measure STEM program quality.
Results:(1) Most youth (65–85%) reported increases in STEM engagement, identity, career interest, career knowledge, relationships, critical thinking, and perseverance, with the largest gains reported by those engaging with STEM activities for 4 weeks or more; (2) there were significant, strong correlations between STEM and SEL/twenty-first-century
outcomes reported by youth; and (3) youth participating in higher-quality STEM programming reported more growth than peers participating in lower-quality programs.
Conclusion:This effort demonstrates how investments in STEM program quality yield high returns for programs and youth and how collaborations between research and practice can track successes and challenges, determine investments in program management, and expand advocacy and policy efforts. Additionally, this study supports a growing body of literature that suggests a synergy between youth development and STEM learning approaches that can improve outcomes for youth.
Keywords:STEM, Afterschool, System-building, Quality, Social-emotional learning, Twenty-first-century skills
Introduction
This article introduces a national effort known as after-school and science, technology, engineering, and math (STEM) system-building, which uses research-practice collaboration as a strategy to enhance informal STEM learning in children and adolescents across the United States (US) (Coburn & Penuel, 2016). Recommendations made by the National Research Council in 2009, as well as the launch of the US federal government’s “Educate to Innovate”campaign the same year, have led to significant investments to integrate both private and public sectors to support US STEM programs that meet afterschool, on the
weekends, or during the summer (Bell, Lewenstein, Shouse, & Feder, 2009; National Research Council, 2009; The White House,2009). The goals of state afterschool network system-builders in many of the 50 US states are to help practitioners increase the quantity and quality of program-ming as well as to improve equity, diversity, access, and outcomes in STEM. Research is a key component of state system-building to gage the effectiveness of this work and to continuously improve efforts on local, state, and national levels. To understand whether the specific investments made in the system-building effort is improving quality of programming and STEM learning in young people, our cross-state research team worked with funders, state net-work leaders, program directors, educators, and students to measure STEM program quality and youth outcomes across the US.
© The Author(s). 2019Open AccessThis article is distributed under the terms of the Creative Commons Attribution 4.0 International License (http://creativecommons.org/licenses/by/4.0/), which permits unrestricted use, distribution, and reproduction in any medium, provided you give appropriate credit to the original author(s) and the source, provide a link to the Creative Commons license, and indicate if changes were made.
* Correspondence:[email protected]
1The PEAR Institute, McLean Hospital and Harvard Medical School, Belmont, MA, USA
We begin by describing the state of STEM in the US and the ascent of afterschool in the educational landscape. We next describe the investments made to improve prac-tice and support afterschool STEM programming and re-port the methods and results of the first systematic study of this national afterschool and STEM system-building effort. We conclude with a discussion of key findings, limitations, and recommendations based on the significant relationships found between STEM program quality and youth outcomes.
The state of STEM in the US and the role of afterschool
The US presents an interesting paradox between STEM-related opportunity and attainment. Innovation drives the economy, and talent in the workforce drives innovation, but cultivation of STEM literacy, proficiency, mindset, identity, interest, and motivation in young people remains a challenge. Improving and expanding quality STEM edu-cation is considered a top priority in the US to foster innovative thinkers who can meet the demands of our increasingly STEM-focused world. Currently, STEM skills and experience are scarcer relative to workforce demands. For example, a recent analysis found that STEM positions, including jobs within computer and mathematical fields as well as life and physical sciences, are some of the most challenging to fill—often taking more than twice the dur-ation than jobs in the transportdur-ation, legal, production, and construction fields (Rothwell,2014).
Existing studies suggest that workforce challenges are a symptom of declining STEM attitudes and performance among children and youth in the US (OECD,2015). The importance of positive STEM attitudes, including STEM interest, engagement, and identity, among others, is evi-denced by studies of college course enrollment (Kidd & Naylor,1991), college major selection (Maltese & Tai,2011; Moakler & Kim,2014), college degree obtainment (Maltese & Tai, 2010; Tai, Liu, Maltese, & Fan, 2006), graduate school matriculation (Merolla & Serpe, 2013), and career attainment (Stets, Brenner, Burke, & Serpe,2017; Venville, Rennie, Hanbury, & Longnecker,2013). The importance of STEM performance is evidenced by longitudinal studies that have found that STEM achievement in childhood pre-dicts STEM achievement in adolescence (Morgan, Farkas, Hillemeier, & Maczuga,2016), that STEM career expecta-tions in childhood predict future STEM degree attainment (Tai et al.,2006), and that STEM performance in mid- to late-adolescence directly affects students’intent to major in STEM (Wang,2013). Given that STEM attitudes have been found to be key factors for increasing participation and per-sistence in STEM (Graham, Frederick, Byars-Winston, Hunter, & Handelsman,2013; Osborne, Simon, & Collins, 2003), strategies that can improve STEM attitudes show promise for opening new pathways in STEM for all youth, especially low-income youth, youth of color, and girls, who
disproportionately exit from STEM throughout school and college (Morgan et al.,2016).
Afterschool programs have emerged as key partners in STEM education to provide inspirational STEM enrich-ment opportunities that compleenrich-ment and suppleenrich-ment learning from the school day (Krishnamurthi, Ottinger, & Topol, 2013). One of the defining qualities of afterschool is hands-on engagement, which can help bring STEM to life and inspire inquiry, reasoning, hypothesizing, experi-menting, problem-solving, and reflecting on the value or importance of STEM in everyday life (National Research Council,2015; Noam & Shah,2013). As of 2014, US after-school programs are estimated to reach more than 10 mil-lion young people (Afterschool Alliance, 2014), including large numbers of traditionally underrepresented youth, underscoring the potential for afterschool settings to help narrow the STEM opportunity and achievement gaps. A recent study of 13,709 US households found that nearly 70% of parents reported that their child’s afterschool pro-gram offers a STEM learning opportunity, and more than 50% of parents considered STEM as a factor when select-ing a program (Afterschool Alliance,2014).
Another advantage of STEM learning in afterschool is the emphasis the field places on fostering positive youth development (National Research Council, 2002; Noam & Shah, 2014). Engagement of young people intellectually, academically, socially, and emotionally has been identified as one of the key criteria of programs that produce posi-tive youth outcomes (National Research Council, 2009, 2015). Afterschool programs can increase engagement with STEM by coupling STEM concepts with interesting activities that foster youth voice and choice, build relation-ships with adults and peers, apply STEM to real-world so-cial contexts, and support learning, thinking, interest, and identity development. This is important as studies have re-cently found that employers hiring for STEM jobs con-sider social-emotional learning (SEL) skills such as teamwork, collaboration, self-regulation, critical thinking, and problem-solving among the most important for making hiring decisions (Afterschool Alliance, 2017; The Business Roundtable,, and Change the Equation, 2014). SEL skills are referred to by many names, including twenty-first-century skills, workforce skills, life skills, es-sential skills, employability skills, noncognitive skills, or soft skills. For the purposes of the present paper, we refer to these broadly as SEL/twenty-first-century skills given the emphasis of afterschool programs on the development of SEL to impact all learning and performance on which twenty-first-century college, career, and life success de-pend (Pellegrino & Hilton,2012).
Afterschool and STEM system-building research
private foundations have invested in a nationwide capacity-building project known as STEM system-building to improve the quality, quantity, and accessi-bility of STEM afterschool programs across the US. As of October 2017, all 50 US states have a statewide after-school network, with 33 states also having either STEM system-building or planning grants (Mott Foundation and STEM Next, 2018). States receiving system-building support (1) engage key partners around a vision of quality STEM in afterschool, (2) map the existing landscape of afterschool and STEM efforts, (3) prioritize strategies and act to expand awareness of, supply of, and quality of STEM in afterschool through communication, policy, and professional development; and (4) measure the effective-ness of efforts (Mott Foundation and STEM Next,2018). Networks are provided a process framework, a program quality framework, standards, concrete strategies, train-ings, examples, and measurement tools to inform their work to improve and expand the quality of STEM-focused afterschool programs.
System-building states have increasingly focused on assessment of STEM-focused afterschool programs for a variety of practical reasons, including to support pro-grams’ continuous improvement efforts, to collect data to meet accountability requirements outlined in local and governmental policies, to show grant funders their return on investments, to advertise positive impacts of youth participation to the community, and to influence priorities for policymakers and other key educational stakeholders (Fredricks, Naftzger, Smith, & Riley,2017). Importantly, by coming together to form a nationwide network that implements common program quality standards and common measures (described below), the builders have made it possible to system-atically collect data to track successes and challenges at the national, state, and local levels to inform the research and practice communities about levels of program quality and youth experiences based on a large and representative sample.
The present study describes the research design, methods, and results of this collective action—taken by funders, state network leaders, program directors, edu-cators, and researchers—to measure national trends in the quality of STEM programming supported by state networks, national trends in the experiences of youth participating in programming, and the connections be-tween the two sources of data. The study was specific-ally designed to examine whether quality of STEM activities or length of youths’ involvement in program-ming increase STEM attitudes or SEL/twenty-first-cen-tury skills. This study builds upon the growing number of quantitative studies of program quality and youth attitudes conducted in afterschool settings, and the literature is briefly reviewed below.
Review of research on STEM attitudes in afterschool settings
Attitudes and beliefs about STEM have been primarily measured using self-report surveys, and while many have been developed and used in formal educational settings, fewer self-report surveys have been developed and vali-dated to study attitudes of youth participating in after-school programs and fewer studies have been conducted in afterschool/out-of-school time (OST) settings than in school settings. For instance, in an extensive literature review of peer-reviewed articles describing interest, mo-tivation, and attitudes toward science and technology, Potvin and Hasni (2014) found that only 14 out of a total of 189 survey-based studies published between 2000 and 2012 specifically examined OST STEM oppor-tunities (including summer camps, competitions, science fairs, and field trips). However, a growing body of literature indicates that participation in STEM-focused afterschool programs increases self-reported STEM interest, engagement, motivation, persistence, and iden-tity (Chittum, Jones, Akalin, & Schram, 2017; Dabney et al.,2012; Young, Ortiz, & Young,2017).
Interest in STEM—including career interest—and motiv-ation have both been studied extensively, in large part be-cause of their implications for encouraging more young people to pursue advanced levels of STEM education (Mal-tese & Tai,2010; Tai et al., 2006). For example, Tai et al. (2006) showed that an early interest in pursuing careers in the physical sciences or engineering was a stronger predictor of obtaining a college science degree than early academic achievement scores. A recent meta-analysis of 15 studies measuring STEM interest of youth participating in OST STEM activities (including afterschool and summer pro-grams or clubs) found that OST propro-grams had a small to medium positive effect on student interest in STEM (Young et al., 2017). Importantly, STEM interest is malleable and can be positively changed by afterschool programs. For in-stance, Chittum et al. (2017) found that fifth to seventh graders participating in a design-based STEM program (90 min per week for six to 12 weeks) that uses an inquiry-based approach reported significantly higher levels of science inter-est and competence than peers who did not participate.
definition of engagement—such as by asking youth to rate how often they participated in science-/STEM-related activities outside of school. Few studies have examined the cognitive and emotional components of STEM engagement in afterschool settings (Martinez, Linkow, Velez, & DeLisi,2014).
STEM interest and engagement are closely linked to STEM identity development (Cribbs, Hazari, Sonnert, & Sadler,2015). A recent National Research Council (2015) synthesis report highlights the importance of a STEM learning identity and the role afterschool can play in its development. Existing studies of STEM identity in after-school settings have primarily relied upon qualitative methods, such as interviews, observations, and analysis of youth notebook entries (Barton & Tan,2010; Tan, Barton, Kang, & O’Neill,2013; Wulf, Hinko, & Finkelstein,2013). These have found that STEM identity is strongly linked to the depth of learning and persistence in STEM, and stu-dents who come to value STEM and believe they can do STEM are more likely to report an interest in STEM ca-reers (Aschbacher, Ing, & Tsai,2014). The development of STEM identity is viewed as an important factor in improv-ing STEM participation among youth underrepresented in STEM. For example, Stets et al. (2017) found that science identity had a stronger influence on underrepresented col-lege students’ intent to move into science career after graduation than other factors such as science self-efficacy or academic performance.
Review of research on STEM program quality in afterschool settings
The literature on the assessment of STEM program quality in afterschool settings has been sparser than attitudinal stud-ies. Program quality has been primarily measured using observation tools, and while many have been developed and used in formal educational settings (Bell et al.,2012), fewer quality observation tools have been developed and used to study the general quality of afterschool programs, such as the Youth Program Quality Assessment (YPQA) and Prom-ising Practices Rating Scale (PPRS) (Naftzger, Sniegowski, Smith, & Riley, 2018; Oh, Osgood, & Smith, 2015). There are even fewer observation tools that have been designed specifically to measure the quality of afterschool STEM pro-gramming (Shah, Wylie, Gitomer, & Noam,2018).
The Dimensions of Success (DoS) (Shah et al., 2018) is one such quality observation tool that has been developed for STEM research and practice with funding from the Na-tional Science Foundation (NSF), with partners from Edu-cational Testing Service (ETS) and Project Liftoff, and with guidance from leading informal science frameworks from the NSF and National Research Council (Friedman,2008; National Research Council, 2009). DoS was validated to measure key indicators of afterschool STEM quality, in-cluding domains focused on STEM knowledge and
practices (e.g., inquiry, content learning, reflection) and positive youth development related to STEM (e.g., relevance, relationships, youth voice) among others (Shah et al.,2018).
There are no studies, to our knowledge, that have ex-amined the relationship between STEM program quality and youth outcomes in afterschool. However, theories of afterschool skill development and transfer suggest that high quality facilitation and content increases youth en-gagement (Fredricks et al., 2017). Additionally, for gen-eral (non-STEM) programs, higher afterschool program quality, measured using the Opportunities for Youth Agency subscale of the YPQA, was significantly related to higher levels of youth engagement at the end of pro-gram (Naftzger et al.,2018). Another recent study found that general afterschool program quality is related to positive outcomes such as pro-social behavior, intrinsic motivation, and concentration (Vandell,2013).
Research significance and aims
This research builds upon existing studies and expands the scope and scale of research on STEM program quality and youth outcomes in several ways, including by increasing the generalizability of the findings with a representative sample of states, using tools validated in afterschool settings that measure indicators relevant to both STEM and youth de-velopment, and assessing STEM program quality and youth outcomes concurrently in the same sample of programs. The selection of a program quality tool took into consider-ation the availability of a validated, STEM-specific program observation tool that is in wide use across the system-building states—in this case, the DoS observation tool (Shah et al.,2018). The selection of a youth self-report sur-vey took into consideration existing peer-reviewed litera-ture as well as input from state networks and practitioners regarding outcomes that align with current programmatic goals and outcomes that are relevant across different types of STEM programming. With this in mind, the survey chosen assessed five STEM attitudes (i.e., STEM engage-ment, career interest and knowledge, activity participant, and identity) and four SEL/twenty-first-century skills (i.e., perseverance, critical thinking, relationships with adults, and relationships with peers) that are associated with suc-cess in STEM, both academically and professionally—and in this case, the survey was the Common Instrument Suite for Students (CIS-S, Little et al.,2019; Noam, Allen, Shah, & Triggs,2017; Sneider & Noam,2019).
attitudes relate to SEL/twenty-first-century skills that have been identified by employers as important for workforce success; and (4) how the quality of STEM activities relate to youth outcomes. Because the emphasis of the after-school and STEM system-building initiative was on train-ing and resources for programs and educators to improve the quality of STEM activities and because studies have linked general program quality with other positive out-comes among youth (Naftzger et al.,2018; Vandell,2013), we hypothesized that participation in STEM-focused afterschool programs observed to have the highest levels of STEM quality would report the most gains in STEM at-titudes and SEL/twenty-first-century skills. Additionally, because youth development philosophy is deeply embed-ded in afterschool programming, and because prior work has found connections between general program quality and youth agency (Naftzger et al.,2018), we hypothesized that the majority of programs would excel in youth development-related dimensions of quality, such as rela-tionships and youth voice, and that there would be signifi-cant correlations between youth self-reported STEM attitudes and SEL/twenty-first-century skills.
Methods
This section describes the participants, measures, proced-ure, and data analyses used to examine national trends in youth outcomes, STEM program quality, and the connec-tions between observation and survey data collected across 11 state system-building networks.
Participants Programs
A total of 158 STEM-focused afterschool programs par-ticipated in the study (see Table 1 and the “Procedure” section for state selection). The programs represented a variety of settings, including school-based (69.8%), community-based (28.2%), or other (2.0%), and program size ranged widely between three and 80 students (with an average of approximately 14 and a median of 20) based on the number of students observed participating in STEM activities. STEM facilitators had an average of 15.5 years of experience (a median of 8 years) working with students in afterschool settings, and more than half (64.2%) had a college or graduate school degree. About one-half identified as belonging to groups traditionally underrepresented in STEM, specifically African Ameri-can/Black (13.5%) and Latino/a or Hispanic (38.5%). Pro-grams reported using diverse types of STEM curriculum or no curriculum at all—with answers ranging from very specific to broad in nature. Programs received varying levels of support from their network, such as coaching, training, technical assistance, and evaluation to support STEM teaching and learning, but the levels of support were not quantified.
Students
Data were collected from a total sample of 1599 students (45.8% female) in grades 4 to 12 who participated in an afterschool program that received support from one of
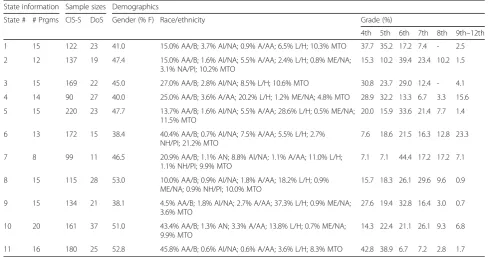
Table 1Student demographics and sample sizes within the 11 state networks
State information Sample sizes Demographics
State # # Prgms CIS-S DoS Gender (% F) Race/ethnicity Grade (%)
4th 5th 6th 7th 8th 9th–12th
1 15 122 23 41.0 15.0% AA/B; 3.7% AI/NA; 0.9% A/AA; 6.5% L/H; 10.3% MTO 37.7 35.2 17.2 7.4 - 2.5
2 12 137 19 47.4 15.0% AA/B; 1.6% AI/NA; 5.5% A/AA; 2.4% L/H; 0.8% ME/NA; 3.1% NA/PI; 10.2% MTO
15.3 10.2 39.4 23.4 10.2 1.5
3 15 169 22 45.0 27.0% AA/B; 2.8% AI/NA; 8.5% L/H; 10.6% MTO 30.8 23.7 29.0 12.4 - 4.1
4 14 90 27 40.0 25.0% AA/B; 3.6% A/AA; 20.2% L/H; 1.2% ME/NA; 4.8% MTO 28.9 32.2 13.3 6.7 3.3 15.6
5 15 220 23 47.7 13.7% AA/B; 1.6% AI/NA; 5.5% A/AA; 28.6% L/H; 0.5% ME/NA; 11.5% MTO
20.0 15.9 33.6 21.4 7.7 1.4
6 13 172 15 38.4 40.4% AA/B; 0.7% AI/NA; 7.5% A/AA; 5.5% L/H; 2.7% NH/PI; 21.2% MTO
7.6 18.6 21.5 16.3 12.8 23.3
7 8 99 11 46.5 20.9% AA/B; 1.1% AN; 8.8% AI/NA; 1.1% A/AA; 11.0% L/H; 1.1% NH/PI; 9.9% MTO
7.1 7.1 44.4 17.2 17.2 7.1
8 15 115 28 53.0 10.0% AA/B; 0.9% AI/NA; 1.8% A/AA; 18.2% L/H; 0.9% ME/NA; 0.9% NH/PI; 10.0% MTO
15.7 18.3 26.1 29.6 9.6 0.9
9 15 134 21 38.1 4.5% AA/B; 1.8% AI/NA; 2.7% A/AA; 37.3% L/H; 0.9% ME/NA; 3.6% MTO
27.6 19.4 32.8 16.4 3.0 0.7
10 20 161 37 51.0 43.4% AA/B; 1.3% AN; 3.3% A/AA; 13.8% L/H; 0.7% ME/NA; 9.9% MTO
14.3 22.4 21.1 26.1 9.3 6.8
11 16 180 25 52.8 45.8% AA/B; 0.6% AI/NA; 0.6% A/AA; 3.6% L/H; 8.3% MTO 42.8 38.9 6.7 7.2 2.8 1.7
Note:PrgmsPrograms,AA/BAfrican American/Black,AI/NAAmerican Indian/Native American,A/AAAsian/Asian American,ANAlaskan Native,L/HLatino/Hispanic,
the 11 state afterschool networks (see Table 1 and the
“Procedure” section for state selection). Given that most programs served elementary and middle school students, high school students were combined to form a single group (grades 9–12). The sample was diverse and included groups that are historically underrepresented in STEM (Table 1). Across all 11 state networks, students identified as African American/Black (25.05%), Alaska Na-tive (0.21%), American Indian/NaNa-tive American (1.83%), Asian/Asian American (3.11%), Latino/a or Hispanic (13.90%), Middle Eastern/North African (0.42%), Native Hawaiian or other Pacific Islander (0.71%), White/Cauca-sian (29.9%), or “more than one group” (10.44%). About tenth of students preferred not to answer. About one-third of students (29.9%) reported speaking a language other than English at home. More than 60% of students reported participating in STEM programming for 4 weeks or longer. Based on the expected program enrollment pro-vided by program directors, we estimate that approxi-mately 16% of students opted out of assessment or were not present the day of assessment.
Measures
Common Instrument Suite—Student (CIS-S)
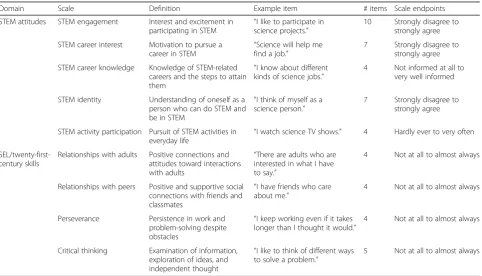
The CIS-S is a student self-report measure of five STEM attitudes and four SEL/twenty-first-century skills (see Table 2). Scales range from 5 to 10 items, but the
number of items completed by students were reduced using a planned missing data design (see Table 2 and the “Procedure” section, below). While many of the items on the CIS-S give emphasis to general science, we report results as STEM outcomes broadly because the survey includes items that address all four domains that make up STEM and most programs facilitate activities that incorporate elements from two, three, or all four STEM domains. For example,“I am curious about… sci-ence,” “I am curious about…technology,” “I am curious about…engineering,” or “I am curious about…math.” The conceptualization and psychometric properties of this survey are described below. Additionally, scale definitions, item examples, number of items, and scale endpoints are described in Table2.
Conceptualization of CIS-S scales STEM engagement.
This construct was measured using the Common In-strument, a validated self-report survey of STEM en-gagement that was developed in partnership with researchers and practitioners in the informal STEM education field (Little et al., 2019; Martinez et al., 2014; Noam et al.,2017; Sneider & Noam,2019). This scale captures three aspects of engagement: behavioral (e.g., participating or involving oneself in STEM activities or projects), cognitive (e.g., to be drawn to understanding, observing, or figuring out STEM phenomena), and
Table 2Domains, scales, definitions, and item examples for the common instrument suite—student survey
Domain Scale Definition Example item # items Scale endpoints
STEM attitudes STEM engagement Interest and excitement in participating in STEM “
I like to participate in science projects.”
10 Strongly disagree to strongly agree
STEM career interest Motivation to pursue a career in STEM
“Science will help me find a job.”
7 Strongly disagree to strongly agree
STEM career knowledge Knowledge of STEM-related careers and the steps to attain them
“I know about different kinds of science jobs.”
4 Not informed at all to very well informed
STEM identity Understanding of oneself as a person who can do STEM and be in STEM
“I think of myself as a science person.”
7 Strongly disagree to strongly agree
STEM activity participation Pursuit of STEM activities in
everyday life “
I watch science TV shows.” 4 Hardly ever to very often
SEL/twenty-first-century skills
Relationships with adults Positive connections and attitudes toward interactions with adults
“There are adults who are interested in what I have to say.”
4 Not at all to almost always
Relationships with peers Positive and supportive social connections with friends and classmates
“I have friends who care about me.”
4 Not at all to almost always
Perseverance Persistence in work and problem-solving despite obstacles
“I keep working even if it takes longer than I thought it would.”
4 Not at all to almost always
Critical thinking Examination of information, exploration of ideas, and independent thought
“I like to think of different ways to solve a problem.”
5 Not at all to almost always
emotional (e.g., feeling a sense of excitement about, and enjoyment of, STEM). Cronbach’s alpha for this scale, among the group of students in the current study, was .928 for the retrospective pretest and .934 for the retrospective posttest.
STEM identity. Items to capture STEM identity were adapted from previously published surveys of math and science identity and focus on students’ recognition of their role in STEM and students’ confidence to do STEM (Aschbacher et al.,2014; Cribbs et al.,2015). The concepts of recognition and competence draw on exten-sive sociological and psychological literature regarding the development of one’s sense of self. Briefly, recogni-tion refers to how youth view themselves in relarecogni-tion to STEM as well as how they feel they are viewed by others (i.e., their parents, teachers, or friends) in relation to STEM. Competence refers to how well youth feel they can do and succeed in STEM or how they feel others view their ability to do and succeed in STEM. Cron-bach’s alpha for this scale, among the group of students in the current study, was .912 for the retrospective pre-test and .910 for the retrospective postpre-test.
STEM career interest, career knowledge, and activity participation. Items for these scales were based on the 2006 Programme for International Student Assessment (PISA) survey (OECD,2007), a rigorous and comprehen-sive assessment that reports a high degree of reliability and validity. Adaptations of the scales were made to ad-dress concerns about reading comprehension levels, given that the PISA survey was originally designed for youth age 15. The three scales were conceptualized to capture students’ participation in STEM-related activ-ities (STEM activity participation) and students’intrinsic and instrumental motivation to learn STEM, which refer to the joy gained from the idea of pursuing STEM ca-reers and the drive to pursue STEM caca-reers or activities in everyday life based on their perceived usefulness and importance (STEM career interest and know-ledge, respectively) (OECD, 2014). Cronbach’s alpha for these three PISA-adapted scales, among the group of students in the current study, ranged from .805 to .860 for the retrospective pretest and .810 to .865 for the retrospective posttest.
SEL/twenty-first-century skills. Critical thinking, per-severance, relationships with adults, and relationships with peers are part of a longer assessment of SEL skills known as the Holistic Student Assessment, a validated survey that is primarily used in educational settings (Malti, Zuffianò, & Noam, 2017; Noam, Malti, & Guhn, 2012). These four skills, which overlap in the STEM and youth development literature, apply to a broad array of personal, academic, and work situations (Afterschool Al-liance, 2017; Lyon, Jafri, & St. Louis,2012). Specifically, STEM learning often demands persistence through trial
and error (perseverance), and youths’ resilience in the face of failure is thought to be associated with greater confidence in one’s own STEM ability as well as greater motivation to act in the pursuit of STEM-related aca-demic and career goals (Graham et al.,2013). Addition-ally, STEM learning requires youths to respond to a variety of tasks, questions, problems, or challenges (i.e., evaluating theories, conducting investigations, forming hypotheses, and interpreting results) that require flexible thinking and creativity (critical thinking). Lastly, building a STEM identity and developing personal meaning with STEM are influenced by the availability and quality of relationships with mentors, teachers, facilitators, and role models (relationships with adults) as well as friends or teams of youth (relationships with peers) (Robnett & Leaper, 2013; Tyler-Wood, Ellison, Lim, & Periathiru-vadi, 2012). Cronbach’s alpha for these four scales, among the group of students in this study, ranged from .801 to .914 for the retrospective pretest and .807 to .903 for the retrospective posttest.
Previous psychometric work on the CIS-S The
psy-chometric properties of the five STEM attitudes and four SEL/twenty-first-century skills, administered in retrospective format, were tested in two separate stud-ies conducted by Price (2018a, b). For both studies, confirmatory factor analytic techniques within a SEM model were used to verify that scale items display ac-ceptable fit (i.e., evidence of construct validity). Fit statis-tics used for evaluation of the quality of confirmatory factor model results included the model chi-square statistic, degrees of freedom and p value, the root mean square error of approximation (RMSEA) and its 90% confidence interval, and the comparative fit index (CFI). The criteria for judging the quality of the fac-tor analytic results were a RMSEA of .08 or smaller (a value of zero is best) and a CFI of .93 or higher (maximum possible value is 1.0).
Each of the five STEM attitudes were analyzed based on separate random samples of students participating in afterschool STEM programming across four regions of
the US (STEM engagement, n= 2100; STEM career
Each of the four SEL/twenty-first-century skills were an-alyzed using similar methods described above and were specifically based on one random stratified sample of stu-dents participating in school and afterschool programs across four regions of the US that were not necessarily STEM-focused (n= 12,000 for critical thinking, persever-ance, relationships with adults, and relationships with peers). The sample for the four scales was similar to the present study sample: youth ages 9 to 19, approximately 52% female, and demographically diverse, with more than half of the sample identifying as youth of color. Similar to the STEM scales above, the results for the four SEL/ twenty-first-century skills demonstrated good model fit. Internal consistency reliability estimates (coefficient alpha) ranged between 0.74 and 0.85 across sex and age groups, and there were excellent item-total correlation statistics revealing that the items adequately explained parts of the construct as intended (Price,2018b).
Dimensions of success (DoS)
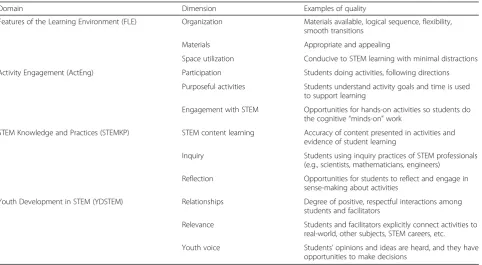
DoS is an observation tool used to assess the quality of in-formal STEM programming, including afterschool and summer programs (Shah et al., 2018). The tool captures 12 dimensions of STEM program quality that are catego-rized into the four domains conceptualized by Shah et al. (2018) (see Table3and the“Conceptualization of DoS do-mains”section, below). Rigorous training and certification are required to perform DoS observations. Qualitative data from field notes are quantified by the observer using a standard rubric on a 4-point scale from low (1, evidence
absent) to high (4, compelling evidence). The criterion threshold for quality is a rating of 3 (reasonable evidence) out of 4 per dimension. The conceptualization of STEM program quality domains and the psychometric properties of this observation tool are described below.
Conceptualization of DoS domains The DoS
frame-work captures four domains of STEM program quality (see Table3), specifically the following:
The Features of the Learning Environment (FLE)
do-main captures the logistics and preparation of an activ-ity, whether the materials are appealing and appropriate, and how the learning environment creates a suitable space for informal STEM learning.
The Activity Engagement (ActEng) domain requires ob-servers to describe how the activity engages students. For example, the dimensions examine whether or not all stu-dents have access to the activity, whether activities are mov-ing toward STEM concepts and practices purposefully or superficially, and whether or not the activities are hands-on and designed to support students to think for themselves.
The STEM Knowledge and Practices (STEMKP)
do-main defines how informal STEM activities are helping youth understand STEM concepts, make connections, and participate in the inquiry practices that STEM pro-fessionals use, and determines whether students have time to make meaning and reflect on their experiences.
The Youth Development in STEM (YDSTEM) domain
assesses how student-facilitator and student-student inter-actions encourage or discourage participation in STEM
Table 3Domains, dimensions, and definitions of quality STEM programming for the Dimensions of Success (DoS) observation tool
Domain Dimension Examples of quality
Features of the Learning Environment (FLE) Organization Materials available, logical sequence, flexibility, smooth transitions
Materials Appropriate and appealing
Space utilization Conducive to STEM learning with minimal distractions
Activity Engagement (ActEng) Participation Students doing activities, following directions
Purposeful activities Students understand activity goals and time is used to support learning
Engagement with STEM Opportunities for hands-on activities so students do the cognitive“minds-on”work
STEM Knowledge and Practices (STEMKP) STEM content learning Accuracy of content presented in activities and evidence of student learning
Inquiry Students using inquiry practices of STEM professionals (e.g., scientists, mathematicians, engineers)
Reflection Opportunities for students to reflect and engage in sense-making about activities
Youth Development in STEM (YDSTEM) Relationships Degree of positive, respectful interactions among students and facilitators
Relevance Students and facilitators explicitly connect activities to real-world, other subjects, STEM careers, etc.
activities, whether or not the activities make STEM rele-vant and meaningful to students’everyday lives, and how the interactions allow youth to make decisions and have a voice in the learning environment and community.
Previous psychometric work on DoS The
psychomet-ric properties of DoS were tested in two separate studies (Shah et al., 2018). For both studies, the validity argu-ment was tested by examining the descriptive statistics to determine the use of the full scoring scale, internal consistency as measured by Cohen’s kappa and inter-rater agreement levels between observer pairs scoring the same activity, and factor analysis to examine the factor structure of the 12 DoS dimensions, and a prelim-inary G-study analysis. Study 1 consisted of 284 observa-tions of STEM activities conducted by 38 observers at 60 afterschool programs located in two US regions (i.e., Midwest, Northeast). Study 2 consisted of 54 observa-tions of STEM activities conducted by 17 observers at 32 summer programs located in two US regions (i.e., Midwest, Northeast). Results found the inter-rater agree-ment for the twelve dimensions had Cohen’s kappas ran-ging from .73 to .94 and percentage agreement ranran-ging from 95 to 100% based on the current training and cer-tification methods (Shah et al.,2018). Previous psycho-metric analyses have found DoS to have similar, and sometimes stronger, levels of agreement between raters than the agreement levels reported for observation tools used in studies in formal settings (Bell et al.,2014; Shah et al.,2018).
Procedure
State network and program selection
A total of 11 state afterschool networks were chosen to participate in this study based on the following: (1) the collection of participating states together reflect the demographic diversity of the US, including rural, subur-ban, and urban composition; (2) the state afterschool networks receive system-building support from the two funders, and (3) the state afterschool networks demon-strate prior experience and capacity to implement a large-scale and complex study within the designated study time frame of 12 weeks. At the time of this study, a total of 17 system-building networks were available for selection, and 11 networks were chosen based on re-gional representation and readiness and capacity to par-ticipate. An expert demographer served as consultant to inform on the choice of states to ensure the representa-tiveness of the sample.
Leaders from each of the 11 state afterschool networks (see Table 1) consulted with the researchers to choose 15 afterschool STEM education programs that best rep-resent the afterschool universe in their state, ensuring a variety of curricular offerings that are taught in different
settings (e.g., school-based, community-based, or other), that range in level of formality, and that represent differ-ent demographics including age and race/ethnicity. The researchers provided program selection guidelines to networks to assist in the recruitment process. More than 80% of programs reported four or more STEM sessions per month, and most programs were ongoing through-out the academic year (August/September–May/June).
Assessment administration
The student assessment (CIS-S) was created using the Qualtrics platform and administered electronically using Wi-Fi-enabled tablets or computers during the last week of STEM programming. Programs were provided with a weblink and a unique set of identification numbers to ensure that all data were de-identified. Participation was voluntary and anonymous.
The CIS-S was completed in group settings and under careful adult supervision. Administration took approxi-mately 15 min. All attitudinal items on the student as-sessment were in retrospective pretest-posttest format (Little et al., 2019), and students’ responses were re-corded using a visual analog scale (VAS), a continuous scale of measurement. Each scale ranged from 0 (strongly disagree) to 99 (strongly agree), with a score of 49 representing the midpoint (neutral). Respondents were asked to rate each assessment item twice from two different frames of reference: first to consider how they would respond to each item “Before the program” and then to respond how they feel right now,“At this time.” Students were provided with instructions and practice items at the start of the assessment. To help prime retrospective thinking, a calendar image was presented in the instruction block. This design is like the trad-itional pretest-posttest method in that change is calcu-lated by subtracting ratings for “Before the program” from“At this time.” To minimize assessment length for the students and to maximize the quality of data, a 10-form planned missing data (PMD) design was used. A PMD design accounts for the reason why data are miss-ing and allows for the incomplete data to be easily re-covered through multiple imputation (Little, Jorgensen, Lang, & Moore,2014).
Quality observations
partnering with state networks were typically evaluators; the researchers were not involved in scheduling or observ-ing programs across states but provided trainobserv-ing and certifi-cation and consulted with networks to ensure fidelity to study design and observation guidelines. Observations were conducted on one to two occasions toward the middle to end of programming, depending on each program’s STEM activity schedule and the ability of observers to commute to programs located across each state. Certified observers re-corded field notes describing evidence of STEM learning during STEM activities for a minimum of 30 min (a max-imum of 120 min, depending on activity length). Field notes and quantitative ratings for each program were submitted by observers electronically using an online form, which were reviewed by researchers to ensure the data met the standards set by the research team (i.e., individuals submit-ting observations were currently certified, evidence for each dimension of quality was described with sufficient detail, quantitative rating assigned for each dimension was sup-ported by qualitative evidence provided).
Ethical approval
All procedures were reviewed and approved by the insti-tutional review boards at our research institutions.
Data analysis
To quantify change in students’ attitudes from “Before the program” (retrospective pretest) to “At this time” (retrospective posttest), repeated-measures analysis of variance (ANOVA) tests were conducted using the retrospective pretest scores and posttest scores for the CIS-S as within-subjects factors and state, gender, grade, race/ethnicity, program duration, and community type (i.e., rural, urban, suburban) as between-subject factors. For race and ethnicity analyses, we used the survey cat-egories African American/Black, Asian/Asian American, Latino/a or Hispanic, and White/Caucasian (non-His-panic) and collapsed the remaining six categories into one that we labeled Other (see the “Students” section. Additionally, correlational analyses of CIS-S scales were performed using Pearson’s correlation coefficient to examine the relationship between the five scales measur-ing STEM attitudes and the four scales measurmeasur-ing SEL/ twenty-first-century skills.
To examine the relationship between student outcomes (CIS-S) and STEM program quality (DoS), the Kruskal-Wallis test was used as a one-way test of variance to com-pare the nine CIS-S scales across three levels of program quality (i.e., higher, average, and lower). Levels of STEM program quality were calculated based on a composite DoS score (i.e., sum of 12 dimension ratings of STEM quality across four domains, for each observation) and a domain score (i.e., sum of three dimension ratings of STEM quality per domain, for each observation). Composite scores were
converted toz-scores using a standardization sample repre-sentative of US STEM-focused afterschool programs that were observed using validated methods (n= 354 observa-tions performed between 2013 and 2016) (Shah et al., 2018), and programs receiving scores that were one stand-ard deviation above or below the standstand-ardization mean were designated as “higher quality” or “lower quality,” respectively. The remaining scores within one standard deviation of the standardization mean were considered as
“average quality.” Note that program quality was catego-rized into three levels to assist state network leads, practi-tioners, and researchers interpret overall STEM program quality using a composite score (i.e., sum across all 12 dimensions) for research, evaluation, and continuous improvement purposes. Comparing local- and state-level results to current national-level data is important for un-derstanding how programs are performing relative to others and also for identifying where the field is succeeding and where it needs to improve.
For all analyses, alpha was defined as p< 0.005 given the sensitivity of pvalues to large sample sizes. Post hoc analyses were performed using Tukey’s honestly signifi-cant difference (HSD) test or Mann-Whitney Utests, as appropriate. Effect sizes were calculated using Cohen’sd or partial eta squaredðη2PÞ, as appropriate.
Results
This section describes the results for student out-comes, STEM program quality, the connections be-tween student outcomes and STEM program quality, and the relationships between students’ STEM attitudes and SEL/twenty-first-century skills.
Student outcomes
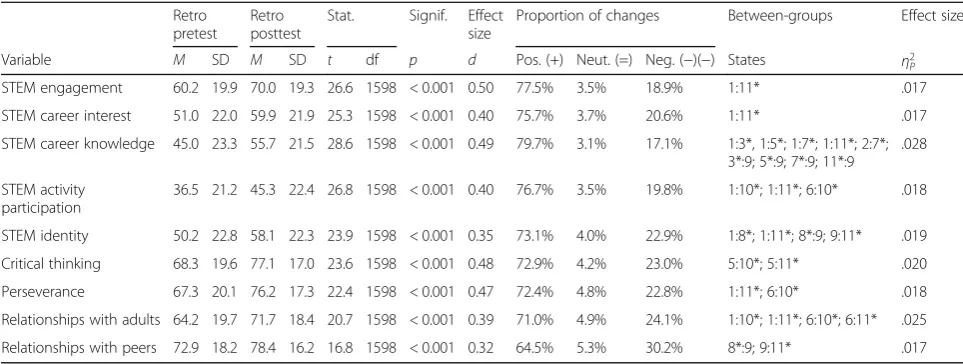
In the following section, we report the findings across the nine core CIS-S scales. Table4summarizes the results for the nine core CIS-S constructs across the 11 states.
Overall student-reported changes
STEM attitudes Youth who participated in STEM
programs reported increases in all five STEM attitudes, including STEM engagement, career interest, career knowledge, activity participation, and identity (see Table 4, allp’s < 0.001).
SEL/twenty-first-century skills Youth who participated
Student group comparisons
Gender There was a main effect of gender on
self-re-ported relationships. Female students reself-re-ported higher quality of relationships with adults (F(1,1) = 39.06,p< 0.001) and re-lationships with peers (F(1,1) = 60.37, p< 0.001) compared to male students. The effect size for the effect of gender on relationships was small (η2P=0.004).
Grade Grade was not a significant factor for any of the
CIS-S outcomes. There were no significant gender by grade interactions detected (n.s., allp’s > 0.05).
Race and ethnicity There was a main effect of race and
ethnicity for several outcomes, including four STEM attitudes—STEM engagement (F(1,4) = 6.87, p< 0.001,
ƞ2
= 0.008), career interest (F(1,4) = 11.63, p< 0.001,
ƞ2
= 0.014), career knowledge (F(1,4) = 15.12, p< 0.001,
ƞ2
= 0.018), and STEM identity (F(1,4) = 17.92, p< .001,
ƞ2
= 0.021)—and two SEL/twenty-first-century skills— critical thinking (F(1,4) = 9.37, p< 0.001,ƞ2= 0.011) and relationships with adults (F(1,4) = 7.01, p< 0.001, ƞ2= 0.008). Post hoc analyses indicated that Latino/a or Hispanic youth rated change in STEM career interest, career knowledge, identity, and perseverance signifi-cantly higher than students from all other demographic groups (allp’s < 0.001). Additionally, Latino/a or Hispanic students rated change in STEM engagement and critical thinking significantly higher than African American/Black and White/Caucasian students.
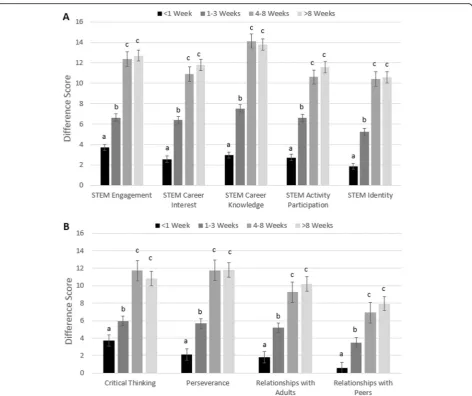
Program duration There was a main effect of
self-reported program duration (i.e., less than 1 week,n= 310; 1–3 weeks, n= 272; 4–8 weeks, n= 346; greater than 8
weeks, n= 670) for all nine outcomes, including all five STEM attitudes—STEM engagement (F(1,3) = 51.31, p< 0.001, η2
P = 0.088), STEM career interest (F(1,3) = 56.51, p< 0.001, η2
P = 0.096), STEM career knowledge (F(1,3) = 71.73, p< 0.001, η2
P = 0.119), STEM activity participation (F(1,3) = 49.61,p< 0.001, η2P = 0.085), and STEM identity (F(1,3) = 57.71, p< 0.001, ƞ2= 0.098)— and all four SEL/twenty-first-century skills—critical thinking (F(1,3) = 29.66, p< 0.001, η2
P = 0.053), perse-verance (F(1,3) = 35.33, p< 0.001, η2
P = 0.062), relation-ships with adults (F(1,3) = 33.90, p< 0.001, η2P = 0.06), and relationships with peers (F(1,3) = 27.58, p< 0.001,
η2
P = 0.049) (see Fig.1). Students participating in STEM activities for four or more weeks rated change in all outcomes significantly higher than students participating for 3 weeks or less. Students participating for 1–3 weeks rated change in all outcomes significantly higher than stu-dents participating for less than 1 week, but there were no differences between students participating for 4–8 weeks and 8 weeks or more. Program duration contributed to approximately 8% of the known variance in retrospective posttest scores across all student outcomes, with the lar-gest effects found among students participating for 4–8 weeks and 8 weeks or more.
StateThere was a main effect of state for all nine scales,
including STEM engagement (F(1,10) = 6.21, p< 0.001), career knowledge (F(1,10) = 12.1,p< 0.001), career interest (F(1,10) = 6.85, p< 0.001), activity participation (F(1,10) = 4.48, p< 0.001), identity (F(1, 10) = 7.94, p< 0.001), critical thinking (F(1,10) = 4.17,p< 0.001), perseverance (F(1,10) = 4.07, p< 0.001), relationships with adults (F(1,10) = 6.25, p< 0.001), and relationships with peers (F(1,10) = 3.54,
Table 4Mean (± SD) change in retrospective pretest-posttest ratings for nine CIS-S scales with between-state comparisons
Retro pretest
Retro posttest
Stat. Signif. Effect size
Proportion of changes Between-groups Effect size
Variable M SD M SD t df p d Pos. (+) Neut. (=) Neg. (−)(−) States η2 P
STEM engagement 60.2 19.9 70.0 19.3 26.6 1598 < 0.001 0.50 77.5% 3.5% 18.9% 1:11* .017
STEM career interest 51.0 22.0 59.9 21.9 25.3 1598 < 0.001 0.40 75.7% 3.7% 20.6% 1:11* .017
STEM career knowledge 45.0 23.3 55.7 21.5 28.6 1598 < 0.001 0.49 79.7% 3.1% 17.1% 1:3*, 1:5*; 1:7*; 1:11*; 2:7*; 3*:9; 5*:9; 7*:9; 11*:9
.028
STEM activity participation
36.5 21.2 45.3 22.4 26.8 1598 < 0.001 0.40 76.7% 3.5% 19.8% 1:10*; 1:11*; 6:10* .018
STEM identity 50.2 22.8 58.1 22.3 23.9 1598 < 0.001 0.35 73.1% 4.0% 22.9% 1:8*; 1:11*; 8*:9; 9:11* .019
Critical thinking 68.3 19.6 77.1 17.0 23.6 1598 < 0.001 0.48 72.9% 4.2% 23.0% 5:10*; 5:11* .020
Perseverance 67.3 20.1 76.2 17.3 22.4 1598 < 0.001 0.47 72.4% 4.8% 22.8% 1:11*; 6:10* .018
Relationships with adults 64.2 19.7 71.7 18.4 20.7 1598 < 0.001 0.39 71.0% 4.9% 24.1% 1:10*; 1:11*; 6:10*; 6:11* .025
Relationships with peers 72.9 18.2 78.4 16.2 16.8 1598 < 0.001 0.32 64.5% 5.3% 30.2% 8*:9; 9:11* .017
p< 0.001) (see Table 4 for between-state post hoc re-sults and effect sizes, all p’s < 0.001). Effect size test-ing indicated that state characteristics contributed to 2% of the variance in retrospective posttest scores.
Program quality ratings Overall program quality
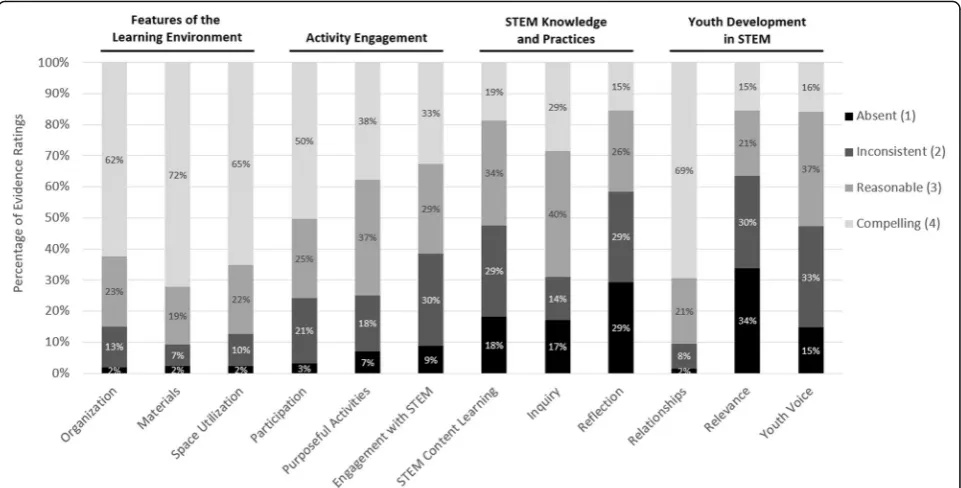
National strengths and challenges Based on observed
levels of STEM program quality across 11 state networks, afterschool programs exhibited more strengths than chal-lenges (see Fig. 2). There were statistically significant differences in quality ratings, on average, between the 12 dimensions assessed (χ2(11) = 938.60,p< 0.001). Specific-ally, afterschool programs most frequently demonstrated reasonable to compelling evidence of quality (i.e., a minimum rating of 3.0 per dimension) for the three di-mensions within the FLE domain (inclusive of the
organization, materials, and space utilization dimen-sions) and the relationships dimension within the YDSTEM domain. Dimensions that proved to be more challenging for programs (based on the percentage of ratings below 3.0), include the three dimensions within the STEMKP domain (STEM content learning, inquiry, reflection) and two dimensions with the YDSTEM domain (youth voice and relevance).
State comparisons There was a main effect of state
found for two dimensions of STEM program quality: STEM content learning (χ2(10) = 37.75, p< 0.001)—where State 6 exhibited higher quality than States 1, 2, 4, 9, and 11—and youth voice (χ2(10) = 28.80, p= 0.001)—where States 7, 8, and 11 exhibited higher quality than State 4. These analyses are exploratory, given there were 11 to 28 observations per state, and designed to generate hypotheses.
Fig. 1Mean (± SD) retrospective pretest-posttest difference scores for youth self-reportedaSTEM attitudes andbSEL/twenty-first-century skills
Benchmarking Overall, results showed that more than 82% of youth participated in afterschool programming that was determined to have overall average or higher levels of STEM program quality. Higher-quality pro-grams received an average rating of 3.67 ± 0.13 across the 12 dimensions, meaning the midpoint between reasonable to compelling levels of evidence (Table 5). Average quality programs received an average rating 2.99 ± 0.26, closely approximating reasonable evidence of quality. However, there was significant variation in the ratings that equated to average and lower program qual-ity by domain and by dimension (Table5). As shown in Fig.2 and Table5, programs more easily met the mini-mum standard of quality set by DoS (i.e., reasonable evidence, which equates to an average rating of 3.0 per dimension) for the FLE and ActEng domains and their associated dimensions. To be considered a higher-quality program in for FLE, a near perfect average score of 4.0 (out of 4.0) was required. However, it was more challenging for afterschool programs (both in this study sample and nationally) to meet the same standard for STEMKP and YDSTEM domains. For instance, average quality for FLE equated to an average dimension rating of 3.55 ± .55, about a half point difference above the 3.0 threshold. Conversely, average quality for STEMKP equated to an average dimension score of 2.57 ± .95, about a half point difference below the 3.0 threshold, indicating a need for more support in these STEMKP both locally and nationally.
Fig. 2Stacked bar chart showing proportion of segment-level scores for each dimension of the Dimensions of Success (DoS) observation tool.
Darker colors illustrate the pattern of challenges (lower-quality ratings, 1’s and 2’s) and lighter colors illustrate the pattern of strengths
(higher-quality ratings, 3’s and 4’s) across all observed programs and states
Table 5Mean (± SD) DoS ratings for STEM-focused afterschool
programs that equated to lower, average, or higher levels of STEM program quality by domain and by dimension
DoS domain Lower
quality
Average quality
Higher quality
Overall STEM program quality 2.17 ± 0.53 2.99 ± 0.26 3.67 ± 0.13
Features of the Learning Environment
2.68 ± 0.33 3.54 ± 0.25 4.00 ± 0.03
Organization 2.54 ± 0.64 3.41 ± 0.58 4.00 ± 0.01
Materials 3.00 ± 0.58 3.67 ± 0.48 4.00 ± 0.07
Space utilization 2.51 ± 0.64 3.55 ± .051 4.00 ± 0.02
Activity Engagement 2.00 ± 0.07 3.09 ± 0.36 3.95 ± 0.07
Participation 2.07 ± 0.40 3.25 ± 0.67 3.92 ± 0.18
Purposeful activities 2.13 ± 0.72 3.15 ± 0.55 4.00 ± 0.03
STEM engagement 1.79 ± 0.51 2.89 ± 0.69 3.95 ± 0.15
STEM Knowledge and Practices 1.48 ± 0.36 2.58 ± 0.41 3.51 ± 0.24
STEM content learning 1.49 ± 0.64 2.61 ± 0.78 3.57 ± 0.40
Inquiry 1.71 ± .052 2.94 ± 0.67 3.56 ± 0.51
Reflection 1.26 ± 0.37 2.20 ± 0.70 3.51 ± 0.46
Youth Development in STEM 1.83 ± 0.31 2.87 ± 0.35 3.73 ± 0.15
Relationships 2.35 ± 0.80 3.71 ± 0.49 4.00 ± 0.01
Relevance 1.35 ± 0.52 2.25 ± 0.85 3.54 ± 0.46
Youth voice 1.78 ± 0.58 2.66 ± 0.62 3.66 ± 0.39
Relationships within and across measures
Linking student STEM attitudes and twenty-first-century skills
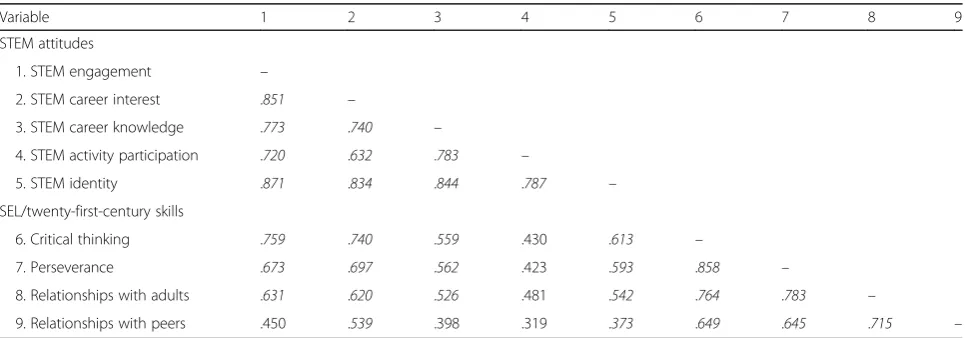
There were significant, moderate to strong, positive cor-relations between average ratings for all five STEM-related scales and the four SEL/twenty-first-century skills (all p’s < 0.001, see Table 6). All rvalues between all STEM-related outcomes and SEL/twenty-first-cen-tury skills (based upon retrospective posttest scores) ranged between 0.319 and 0.759, which represents a shared variance between the variables of 10.1% to 57.6%. Generally, SEL/twenty-first-century skills showed the highest correlations with STEM engagement and STEM career interest relative to other STEM-related scales, albeit the strength of correlations for all tended to be moderate to strong. The strongest correlation found be-tween STEM outcomes and SEL/twenty-first-century skills was between change in STEM engagement and change in critical thinking, (r(1597) = 0.759, p< 0.001, d= 2.33) (see Table6).
Linking STEM program quality and youth outcomes
Students attending programs observed to have higher levels of program quality reported significantly greater gains in all STEM-related attitudes, with the exception of STEM activity participation, and all SEL/twenty-first-cen-tury skills than students attending programs observed to have lower levels of program quality (see Table 7 for statistics, allp’s < 0.005). As shown in Table7, the largest effect sizes for overall program quality were found for STEM identity, career knowledge, relationships with adults, and perseverance, respectively, which were moder-ate in size according to Hattie (2012). We performed post hoc analyses for each of the four DoS domains separately to examine whether the relationships between quality and youth outcomes differ by domain. We found that FLE had the weakest effect on youth outcomes—with fewer
statistically significant differences found for the effect of this quality domain on youth outcomes—and STEMKP had the strongest effect on youth outcomes—with more statistically significant differences found for the effect of this quality domain on youth outcomes (Table 7). Program quality based on STEMKP alone also produced larger effect sizes than the other DoS domains. Notably, each of the four domains was necessary, but not sufficient, to detect statistically significant effects on youth out-comes. In other words, all four DoS domains (and all 12 dimensions) combined into one composite score resulted in the most robust differences across youth outcomes than any of the domains alone.
Discussion
This study of an afterschool and STEM system-building intervention served as a proof point of the capacity of the US afterschool field to implement an evidence-based approach on a national scale to inform STEM research and practice. Using a common set of assessments devel-oped collaboratively by researchers and practitioners, this study has the potential to advance the STEM educa-tion field’s current understanding of STEM program quality and outcomes in afterschool settings. The study contributed actionable results on local, state, and na-tional levels to influence policy and improve practice. State network leaders were provided with detailed re-ports with state- and program-level results within 3 months of this study’s conclusion. They have used their program quality and youth outcome data to identify key strengths and areas for improvement, to successfully obtain funding, and to advocate for state and national policy reform to promote best practices for STEM edu-cation and strengthen workforce development. The following sections expand upon key findings, which add to the published literature.
Table 6Correlations between STEM attitudes and SEL/twenty-first-century skills reported on CIS-S
Variable 1 2 3 4 5 6 7 8 9
STEM attitudes
1. STEM engagement –
2. STEM career interest .851 –
3. STEM career knowledge .773 .740 –
4. STEM activity participation .720 .632 .783 –
5. STEM identity .871 .834 .844 .787 –
SEL/twenty-first-century skills
6. Critical thinking .759 .740 .559 .430 .613 –
7. Perseverance .673 .697 .562 .423 .593 .858 –
8. Relationships with adults .631 .620 .526 .481 .542 .764 .783 –
9. Relationships with peers .450 .539 .398 .319 .373 .649 .645 .715 –
Table 7 Mean (± SD) change scores for youth self-reported outcomes (CIS-S) by STEM program quality level (DoS — overall score) Variabl e Qualit y levels Test statist ics Effect sizes — all dom ains and by individ ual dom ains Lower Average Hig her Stat . Signif. All dom ains FLE Ac tEng STE M K&P YD & STE M STEM attitudes M SD M SD M SD χ 2(2) pd [95% CI] d [95% CI] d [95% CI] d [95% CI] d [95% CI] STE M eng agemen t 7.71 a 14.90 8.76 a,b 13 .96 11 .20 b 15.85 11.81 0.003 0.23 [0.07 , 0.38] n.s.
0.06 [−
0.10 ,0.21] n.s. n.s. STE M caree r intere st 7.32 a 17.42 8.61 a,b 15 .35 11 .51 b 17.18 16.18 < 0.00 1 0.24 [0.08 , 0.40] n.s.
0.09 [−
0.06 ,0.25] 0.30 [0.15 ,0.44] 0.19 [0.02 ,0.36] STE M caree r know ledge 7.54 a 14.65 10.56 b 14 .51 13 .56 c 15.96 25.04 < 0.00 1 0.39 [0.23 , 0.55]
0.12 [−
0.02,0.26] 0.21 [0.06 ,0.37] 0.45 [0.31 ,0.60] 0.25 [0.08 ,0.42] STE M activ ity particip ation 8.47 12.86 8.45 12 .65 9. 94 14.42 2.56 0.278 n.s. n.s. n.s. n.s. n.s. STE M ident ity 5.08 a 13.56 7.61 b 12 .32 11 .01 c 14.79 32.38 < 0.00 1 0.42 [0.26 , 0.58] 0.18 [0.04,0.3 2] 0.27 [0.11 ,0.42] 0.39 [0.25 ,0.54] 0.27 [0.10 ,0.44] SEL/ twenty-first-c entury skills Critical thinki ng 7.69 a 15.30 8.71 a,b 14 .96 11 .49 b 16.55 12.26 0.002 0.24 [0.08 , 0.40] n.s.
0.11 [−
0.04 ,0.26] 0.20 [0.06 ,0.35] n.s. Perse veran ce 6.75 a 15.03 7.97 a 14 .95 11 .51 b 16.61 16.86 < 0.00 1 0.30 [0.14 , 0.46] 0.16 [0.02,0.3 0]
0.13 [−
0.02 ,0.28] n.s. n.s. Relat ionshi ps with adult s 4.93 a 13.99 7.42 a,b 14 .21 9. 71 b 15.40 17.18 < 0.00 1 0.32 [0.16 , 0.48] 0.18 [0.04,0.3 2]
0.13 [−
0.02 ,0.28] n.s. n.s. Relat ionshi ps with peers 3.48 a 12.96 5.35 a,b 12 .24 7. 53 b 15.22 12.06 0.002 0.28 [0.13 , 0.44] n.s.
0.13 [−
National trends in youth outcomes
Overall, our findings showed that all states exhibited sig-nificant, positive youth outcomes, with approximately 65–85% of students reporting significant gains in STEM attitudes and SEL/twenty-first-century skills across the 11 state afterschool networks. Five states showed large effects for two or more youth outcomes, and all states showed medium effects for one or more outcomes. We made this determination using the interpretation guide-lines provided by Hattie (2012), where an intervention has a medium effect when the d value is between 0.3 and 0.6 and a large effect when the d value is 0.6 and greater. State effects sizes ranged from small to large (d values ranging from .15 to .68 depending on outcome and state), which is expected given the diversity of states and programs and other uncontrolled factors, such as state networks being in different phases of system-building implementation or using different strategies for supporting and training programs.
There is anecdotal evidence from state leaders and technical assistance consultants that suggests the effect size patterns are consistent with our understanding of how states differed in their experience level, resources, focus, and implementation of the system-building inter-vention. However, further study is required to weigh the impact of specific system-building strategies on program quality dimensions and youth attitudes. Results may also be influenced by the demographic makeup of the study sample and other unobserved factors in youth, such as individual interests, abilities, education, opportunities, and background.
Gender and youth outcomes
Gender did not play a significant role in student STEM-related attitudes in the present study, which contrasts with many published findings showing that boys have significantly more positive STEM-related attitudes than girls (Desy, Peterson, & Brockman, 2011; Weinburgh, 1995). A possible reason for this could be that youth who participate in afterschool STEM programs are already a self-selected group based off their current interest in STEM (Vallett, Lamb, & Annetta, 2018). However, this finding is consistent with studies finding that men and women perceive similar educational bene-fits when participating in hands-on STEM-related expe-riences, such as undergraduate research experiences (Harsh, Maltese, & Tai, 2012; Lopatto, 2004; Russell, Hancock, & McCullough, 2007). Prior research has also found that participation in informal research experiences is more often a deciding factor to pursue an advance STEM degree for women than it is for men (Harsh et al., 2012), suggesting that afterschool may be another setting that narrows the gender gap in STEM achievement and career outcomes.
There was a small but significant effect of gender on students’perceived quality of relationships with adults and peers. Compared to male students, female students re-ported higher-quality relationships with peers and adults at both the beginning and end of programming. This find-ing is consistent with literature describfind-ing gender differ-ences in perceived quality of relationships (Fabes et al., 2014). However, more research is needed to understand how gender differences in perceptions may influence afterschool program dynamics or future academic and career success, especially in STEM fields.
Grade level and youth outcomes
An examination of student outcomes by grade level indi-cated that there were no differences in STEM attitudes and SEL/twenty-first-century skills based on year in school between grades 4 to 12. Again, it is possible that the lack of grade differences is related to the self-selected nature of most afterschool programs; youth in the present study may have developed a stronger interest and identity in STEM than other youth who self-selected into other types of programming (Vallett et al., 2018). However, evidence in the literature is mixed; there are examples of studies conducted in school settings that re-port a decline in STEM interest and motivation from elementary school to high school (Potvin & Hasni,2014; VanLeuvan, 2004), and there are also examples of stud-ies conducted in afterschool program settings that sug-gest that consistent participation in STEM activities buffer against a decline in STEM interest and motivation over time (Chittum et al., 2017). Further work is needed to examine attitudes longitudinally and between differ-ent learning settings (e.g., informal and formal learning settings) to understand the influence of afterschool on various STEM attitudes.
Race and ethnicity and youth outcomes
attended community-based afterschool programing had developed stronger ethnic identities as well as better concentration and emotion regulation skills than Latino/ a youth who did not regularly attend. However, there is a need for more in-depth studies on how afterschool STEM specifically supports specific racial and ethnic groups that are often underrepresented in the literature and in the STEM fields.
National Trends in STEM program quality and participation
Observations of STEM program quality indicated that programs excel in creating positive and supportive infor-mal learning environments with well-prepared activities and fun and engaging materials. However, about 30– 50% of programs need more support to help youth understand STEM concepts, make connections, and par-ticipate in inquiry practices. In addition to the quality of STEM activities, the length of time that youth engage in programming was an important factor that significantly influenced outcomes. The present data indicated that a minimum of 1 h of STEM per week for 4 weeks or longer positively and significantly influenced students’ STEM-related attitudes and SEL/twenty-first-century skills. Taken together, these findings underscore the importance of both quality and duration in the design of STEM programming (Fredricks et al.,2017).
Linking STEM program quality and youth outcomes
Importantly, this study provides evidence to substantiate the linkage between program quality and student out-comes and also underscores the importance of focusing on quality improvement to enhance student learning experiences. Specifically, students participating in higher-quality programming, relative to peers participating in lower-quality programs, reported feeling more positive about STEM because of their afterschool experience— in-cluding being more excited about STEM and innovation, more interested in pursuing STEM careers, and more knowledgeable about what careers exist and the steps to obtain them.
The STEM Knowledge and Practices domain had the strongest effect on STEM attitudes and SEL/twenty-first-century skills reported by students. In other words, while a lower-quality rating in any of the four domains was asso-ciated with less positive outcomes among students, this effect was much more substantial for programs with lower-quality ratings in the STEM Knowledge and Prac-tices domain. However, this DoS domain has proven to be the most challenging for afterschool STEM programs to master, which underscores the need for further professional development in STEM content learning, inquiry, and reflection (Shah et al., 2018). The present findings suggest that helping students grapple with STEM concepts, practices, and knowledge in a meaningful way
can significantly improve important outcomes including STEM identity, career interest and motivation, persever-ance, and quality of relationships.
Connections between STEM attitudes and SEL/twenty-first-century skills
One other notable finding was the convergence between STEM attitudes and SEL/twenty-first-century skills, under-scoring how the integration of a youth development focus may enhance STEM learning and engagement, and vice versa. There is growing evidence and consensus that there is a natural integration between STEM and SEL/twenty-first-century skills that can enhance the depth and quality of learning overall (Afterschool Alliance,2017; Lyon et al., 2012). However, few studies in school and afterschool/ OST settings have explicitly and intentionally studied the potential synergy between SEL/twenty-first-century skills and STEM learning, underscoring a promising avenue for future afterschool STEM research to map the landscape and build the evidential foundation (The Aspen Institute & Boston Consulting Group,2018).
Limitations and future directions
Research studies in the afterschool field are subject to many challenges, such as the many sources of variation that are difficult to measure or control. There are differ-ences in learning settings, programming focus, curricu-lum usage, implementation capacity and strategy, and membership, to name a few (Halpern, 2006). These challenges make it difficult for the afterschool field to conduct research, provide evidence of effectiveness, and parcel out factors that influence cause and effect. This study is not without its own limitations, which are discussed below along with its strengths and directions for future research.
First, the national scope of the work, albeit a strength in terms of representativeness of the sample, introduces many sources of variability when considering regional, demographic, cultural, political, organizational, strategic, and programmatic differences across the US. While the measurement tools used in the present study were sensi-tive to individual-, local-, and state-level differences in program quality and outcomes, additional study is needed to understand why differences were found and how the re-sults might differ across learning settings. Future studies are needed to drill deeper into differences by states and programs to identify predictors of the differences in pro-gram quality and youth outcomes.