Abstract— Data quality is a multi-dimensional concept and
this research will explore its impact in performance measurement systems. Despite the large numbers of publications on the design of performance measurement systems (PMSs) and the definition of critical success factors to develop Performance Measures (PMs), from the data user perspective there are possibilities of finding data quality problems, that may have a negative impact in decision making. This work identifies and classifies uncertainty components of PMSs, and proposes a qualitative method for PMs’ quality assessment. Fuzzy numbers are used to represent PMs’ uncertainty and a method is proposed to calculate an indicator of the compliance between a PM and a target value that can serve as a risk indicator for the decision-maker.
Index Terms— performance measure(s), data quality,
uncertainty, fuzzy sets
I. INTRODUCTION
erformance measurement systems (PMSs) are receiving increasing attention from academics and practitioners particularly after the development of the Balanced Scorecard (BSC) [1], and many PMSs are available nowadays [2], [3]. Nevertheless, this subject is not new and, for example, quality gurus such as Crosby, Feigenbaum, or Deming recognized the importance of performance measurement as an activity within quality management. Recently, many publications on the design of PMSs and about its implementation and use have been published. There is, however, a lack of investigation on the uncertainty associated with such performance measures (PMs).
The uncertainty is a quantitative indication of the quality of the result. It is an unavoidable part of any measurement and it starts to matter when results are close to a specified limit. When uncertainty is evaluated and reported in a specified way it indicates the level of confidence that the value actually lies within the range defined by the uncertainty interval.
The PMS’s purpose is to contribute to both the goals and the sustainability of the organisation [3], through the decision-maker that acts on the organization based on the
This work was financed with FEDER Funds by Programa Operacional Fatores de Competitividade – COMPETE and by National Funds by FCT – Fundação para a Ciência e Tecnologia, Project: FCOMP-01-0124-FEDER
S. D. Sousa is with Centro Algoritmi, University of Minho, Campus de Gualtar, 4710-057, Braga, Portugal, phone: +351 253 604 762; e-mail: [email protected].
E. Nunes is with Centro Algoritmi, University of Minho, Campus de Gualtar, 4710-057, Braga, Portugal; e-mail: [email protected].
I. S. Lopes is with Centro Algoritmi, University of Minho, Campus de Gualtar, 4710-057, Braga, Portugal; e-mail: [email protected].
values of PMs. However, if uncertainty is present in physical systems it should be reflected in the PMS. Furthermore, there are many measurement capability studies of “hard” variables, but there are few attempts to deal with attribute data and “soft” PMs (based on subjective assessment), such as customer satisfaction. Failure to deal with such uncertainty will result in simplified models of reality.
The information (or data) quality field of research has established that information quality is a multi-dimensional concept [4]. Many works [5] - [7] have identified different sets/categories of quality dimensions: Intrinsic, contextual and reputational [6]; internal, data related, external, system-related [8]; objective and subjective [7]; syntactic, semantic, pragmatic and physical [9]. These categories, applicable to data or information in general, could also be applied to specific areas [10] such as the PMS.
In the traditional formulation of a PMS, most PMs are affected by imprecision and vagueness but they are represented using numerical crisp values. A good decision-making model needs to tolerate vagueness and imprecision because these types of the non-probabilistic uncertainty are common in decision-making problems [11].
The hypothesis is that organisations need to reflect the uncertainty of its physical systems and contextual factors in their PMs to improve their models. This identification of uncertainty in PMS is the first step to reduce such uncertainty.
Generally, each PM is represented by a number that is not able to represent uncertainty. The problem is how to overcome this situation or how to deal with data uncertainty. Several ways can be used to represent the uncertainty [12] such as: standard deviation, probability distribution, expected values, fuzzy numbers, scenarios and quartiles.
Fuzzy Set Theory have proved to be a successful in handling imprecise and vague knowledge that characterize this kind of problems, and it has been applied in a variety of fields in the last decades.
The second hypothesis of this work is that fuzzy sets are sufficient to represent the uncertainty in PMs.
The research methodology to characterise PMs’ uncertainty will comprise both deductive and inductive stages. This paper starts with a literature review on the field of performance measurement and uncertainty to develop through deductive logic a conceptual and theoretical structure about the classification of uncertainty in PMs. This paper presents the findings of this deductive research which will later be tested through case studies, to allow another step of inductive research to support, change or refute the
Sérgio D. Sousa, Member, IAENG, Eusébio Nunes and Isabel S. Lopes
Data Quality Assessment in Performance
Measurement
proposed characteristics of the PMs.
II. LITERATURE REVIEW
A. Performance measures
Juran and Godfrey [13] argue that “the choice of what to measure and the analysis, synthesis, and presentation of the information are just as important as the act of measurement itself” and emphasise the system to which the measurement process belongs. The measurement process consists of steps needed to collect data and present results.
A thorough understanding of the existing measurement systems, formal and informal, spoken and unspoken, as they are perceived [14] must be achieved, i.e. the overall framework in which the PMS operates should be understood [13].
According to Macpherson [15] there are two approaches to identifying PMs: top-down and bottom-up. Using the first approach, the search for PMs is based on the mission and vision of the organisation. The latter, on the other hand, is determined by what data is currently available and has the advantage of being cost effective by only focusing on visible data [15]. A third approach [16] is outside (or customer) - inside (or internal processes), endorsing the argument about the importance of looking at the organisation from the customer’s viewpoint [17].
Regardless of the approach used, there are two basic types of PM in any organisation – those related to results, and those that focus on the determinants of the results [14]. This suggests that it should be possible to build a performance measurement framework (PMF) around the concepts of results and determinants.
Perhaps the best know PMF is Kaplan and Norton’s Balanced Scorecard (BSC) [18]. It seems to be the most influential and dominant concept in the field. The authors of the BSC suggested the definition of strategy maps to describe the cause-and-effect relationships between the identified measures, but according to Wilcox and Bourne [19] these relationships are outdated, because the organisation and its context are dynamic.
Kanji and Sá [20] started with the BSC and integrated TQM principles and critical success factors (CSFs) resulting in a model which focussed on measuring how an organisation is performing from an outside perspective. Bititci et al. [21] developed a model for an integrated and dynamic PMS. As the previous framework it should have: an external and internal monitoring system. Basu [22] also argued that the PMs should be more externally focused for the total network and a formal senior management review process with two-way communication to all partners was essential to success.
The Performance Prism’ authors [23] refer to the importance of identifying stakeholders’ contributions, as they are part of a reciprocal relationship with the organisation. They also argue that it is necessary to start to think about measurement as the process of gathering management intelligence.
PMs Quality
To contribute to the planning phase of the PMS, CSFs
about data quality are identified in the literature. PMs should be [15], [24], [25]:
• relevant (C1); • credible (C2); • precise (C3); • valid (C4); • reliable (C5); and • frequent (C6).
Other CSFs are discussed in the performance measurement literature are:
• data collection and methods for calculating the PMs must be clearly defined [26] (C7);
• presentation of PMs must be simple [17] (C8);
• PMs must be flexible [25], including being tied to desired results [27] (C9);
• more extensive use should be made of subjective data [24] (C10); and
• ratio-based performance criteria are preferred to absolute numbers [26] (C11).
However, the designing of a PMS may not comply with all of these requirements and thus its quality should be assessed using the commonly accepted dimensions of data quality. Data quality dimensions commonly referred in literature are [28]:
• accuracy; • completeness; • timeliness; and • consistency.
Many other classifications of Information Quality exist, for example, [5], refer:
• intrinsic – implies that information has quality in its own right;
• contextual - must be considered within the context of the task at hand; it must be relevant, timely, complete, and appropriate in terms of amount, so as to add value; and
• representational and accessibility - emphasize the importance of computer systems that store and provide access to information; that is, the system must present information in such a way that it is interpretable, easy to understand, easy to manipulate, and is represented concisely and consistently; also, the system must be accessible but secure”.
Galway and Hanks [29] classify data quality problems as operational, conceptual and organizational. Associated with operational data problems there is an implied presumption that, were the data correct, the user could directly utilize them in making the necessary decision(s).
B. Characterising uncertainty
Any measurement is subject to imperfections; some of these are due to random effects. Repeated measurements will show variation because of such random effects. When uncertainty is evaluated and reported in a specified way it indicates the level of confidence that the value actually lies within the range defined by the uncertainty interval.
parameter, associated with the result of a measurement, that characterizes the dispersion of the values that could reasonably be attributed to the measurand” [30]: 2. Thus the uncertainty, in metrology, is a quantitative indication of the quality of the result. It gives an answer to the question, how well does the result represent the value of the quantity being measured? It allows users of the result to assess its reliability, for example for the purposes of comparing results from different sources or with reference values.
Uncertainty can be expressed as a quantity, i.e., an interval about the result. “Without such an indication, measurement results cannot be compared, either among themselves or with reference values given in a specification or standard. It is therefore necessary that there be a readily implemented, easily understood, and generally accepted procedure for characterizing the quality of a result of a measurement, that is, for evaluating and expressing its uncertainty.” [30]: viii). This is common knowledge in metrology but, apparently, it is not being applied in ordinary PMs.
There is a wide variety of reasons why uncertainty is present in PMSs. Particularly, to reliability studies [31] presents three main reasons: (i) dependence on subjective information in the form of expert judgments; (ii) the relaxation of dependence on precise statistical models justified by physical arguments; (iii) the exact system structure and dependence relations between components are known, which may well be unrealistic. These relationships are conditioned by the system’s environment and may generate contradictory information, vagueness, ambiguity data, randomness, etc. In reliability studies, the vagueness of the data have many different sources: it might be caused by subjective and imprecise perceptions of failures by a user, by imprecise records of reliability data, by imprecise records of the tools appropriate for modelling vague data, and suitable statistical methodology to handle these data as well [32].
According to ISO 1012 [33], section 7.3, the measurement uncertainty shall be estimated for each measurement process covered by the measurement management system and all known sources of measurement variability shall be documented. If these requirements are to be applied in all PMs of the organization there would be the need to identify all sources of variability. However, few works [34] - [37], report the inclusion of such variability in their studies.
Both [34] and [35] considered uncertainty in manufacturing systems and argue that reducing it, is a means to improve the system. Other studies have included uncertainty in project scheduling [37], inventory control [36], or supply chain management [38]. However, specific components of PMS’s uncertainty and its classification, to facilitate systematic studies, are not known.
C. Methods to deal with uncertainty of PMs
Traditionally, uncertain parameters in inventory control and supply chain management problems have been treated as stochastic processes and described by probability distributions [38]. A probability distribution is usually
derived from evidence recorded in the past [36]. This requires a valid hypothesis that evidence collected are complete and unbiased, and that the stochastic mechanism generating the data recorded continues in force on an unchanged basis [38]. However, there are situations where all these requirements are not satisfied and, therefore, the conventional probabilistic reasoning methods are not appropriate [38]. In this case, uncertain parameters can be specified based on the experience and managerial subjective judgment. Often, an expert may feel that a given parameter is within a certain range and may even have an intuitive feel for the best value within that range [36].
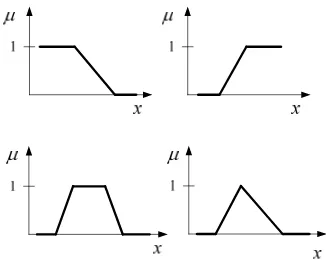
It may be convenient to express these uncertainties using various imprecise linguistic expressions [38]. Fuzzy sets are found to be useful in representing these approximate qualifiers, due to their conceptual and computational simplicity. The typical membership functions can represent fuzzy customer demand, fuzzy external supplier reliability or fuzzy lead time [38], just to name a few.
To deal with uncertainty in scheduling environment other approaches (apart from stochastic and fuzzy) are found in literature: reactive, proactive and sensitivity analysis [37], while [35] argue that for complex processes, methodologies based on artificial intelligence and simulation should be used.
On production planning, [35] identified a need for further research in incorporating all uncertainty in an integrated manner; and in the development of empirical works that compare the different modelling approaches with real case studies.
Several authors [39] [40] used a fuzzy AHP approach to assign weights to certain PMs, while [41] used it to obtain weights in multicriteria multifacility location problems.
The costs incurred by organisations to manage uncertainty should not be ignored [28], and different methods to deal with uncertainty have different requirements and associated costs. In risk management a parallel situation can be established because identified risks are not all subject to the same detailed subsequent treatment, for example qualitative methods for risk assessment (less expensive than quantitative methods), may be enough for lower level risks, while quantitative techniques would be economically reasonable for higher level risks. Similarly, methods to deal with uncertainty have associated costs, and if some components of uncertainty, are small compared to others, it could be unjustifiable to make a detailed determination of all its components. This is also expressed in ISO 10012 (section 7.3.1).
Fuzzy sets
Having reviewed PMSs and uncertainty, the next section will address the classification of PMs’ uncertainty.
Fig. 1 Commonly used membership functions
III. UNCERTAINTY COMPONENTS OF PERFORMANCE MEASURES
Given the multitude of information about quality dimensions and problems this work will identify uncertainty components or data quality problems of PMs. A basic quality tool, the Cause and effect diagram which is usually used to group the main causes of a problem by controllable factors of a company was developed in order to identify the uncertainty component (Figure 2).
The uncertainty components were classified in three main groups: Intrinsic (mainly related with its design), Data Collection (refers to real time data quality problems introduced by the collection method), and, finally, the PM definition (on the customer perspective use of PMs).
Uncertainty in Performance Measures
Performance Measure
Data Collection Intrinsic
Measurement Method
Precision and Accuracy of Measurement Tool
Definition/ measurand
Aggregating uncertainty component Human
[image:4.595.47.291.452.573.2]Environment Data Collection
Fig. 2 Cause-and-effect diagram of uncertaintycomponents in PMs
Examples of the uncertainty components are provided in [44]. A brief description of the uncertainty components is provided in Table I.
IV MODELLING UNCERTAINTY IN PERFORMANCE MEASURES
A. Uncertainty Qualitative Assessment
Quantitative methods for uncertainty modelling usually require more resources and data than qualitative ones. It is proposed a less demanding assessment method, a qualitative assessment, based on the analyses of uncertainty components, which are represented through fuzzy membership functions. The first step to characterise uncertainty would be to identify what Uncertainty Components are associated with each PM.
The second step would be to classify the uncertainty level of each Uncertainty Component. In structured systems (such as automotive manufacturing plants) risk assessment and FMEAs, typically, use a 10 item Likert scale. As PMs apply to less structured systems, the authors propose a scale with three levels but similar solutions with other levels are also feasible. For example, a scale for UC_A component could be:
No Uncertainty – There is a recognized formula that derives from theory and is not scientifically questioned.
Some uncertainty – An agreed formula is, apparently, recognised as adequate by all stakeholders.
High uncertainty – The formula was defined without consensus and may be changed.
After building similar scales to each uncertainty component, a matrix could relate each PM with each uncertainty component. This matrix would be a tool to decide which uncertainty components would be further studied, and could provide evidence to change existing PMs. The uncertainty reduction of the PMS would provide less risk in decision making.
The next step to model uncertainty would be to represent it by fuzzy membership functions.
TABLEI
UNCERTAINTY COMPONENTS OF PERFORMANCE MEASURES
Intrinsic Data Collection Performance Measure
Measurement method uncertainty component (UC_MM):
Error on the method used to perform the measurement introduced by a wrong procedure
Data collection (equipment/ operator)
uncertainty component (UC_DC):
Errors in the introduction and acquisition of data (missing data, error introduced or allowed by the data acquisition system).
Definition / Measurand uncertainty component (UC_D):
Difference between what is intended to be measured and what is really measure with the chosen PM.
Precision and accuracy of measurement tool (UC_PA):
The precision of the measurement tool is determined by the study of the repeatability and reproducibility (R&R).
Environmental uncertainty component (UC_E):
Difference between what is intended to be measured and what is really measure motivated by changes in the system that occurred after the introduction of the PM.
Human assessment component (UC_H):
Uncertainty introduced by a subjective judgment when the measurement system relies on human.
Aggregating uncertainty component (UC_A):
[image:4.595.59.542.599.778.2]A. Modelling Uncertainty
Let us assume that PMs fuzzy numbers will represent the uncertainty components identified in previous section. Let
x x x xn
f
M 1, 2, 3,..., be the analytical model for a given
crisp PM, M. This model maps the n inputs
x1,x2,x3,...,xn
into the output space. It is now intended to extend such a mapping to fuzzy sets M~f
x~1,x~2,x~3,...,~xn
.The arithmetic by intervals and the Zadeh’s extension principle [45] constitute the two fundamental methods to handle fuzzy numbers. These methods have shown to be suitable for simple mathematical operations.
LetP~i to be a PM represented by a fuzzy number and
ij
~ to be the fuzzy weight to calculate an aggregate PM, M~j This PM is the result of an aggregator operator Θ of PM,
i
P~each weighted by ~ij.
ij i
j P
M~ ~ ,~ (i=1, ..., n) j (1)
The membership function of the PM, j
M~ , is a surface with the possible values of Mj. Under these circumstances
arises the difficulty of interpreting the result. Frequently, a
defuzzification is performed of the membership function of
the performance measurement to obtain a crisp number. In this operation a lot of information is lost that could be relevant to the decision process. Thus the fuzzy result is richer than the crisp number.
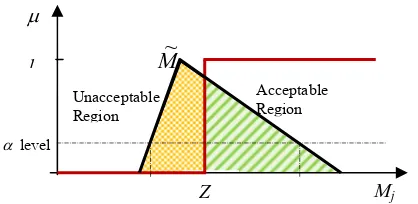
Let Z be the target value for the PM, j
M~ . This value represents the acceptance/rejection region of the decision maker. To capture the uncertainty of the assessment system, the PM, Mj, is represented by a fuzzy number M~ , and the j
[image:5.595.54.263.467.569.2]target (or acceptable region) is a crisp value Z (Figure 2).
Figure 2: Fuzzy performance measure and target (or acceptable region)
In [46], the Compliance of two membership functionsM~and Z was calculated as a fuzzy measure of compatibility. There are several measures to quantify the compatibility of two fuzzy numbers [47]. The overlapping area between two membership functions (i.e. a fraction of the total area of the PM) represents the concept of compliance better than other compatibility measures such as possibility and necessity. Thus,
PM of funtion membership of
area total
target and PM of functions membership of
area overlaping
Compliance
The following assumptions are considered when using Compliance (C):
• The maximum of C is equal to 1, and that happens for
any level of cut such as, M~()Z
0 ,1
• The minimum value of C is equal to 0, and that happens for any level of cut, such as M~()Z
0 ,1
• C provides a consistent ranking to assess the degree to which a fuzzy number complies with target. It is a monotonic increasing function.
V CONCLUSION AND FUTURE RESEARCH
This work provides a classification of uncertainty components that affect the quality of PMs. Can each uncertainty component be decomposed into a systematic and random part? This decomposition will allow the identification of causes that, if changed, could reduce uncertainty.
The first contribution of this work is to provide a general classification of sources of uncertainty that could affect PMs, based on dimensions of information quality. This would allow the establishment of a common theoretical framework to classify uncertainty in the field of Performance Measurement. Secondly, it would provide a basis for practitioners to provide evidence about the uncertainty of existing PMSs.
The second contribution of this work is the creation of a risk indicator associated with a decision that represents the uncertainty the decision maker faces given a PM with uncertainty and a decision criterion.
The development of methods to propagate the uncertainty of the PMs throughout the PMS and through different hierarchic levels is being pursued by the authors in another research project.
This work will be extended to deal not only with the uncertainty in the PMS but also with the uncertainty of the decision criteria.
The representation of uncertainty in performance measurement systems is at the centre of this on-going research. This part of the research presents the findings of this deductive research which will later be tested through case studies, to allow another step of inductive research to support, change or refute the proposed elements for the PMS.
REFERENCES
[1] Kaplan, R. and D. Norton (1992). "The balanced scorecard - measures that drive performance." Harvard Business Review(January-February): 71-79.
[2] Bourne, M. (2004). Handbook of performance measurement. London, Gee Publishing.
[3] Verweire, K. and L. V. d. Berghe (2003). "Integrated performance management: adding a new dimension." Management Decision 41(8): 782-790.
[4] Pipino, L. L., Y. W. Lee, and R. Wang, (2002). "Data quality assessment " J Commun. ACM 45(4): 211-218.
[5] Lee, Y. W., D. M. Strong, Beverly K. Kahn and Richard Y. Wang, (2002). "AIMQ: a methodology for information quality assessment." Information & Management 40(2): 133-146.
[6] Stvilia, B., L. Gasser, Michael B. Twidale and Linda C. Smith , (2007). "A framework for information quality assessment." Journal of the American Society for Information Science and Technology 58(12): 1720-1733.
level
Unacceptable Region
M
~
Acceptable Region
Mj Z
1
[7] Ge, M., M. Helfert, Witold Abramowicz and Dieter Fensel, (2008). Data and Information Quality Assessment in Information Manufacturing Systems
[8] Wand, Y. and R. Y. Wang (1996). "Anchoring data quality dimensions in ontological foundations" Commun. ACM 39(11): 86-95.
[9] Dai, Y. and Y. Su (2009). Assuring the Information Quality of Production Planning and Control in Tobacco Industries. Fourth International Conference on Cooperation and Promotion of Information Resources in Science and Technology, 2009. COINFO '09.
[10] Madnick, S. E., R. Y. Wang, Yang W. Lee and Hongwei Zhu, (2009). "Overview and Framework for Data and Information Quality Research " J. Data and Information Quality 1(1): 1-22.
[11] Yu, C.-S. (2002). "A GP-AHP method for solving group decision-making fuzzy AHP problems." Computers & Operations Research 29(14): 1969-2001.
[12] Durbach, I. N. and T. J. Stewart (2011). "An experimental study of the effect of uncertainty representation on decision making." European Journal of Operational Research 214(2): 380-392.
[13] Juran, J. M. and A. B. Godfrey (1999). Juran's Quality Handbook, McGraw-Hill.
[14] Neely, A., M. Gregory and K. Platts, (1995). "Performance measurement system design." International Journal of Operations & Production Management 15(4): 80-116.
[15] Macpherson, M. (2001). "Performance measurement in not-for-profit and public-sector organisations." Measuring Business Excellence 5(2): 13-17.
[16] Seddon, J. (2002). Changing Management Thinking. Q2002 - A World Quality Congress - 46th EOQ Congress, UK.
[17] Tenner, A. and I. DeToro (1997). Process Redesign. Harlow, Addison-Wesley.
[18] Kaplan, R. S. and D. P. Norton (2001). The strategy-focused organization:. Boston, Massachusetts, Harvard Business School Press. [19] Wilcox, M. and M. Bourne (2003). "Predicting performance."
Management Decision 41(8): 806-816.
[20] Kanji, G. and P. Sá (2002). "Kanji's Business Scorecard." Total Quality Management 13(1): 13-27.
[21] Bititci, U., T. Turner and C. Begemann, (2000). "Dynamics of performance measurement systems." International Journal of Operations & Production Management 20(6): 692-704.
[22] Basu, R. (2001). "New criteria of performance management." Measuring Business Excellence 5(4): 7-12.
[23] Neely, A., C. Adams and Mike Kennerley, (2002). The performance prism: the scorecard for measuring and managing business success, Financial Times Prentice Hall.
[24] Schalkwyk, J. (1998). "Total quality management and the performance measurement barrier." The TQM Magazine 10(2): 124-131.
[25] Ghalayini, A., J. Noble and T. Crowe, (1997). "An integrated dynamic performance measurement system for improving manufacturing competitiveness." International Journal of Production Economics 48: 207-225.
[26] Globerson, S. (1985). "Issues in developing a performance criteria system for an organisation." International Journal of Production Research 23(4): 639-46.
[27] Franco, M. and M. Bourne (2003). "Factors that play a role in "managing through measures''." Management Decision 41(8): 698-710.
[29] Batini, C., C. Cappiello, Chiara Francalanci and Andrea Maurino, (2009). "Methodologies for data quality assessment and improvement " J ACM Comput. Surv. 41(3): 1-52.
[29] Galway, L. A. and C. H. Hanks (2011). "Classifying Data Quality Problems." IAIDQ's Information and Data Quality Newsletter 7(4): 1-3.
[30] JCGM/WG 1, (2008). JCGM 100:2008 - GUM 1995 with minor corrections - Evaluation of measurement data - Guide to the expression of uncertainty in measurement,, JCGM.
[31] Coolen, F. P. A. (2004). "On the Use of Imprecise Probabilities in Reliability." Quality and Reliability Engineering International 20(3): 193-202.
[32] Nunes, E., F. Faria and M. Matos, (2006). Using fuzzy sets to evaluate the performance of complex systems when parameters are uncertain. Proceedings of Safety and Reliability for Managing Risk. Lisbon. 3: 2351-2359.
[33] ISO_1012 (2003). ISO 10012 Measurement management systems - Requirements for measurement processes and measuring equipment, ISO.
[34] Wazed, M. A., S. Ahmed and Yusoff Nukman, (2009). "Uncertainty Factors in Real Manufacturing Environment " Australian Journal of Basic and Applied Sciences 3(2): 342-351.
[35] Mula, J., R. Poler, J. García-Sabater and F.C. Lario, (2006). "Models for production planning under uncertainty: A review." International Journal of Production Economics 103(1): 271-285.
[36] Petrovic, D., R. Roy and R. Petrovic, (1999). "Supply chain modelling using fuzzy sets." International Journal of Production Economics 59(1–3): 443-453.
[37] Herroelen, W. and R. Leus (2005). "Project scheduling under uncertainty: Survey and research potentials." European Journal of Operational Research 165(2): 289-306.
[38] Petrovic, D. (2001). "Simulation of supply chain behaviour and performance in an uncertain environment." International Journal of Production Economics 71(1–3): 429-438.
[39] Lam, K.-C., M. C.-K. Lam and D. Wang, (2008). "MBNQA-oriented self-assessment quality management system for contractors: fuzzy AHP approach." Construction Management and Economics 26(5): 447-461.
[40] Hu, A. H., C.-W. Hsu, Tsai-Chi Kuo and Wei-Cheng Wu, (2009). "Risk evaluation of green components to hazardous substance using FMEA and FAHP." Expert Systems with Applications 36(3, Part 2): 7142-7147.
[41] Bashiri, M. and S. J. Hosseininezhad (2009). "A fuzzy group decision support system for multifacility location problems." The International Journal of Advanced Manufacturing Technology 42(5-6): 533-543. [42] Ross, T. (1995). Fuzzy Logic with Engineering Applications. New
York, McGraw-Hill.
[43] Klir, G. J. (1995). Fuzzy sets and fuzzi logic : theory and applications Upper Saddle River, N.J. , Prentice Hall
[44] Sousa, S.D., E. P. Nunes and Isabel Lopes, “On the characterisation of uncertainty in Performance Measurement systems”. In Putnik G. D., Ávila P. (Eds.), Business Sustainability 2.0. Guimarães: School of Engineering – University of Minho; Porto: ISEP – School of Engineering – Polytechnic of Porto. pp. 82-88, 2011
[45] Zadeh, L. A. (1978). "Fuzzy sets as a basis for a theory of possibility." Fuzzy Sets and Systems 1(1): 3-28.
[46] Nunes, E. and S. D. Sousa (2009). Fuzzy Performance Measures in a High Uncertainty Context Proceedings of the IX Congreso Galego de Estatística e Investigación de Operacións, Ourense.