Analysis of Browsing Behaviors with Ant Colony
Clustering Algorithm
Xiaohua Hu
Changhai Hospital, Second Military Medical University, Shanghai 200438, P.R.China Email: [email protected]
Tao Mu, Weihui Dai, Hongzhi Hu and Genghui Dai Information Centre, Fudan University, Shanghai 200433, China School of Management, Fudan University, Shanghai 200433, China School of Management, Fudan University, Shanghai 200433, China School of Marine Sciences, Sun Yat-Sen University, Guangzhou 510275, China
Email: [email protected], [email protected], [email protected], [email protected]
Abstract—The characteristics of users' browsing behaviors on websites can be used to analyze system performance as well as network communication, understand users’ reaction and motivation, and build adaptive websites. However, the motivation, requirement and experience of users may dynamically change, which cause difficulty in exactly refining a stable behavior pattern and describing their shifted interest. This paper introduces an optimized ant colony clustering algorithm (OACA) in dynamic pattern discovery, and explores the structured formula to describe the users’ browsing behavior patterns as well as to analyze their characteristics adaptively. The test and results show that users are clustered accurately based on their similar browsing behavior from dynamic Web log data.
Index Terms—Internet User, Browsing Behavior, Swarm Intelligence, Clustering Analysis, Ant Colony Cluster Algorithm
I. INTRODUCTION
Along with the rapid improvement of internet, the design and management of Web sites and system become more and more important. Knowledge extracted from Web logs can be used to improve the structure design of Web sites, analyze system performance as well as network communication, understand user reaction and motivation, and build adaptive web sites.
Web site operators should concentrate on their users, and the feature of users' browsing behaviors is the key point in this process. Through the study of the network user browsing behavior, could help the site operator to get more development in the era of network economy. As the sharp increase in user data, the traditional data analysis methods can’t fully meet the site operator requirements. To web site operators, the lack of user or
do not understand the real demand of the user means they are lack in effectively grasping business trends and market rule. If web site operators want to establish their own business in the market, it is necessary to establish their own fixed and effective customer group. To achieve this goal must take all the methods and skills to attract target customers. While the site operators’ resources are limited, it is not possible to provide specialized services to each user. Therefore, the user classification is of great importance.
Some scholars defined web mining as the application of data mining technology in large cyber source to analyze web site [1]-[3].Web Mining is finding meaningful information by mining the web browsing records. Such as how many people visited the page, where they came from, which page is the most popular? It can be widely used in network personalized services, system improvement, site modification, site business intelligence and browsing recommend and so on. The current economy mode has been transferred from the traditional entity store to the Internet electronic trading, and also changed the vendors and customers relationship. Through web mining can learn about the customer interest and value orientation as much as possible, to ensure the competitiveness in the age of electronic commerce.
Data mining technology can provide an effective solution to the site operators. Site operator can take advantage of the powerful data processing function of data mining technology to mine valuable and potential information from the huge data mining, which provide assistant for website operators’ decision.
When a user accesses a once visited URL, it will appear reverse correlation. Mining user browsing behavior pattern is: first, seek all maximum forward connection path from the original log database, and then back to the forward related path starting point to continue to look for other forward connected path; then by finding the maximum forward path to derive frequently connected path browsing. After find all users maximum
Manuscript received September 28, 2012; revised October 30, 2012; accepted November 16, 2012.
This research was supported by National Natural Science Foundation of China (No. 90924013) .
forward relative path, the mapping of user access pattern is to find most frequent continuous sub browsing problem from all maximum forward connected path, where the frequent connected path is browsing what reach to a sequence of certain threshold; finally work out the maximal frequent connected path browsing. A frequent connected path browse is the biggest, if it is not contained in any one of the other maximal frequent connected path.
If there’s no information about user’ interest type previously, we generally using clustering algorithm on users’ browsing information analysis, which plays an important role in mining clustering algorithm. Cluster analysis is one of the main functions of data mining and knowledge discovery, which groups data sets into classes by similar features for each class. For studying users' browsing behavior characteristics, cluster method divides users into several classes, and based on each class commonness, web site operators can understand their users' behavior better, explore the users' potential demands and interests, find the behavioral regularities, hereby improve the structural design of Web site, and provide the unique personalized service for users in e-commerce.
II. RELATED WORK
Web Mining is the commonly used method to analyze users' browsing behaviors and the pattern, which can be focused on three aspects: Web usage mining, Web content mining, and Web structure mining. Analysis of users' browsing behaviors belongs to the Web usage mining, which was defined by Bamshad and Robert in 1999[1] as the application of data mining techniques to discover usage patterns from the secondary data derived from the interactions of the users while surfing on the Web, in order to understand and better serve the needs of Web-based applications. In 2000, Srivastava et al. [2] expatiated on the process of Web usage mining into three steps: data preprocessing, pattern discovery, and pattern analysis. In the following years, a substantial body of literatures has studied various methodology and technologies and mainly focus on those three steps. By the review of those literatures, we find that exactly refining user’s behavior pattern and thereof describing their interest is the key to this issue [3]. At this point, Tseng et al. [4] presented a complete framework and the approach to discover user’s browsing pattern under some restricted conditions, such as specific websites, browsing time and personality in 2003. In some cases, users’ behavior patterns and their interest are supposed to be classed into predictive types by an empirical survey or existed experience. However, the composition, requirement and experience of users may change dynamically; thereof lead to difficulty in refining a stable behavior pattern and describing their shifted interest [3]. To solve this problem, dynamically adaptive technology had to be considered in behavior pattern discovery. Fortunately, swarm intelligence provides a very helpful means to refine the user’s behavior pattern dynamically and adaptively by cluster analysis of updating Web log data.
Swarm intelligence comes of the scientists’ research and observation on the social insect. The so-called swarm intelligence is that a great many of simple, unintelligent units unite into a group and express intellectual behaviors through mutual cooperating with each other [5]. Swarm intelligence exhibits a number of interesting properties such as flexibility, robustness, decentralization and self-organization [6]. It is widely used in portfolio optimization problem, knowledge discovery, communication networks, data-mining and etc. [7]-[9]. In the recent years, some scholars study cluster problem according to the idea of swarm intelligence [10]-[14]. The inspiration of ant colony cluster comes of the accumulation of ant bodies and classification of ant larvae. The classic ant colony cluster algorithm takes use of the characteristics of positive feedback of the ant colony. Such algorithm is robust, good convergence, and parallel. However, it is also with the disadvantage of long time convergence, easy stagnation and local optimization. Based on the basic model of Denueubourg and LF algorithm [15], we adopted an optimized ant colony optimization cluster algorithm(OACA), which can handle large category dataset more rapidly, accurately and effectively, and keep the good scalability at the same time [16].
Therefore, our study aimed to address the research in the application of our optimized ant colony cluster algorithm to analyze user’s browsing behavior dynamically.
III. OPTIMIZED ANT COLONY CLUSTER ALGORITHM
The main process of the ant cluster algorithm is the ant conveying process. Ant decides whether pick-up the current object by object’s probability conversion function. Similarly, when ant conveys the object to the destination, it also considers the similitude degree between the current object and the surrounding objects to decide whether to put-down or not. In this process, the ant doesn’t know the other ants’ location distributing and load status, neither the other objects’ distributing status outside its observing scope. So we can say the ant conveying process is an easy and absolute individual behavior. Yet, it is this easy individual behavior makes the objects divided into various clusters during long-time and concurrent process. The algorithm pseudocode of OACA may be designed as followings [16]:
For every item
d
i(i=1,2,…,n) doPlace
d
i randomly on siteEnd For
For all ants do
Place ant at randomly selected site End For
/* main loop */ For t=1 to
t
maxdo For all ants doCompute the similarity
f
(d
i) ofd
i in R×Rarea
Calculate the
p
p and generate a randomnumber Q
If
p
p > Q/*pick-up rule*/ Pick up item
d
iRemember the
f
(d
i) and current positionMove the ant with
d
i to a random placeElse
Don’t move, move empty ant to random place
End If
Else If (ant carrying item
d
i and the place is empty)then
Compute the similarity
f
(d
i) ofd
i in thisplace
Calculate the
p
d and generate a random number QIf
p
d> Q then /* put-down rule*/ Drop itemd
iEnd If
Move to a randomly place End If
End For
If (iteration times t over maximum time and t meet the change condition) then
Reduce the observation radius
Generate the to be processed cluster objects to the cluster center
Compute cluster center and merger the clusters in the same cluster center
Relocate the objects with weakest similarity pro rata with each cluster center
End If End For
Print location of items /* export cluster result*/
Compared with traditional ant cluster algorithm, the improvement of the optimized ant algorithm is:
-The optimized algorithm has an adjusting process which improves the efficiency of the algorithm, and avoids the local optimality and stagnancy as well.
- Dynamic adjusting of observing radius. - Adopt a new similitude degree formula.
- Short-term memory. Endow the ant with a short-term memory to reduce the repeated behavior of the ant.
Compared with the K-Modes algorithm, Information Entropy-Based cluster algorithm (ECA) [17][18], and LF algorithm, experiment results of data collect from UCI machine learning database [19] (Machine Learning Repository, http://archive.ics.uci.edu/ml/) showed that
this algorithm are excellent in both accuracy and efficiency [16].
IV. ANALYSIS OF BROWSING BEHAVIORS
A. Analysis Methods
The analysis of browsing behavior can be divided into three steps:
Data preprocessing, pattern discovery, and pattern analysis. In the data preprocessing, history data about the user’s IP address, ID, requested URL and access time, etc. are collected from the Web log data and thereof are purified to recognize each user and its sessions by a series of commonly used technologies [2][4]. Pattern discovery aims to discover the habit-forming behavior and its characteristics by analyzing the user’s sessions, path records and other related information. Related rules are usually to describe the potential relationship between the user and accessed Web pages, and reflect some aspects of the user’s behavior pattern. But in most cases, it’s difficult to refine a set of stable and common rules that suitable for a certain user cluster, because the user’s requirement, interest as well as its attentive information may be dynamically changed and dispersed even in the same initial cluster. In this paper, we establish a set of “components” to describe the elements of user’s behavior and its characteristics, and discover the behavior pattern by a dynamically clustering analysis of above “components”. Explicit and significative results may also be easily obtained in the following step of pattern analysis.
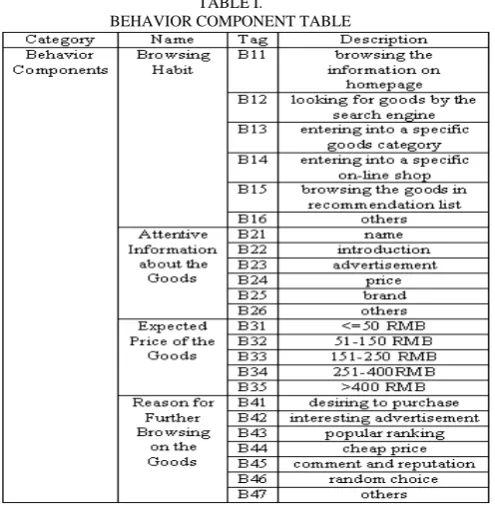
By a statistical analysis and the observation from online shoppers in China [3], we summarized three categories of components as shown in Tables I to III. Those tables are applied to pattern discovery and pattern analysis of user’s browsing behavior on online shopping, which consider some special characteristics in China.
TABLE I.
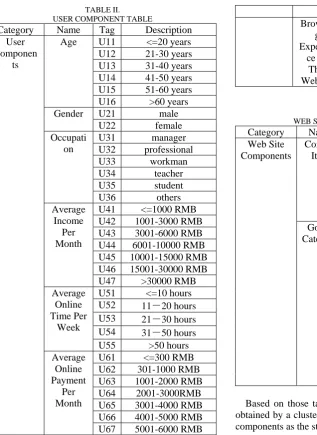
TABLE II. USER COMPONENT TABLE
Category Name Tag Description User
Componen ts
Age U11 <=20 years
U12 21-30 years
U13 31-40 years
U14 41-50 years
U15 51-60 years
U16 >60 years
Gender U21 male
U22 female Occupati on U31 manager U32 professional U33 workman U34 teacher U35 student U36 others Average Income Per Month
U41 <=1000 RMB U42 1001-3000 RMB U43 3001-6000 RMB U44 6001-10000 RMB U45 10001-15000 RMB U46 15001-30000 RMB U47 >30000 RMB Average
Online Time Per
Week
U51 <=10 hours U52 11-20 hours U53 21-30 hours U54 31-50 hours
U55 >50 hours
Average Online Payment
Per Month
U61 <=300 RMB
U62 301-1000 RMB
U63 1001-2000 RMB U64 2001-3000RMB U65 3001-4000 RMB U66 4001-5000 RMB U67 5001-6000 RMB
U68 >6001 RMB
Browsin g Experien ce on This Website
U71 never browsing
TABLE III.
WEB SITE COMPONENT TABLE
Category Name Tag Description
Web Site Components
Content Item
W11 homepage W12 search engine W13 goods category W14 on-line shop list W15 recommendation
goods list W16 others Goods
Category
W21 dress and home accessories
W22 cosmetic and
jewelry W23 book and
audio-visual products W24 ticket and phone
card W25 electronic products W26 maternal & child
products W27 food and health
products W28 others
Based on those tables, user’s behavior pattern can be obtained by a clustering analysis with three categories of components as the structured formula:
%}
,
{
%}
,
{
%)}
,
{(
)
(
:
)
(
N
cluster
m
U
ij ijB
mn mnW
st stPatter
=
δ
∩
δ
∩
δ
Here, N is the sequence number of discovered patterns ranked by the cluster size, m is the corresponding cluster number,Uij ,Bmn andCst are tagged components with
respective percent of δij%,
δ
mn%, andδst% in thiscluster. In those formula, the percent of %,
ij
δ δmn%, andδst%even their tagged components may be dynamically changed when user’s requirement, experience and interest have been shifted.
V. TEST AND RESULTS
Test data are obtained from the basic information of 156 registered users and their browsing records in the Web log data of an online shop which contains all the components listed in Table III. We collect the data of 15769 browsing actions by those users during a period of continuous 30 days. To ensure the accuracy of user’s information, all the data about their basic information
have been updated by themselves just before the beginning of test, and the behavior components of “Attentive information about the goods” (B21-B26) and “Reason for further browsing on the goods” (B41-B47) are requested to be choose when they want to browse the details of a certain goods.
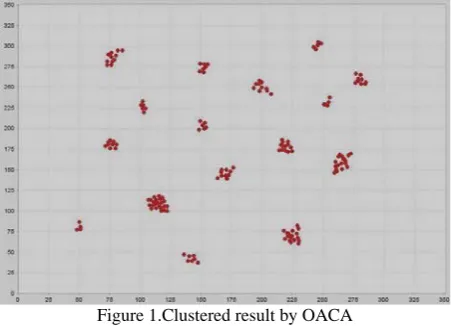
Test data are purified and scaled as a collect data set, in which each related component from Table I to III have been assigned a value of 0 or 1 to satisfy the requirement of optimized ant colony cluster algorithm. It is obviously that the user sorts are unknown before clustering analysis, and the number of user group sorts is uncertain. Thus, we cannot use the algorithm that fix the cluster number like k-modes algorithm and ECA, and that is the advantage of OACA.
Figure 1.Clustered result by OACA
Table IV shows the detailed information. Adjacent field X and adjacent field Y indicate the distributing
section of the object on horizontal coordinate and vertical coordinate.
TABLE IV.
WEB SITE COMPONENT TABLE
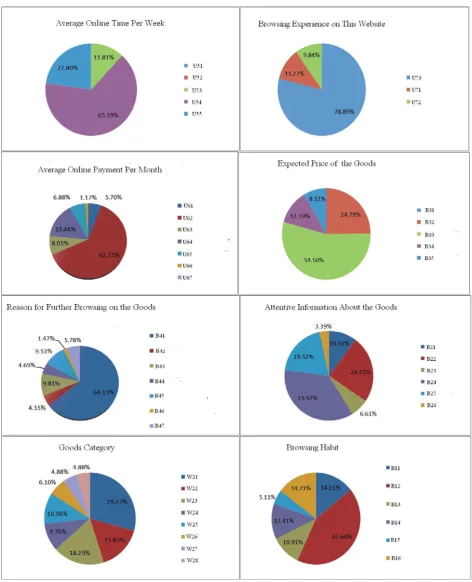
Clustering can differentiate the users who have different browsing behavior patterns. Of the 16 clusters from clustering, we choose Cluster 5 as examples to analyze their browsing behaviors. Cluster 5 contains 23 users. It has the largest size in all clusters. Figure 2 shows the characteristic distributions of some components in this cluster.
In Cluster 5, most of users have the experience of online purchase (U73) with monthly payment from 301 to 1000 RMB (U62), and their expected price of the goods is 151-250RMB (B33). In their browsing behavior, they pay more attention to the price and introduction about interested goods (B24, B22), and usually enjoy looking for goods by the search engine (B12), while dress and home accessories (W21), book and audio-visual products (W23) and cosmetic and jewelry (W22) are poplar goods for them.
Cluster Size Adjacent field on X-axis Adjacent field on Y-axis
cluster1 11 (69,83) (274,296)
cluster2 6 (98,105) (219,233)
cluster3 7 (148,155) (267,279)
cluster4 10 (193,208) (242,257)
cluster5 23 (105,123) (98,121)
cluster6 4 (48,52) (75,86)
cluster7 5 (242,249) (295,306)
cluster8 6 (147,156) (198,211)
cluster9 5 (249,255) (226,240)
cluster10 11 (213,226) (172,189)
cluster11 9 (67,81) (174,189)
cluster12 10 (163,176) (137,152)
cluster13 16 (217,233) (58,72)
cluster14 9 (275,285) (252,269)
cluster15 7 (133,148) (37,49)
Figure 2. Characteristic distributions of components in cluster 5
User’s behavior pattern can be described by three categories of components as the structured formula in the last section. From the characteristic distributions of
%)}
85
.
15
,
(
%),
29
.
18
,
(
%),
27
.
29
,
{(
%)}
15
.
64
,
(
%),
50
.
54
,
(
%),
35
.
24
,
(
%),
97
.
35
,
(
%),
64
.
42
,
{(
)}
89
.
78
,
(
%),
75
.
62
,
(
%),
39
.
65
,
{(
)
5
(
:
)
1
(
22 23 21 41 33 22 24 12 73 62 54W
W
W
B
B
B
B
B
U
U
U
cluster
Patter
∩
∩
=
In that pattern, only those tagged components whose percent are more than the average are listed. Similarly, the second pattern and the third pattern can be expressed with Cluster 16 and Cluster 13. Through dynamic analysis of those patterns and their changes, we can compartmentalize different user’s types by their characteristics in browsing behaviors; thereof build adaptive websites and advertising strategies to match their behaviors. Further experiments have shown that OACA is very suitable to be applied in self-adaptive pattern discovery with dynamic Web log data [3]. This technology has been successfully applied to a smart targeting system for online advertising [20].
IV. CONCLUSION
Due to the shift in user’s requirement, experience and interest, their browsing behaviors may be changed. To solve this problem, dynamically adaptive technology had to be considered in analysis of their behavior pattern. Based on three categories of components, we explored a structured formula to describe the user’s browsing behavior patterns as well as to analyze their characteristics adaptively. The optimized ant colony clustering algorithm has been successfully applied in pattern discovery with its prominent superiority to traditional ant algorithms.
However, the tables of components listed in this study are expected to be adjusted and expended to a common application. The current clustering efficiency of OACA is also expected to be improved. The algorithm mainly aims at classified data, but we should disperse the value data in the dealing process. So, we should do further improvement to the algorithm to adapt the mixed data directly.
V. ACKNOWLEDGEMENT
This research was supported by National Natural Science Foundation of China (No.90924013).
REFERENCES
[1] R.Cooley, B.Mobasher, J.Srivastava, “Data preparation for mining World Wide Web browsing patterns,” Journal of Knowledge Information Systems, Vol1(1), pp.5-32, 1999.
[2] J. Srivastave, R. Cooly, M. deshpande, P. N. Tan, “Web usage mining: Discovery and application of usage patterns from Web data,” SIGKDD Explorations, Vol 1(2), pp.12-23, 2000.
[3] T. Mu. Research and Implementation to Clustering Technology of Browsing Behavior Based on Swarm Intelligence. Shanghai: Fudan University, 2009.
[4] A.Tseng, I.Petrounias, P.Chountas, “A complete framework for web mining,” Proceedings of the 2003 IEEE International Conference on Systems, Man and Cybernetics, 2003.
[5] E. Bonabeau, M. Dorigo, G. Theraulaz, Swarm Intelligence: From Natural to Artificial Systems, New York: Oxford University Press, , 1999.
[6] J. Kennedy, R. C. Eberhart, Swarm Intelligence, San Francisco: Morgan Kaufmann, 2001.
[7] A. K. Jain, M. N. Murty, P. J. Flynn, “Data clustering: a review,” ACM Computing Surveys, Vol.31(3), pp. 264-323, 1999.
[8] H. Ma, Y. Q. Lu, H. B. Yin, “Customer segmentation based on the share of the customer,” Journal of Wuhan University of Technology Information & Management Engineering, Vol.25(3), pp. 184-187, 2003.
[9] Y. M. Tian, L. N. Meng, L. X. Mei, “Region-based image retrieval system using integrative feature description,”
Computer Engineering, Vol.31(19), pp. 167-169, 2005. [10] M. K. Ng, Z. Huang, “Data-mining massive time series
astronomical data: Challenges, problems and solutions,”
Information and Software Technology, Vol.41(9), pp. 545-556, 1999.
[11] Everitt and Brian, Cluster analysis, New York: Halsted Press, 1993.
[12] J. L.Handl, J. Knowles, D. B.Kell, “Computation cluster validation in post-genomic data analysis,” Bioinformatics, Vol.21(15), pp. 3201 -3212, 2005.
[13] Q. D. Wu, L. Wang, Intelligent Particle Swarm Optimization Algorithm Research and Application, Nan Jing: Jiangsu Education Press, 2005.
[14] Q. D. Wu, L. Wang, Intelligent Ant Colony Algorithm and Application, Shanghai: Technology Press, 2004.
[15] J. L Deneubourg, S. Goss, N. Franks, “The dynamics of collective sorting: robot-like ant and ant-like robot,”
Proceedings First Conference on Simulation of Adaptive Behavior: from Animals to Animates, Cambridge: MIT Press, 1991.
[16] S. J. Liu. Ant Clustering Algorithm Based on Swarm Intelligence and Its Application, Shanghai: Fudan University, 2008.
[17] C. H. Cheng, A. W. Fu, Y. Zhang, “Entropy-based subspace clustering for mining numerical data,”
Proceedings of The Fifth ACM SIGKDD International Conference on Knowledge Discovery and Data Mining, pp. 84-93, 1999.
[18] W. L. Zhao, Y. X. Sun, Z. G. Zhang, “An improved ant colony clustering algorithm based on information entropy,” Journal of Shenyang Institute of Chemical Technology, Vol.29(4), pp. 296-300, 2005.
[19] Machine Learning Repository, http://archive.ics.uci.edu/ml/, Feb. 6, 2009.