Deformable Model Based Marked Controlled
Liver Ct-Scan Image Segmentation
B.Manasa
#1, L.Akhila
*2, G.Shivaji Babu
#3#Bachelor of Technology, ECE,
Lendi Institute of Engineering and Technology, vizianagaram 535005 JNTUK
Abstract-
Liver is a gland that plays a major role in metabolism with numerous functions in the human body, including regulation of glycogen storage, decomposition of red blood cells, plasma protein synthesis, hormone production, and detoxification. The diagnosis of liver disease is made by liver function tests, groups of blood tests that can readily show the extent of liver damage. If infection is suspected, then other serological tests will be carried out. Sometimes, an ultrasound or a CT scan is needed to produce an image of the liver. Physical examination of the liver can only reveal its size and any tenderness, and some form of imaging will also be needed. Computerized liver tumor segmentation on contrast-enhanced method is proposed for CT images. It is a challenging problem due to the great diversity of shape, intensity and texture. Deformable models such a 3D active surface a previously existing 2D active contour mode. GVF based active contour techniques are used to segmented the liver in the CT scan image and detects the fatty liver and identify the various problems. Pre-Processing is done by adaptive bilateral filter which remove noise improves contrast and preserves edges. A marker controlled active contour method is proposed for liver segmentation. The performance of the proposed method is evaluated.
Keywords - Liver analysis, bilateral filtering, active contour techniques, dice coefficients.
I. INTRODUCTION
Image segmentation is the process of partitioning an image into homogenous groups such that all regions are equal but the union of no two adjacent regions is homogenous. Efficient image segmentation is a difficult task in automatic image processing. Image segmentation is being used differently for different applications. For example, for machine vision applications, it can be seen as a bridge between low level and high level vision subsystems, where as in medical imaging it is a tool to draw anatomical structure and other regions of interest and in statistical analysis,. Previously mentioned examples state that image segmentation is present at every sight of image analysis[1].
Medical imaging method of diagnosis such as computed tomography(CT), positron emission tomography (PET), single photon emission Computed tomography (SPECT) ,and magnetic resonance imaging(MRI) are even used to examine the human body so as to detect malignant tumours at an early stage. In that case too we will get many images generated in a single examination which shows it as a complicate explanation. Several studies have noted that multiple phase imaging is
more useful for improving automatic segmentation accuracy[2]. A level-set method that identifies tumours by rough segmentation results [3,4] and a graph cuts-based[5]method for interactiveregional segmentation which selects an object and background as aseedhave also been proposed.
Chen et. al. made his attempt todeal with the main limitation of the level set methodologies that are initialization-dependent [6]. They proposed a methodwhere three level sets are started as close as to the final solution. Then, a defined post-processing has been applied to extract a well-segmented region and finally the results are merged together. A more successful and encouraging solution is proposed by Göçeri et al. in Reference[7]
where a fully automated level set approach is explained briefly. The method explains that automatically an initial contour, and computes weight ranges of each term in the applied energy function at each iteration during evolution.
However, the efficiency of the act of making regular of the level setfunction could be increased to get more successful results. Where as in other works, mainly deformable models based on different approaches over active contours are developed. The goal of active contours is to segment the objects that are difficult to determine the characteristics with a fixed already defined patternsince they are highly able to vary.
The flow graph of method is given in the fig:1. The functioning of the each block is given below. In detail:
Pre-processing: It is an important step in the data mining process.
Fig:1 flow diagram
Image segmentation:
Technically, image segmentation refers to the splitting of a scene into different components (thus to make easy the task at higher levels like object detection and recognition).
Scientifically, segmentation is a hypothetical middle-level vision task performed by neurons between low-level and high-level cortical areas.
Extracted object:
Extraction is the way to separate a desired object among all other objects.
Super imposed:
In graphics, superimposition is the technique of placing an image or video on top of an already-existing image or video, usually to add to the overall image effect, but also sometimes to hide something from view.
2.Pre-Processing
Adaptive Bilateral Filtering
Bilateral filtering smoothes images while preserving edges[11]. The method is non-iterative, nonlinear, local, and simple. It combines gray levels or colours based on geometric closeness and photometric similarity, and prefers near values to distant values in both domain and range. The bilateral filter proposed by Tomasi and Manduchi in 1998. Bilateral filter is a spatial domain filter, the response of the filter is given in the equation (1) (1)
Y(m,n) is the noise removed image.
is the response at [m,n] to an impulse I[k, l] and x [m,n] is the degraded image. Where is the center pixel of the window .
σd and σr are the standard deviations of the domain
and range Gaussian filters, respectively
(2) r(mo,no)is a normalization factor that assures that
the filter preserves average gray value in constant areas of the image.
A Gaussian filter filters the low frequency noise and restores the edges. Combinations and combined operations of domain and range Gaussian filters are applied here to give maximum weight pixels near the centre value, these combination of filters along with the bilateral filter at nearer to edge pixel gray level values is become highlighted out and Gaussian filter is slopping around the edge. This guarantee takes an average of adjacent pixel values and minimizes the gradient direction. Thus, we can have the bilateral filter greatly smooth’s the noise and restore the edge formations.
The Equation 2 consists of two exponential functions one is the operator of range filters and second the domain filter functions. The range filters included an offset (w) function and width is introduced in domain filters. If the value of offset is zero and width is constant the ABF acts as an ordinary bilateral filter. The variation of these two values or either one is fixed, the filters will show the effective performance to restores the image and sharpen the edges.
In ABF is the pixel gray level variation plays an important role during the training of filter
[2]. Its response shows more effect on the strength of edges, separates the regions and reduces the chance of increasing the noise. Laplacian of Gaussian(LOG) is applied to the image before filtering process is undergone.
There are many methods for solving this, some of them are as below,
3. Basic Types of Deformable Models
There are 2 basic types of deformable models [9,10,11]: parametric and geometric.
The formulation of minimizing energy - the base of deformable models on the basis of energy minimization is searching of parametric curve that minimizes weighted sum of internal energy and potential energy. Internal energy specifies tension or smoothness of contour. The Total energy minimization occurs when internal and external energies are equal.
The formulation of dynamic force - it is used in the cases in which it is more comfortable to form deformable model straight from dynamic problem with help of force formulation. These formulations facilitate the use of common external forces, even those which are note potential, e.g. forces which cannot be described as a negative gradient of potential energy function.
The geometric deformable models are based on the evolution curve theory and the level set method. At curves and surfaces evolution only geometric criteria are used that leads to the evolution independent from parameterization. As well as at the parametric deformable models, the evolution is connected to image data at objects edge finding. Forasmuch as the evolution is independent from parameterization, the curves and surfaces generating can be represented as the ‘level set’ of a multidimensional function. The result of this is that topological changes are easy to control.
Basic Definition
Active contour (a set of the coordinates of control points on the contour) is defined parametrically as
[8,9,10]:
(3)
Where x(s) and y(s) are x, y coordinates past the contour and s is the normalized index of the control points.
The energy function that describes active contours is composed of two components, the internal energy and the external energy. Internal forces make the curve compact [elastic forces – 1st member of the equation no 2] and limit its very acuminous deflections [bending forces – 2nd member of the equation no 2]. External forces tend the curve towards the object’s borders.
The internal energy - summation of an elastic energy and a bending energy - can be expressed as: Eint = Eelastic + EBend =
(4) where α is an adjustable constant that specifies continuity and β is adjustable constant that specifies contour curving.
The elastic and bending energies are then defined
following:
Eelastic=
(5)
Ebend= (v(s −1) −v(s) +v(s +1))2ds (6)
Energy of functional, which is minimized, can be expressed as:
Esnake *= =
Eint(v(s)+ Eimage(v(s))+ Econ(v(s)} ds (7)
where Eint is the internal energy of the curve, ,
Eimage is the energy of the picture andEcon are the
external limitations.
4. Active Contours
The concept of active contours models was first introduced in 1987 [8]. The first definition of active contours for segmentation tests can be called as snakes, and it was introduced by Kass et al. They
understand the snakes as curves that evolve toward specific features in the image such as edges, involving a process of minimization of energy. However, this snakes method has some limitations as segmentation depends on several parameters and on contour initialization. Snakes do not have sufficient flexibility to conform to complex shapes, and are not able to locate various regions in the same image or even interior regions.
To solve this problem, Malladi et al. and Osher and Sethian introduced the level set framework, where the zero-crossing of a characteristic curve function delimits the
Segmented regions. Level set techniques have a number of theoretical and practical advantages over other conventional surface models, especially in the context of deformation and segmentation.
It consists of a set of control points connected by straight lines, as it is showed in Figure 1. The active contour is defined by the number of control points as well as sequence of each other. Fitting active contours to shapes in images is an interactive process. The user must suggest an initial contour, as it is showed in Figure 3, which is quite close to the intended shape. The contour will then be attracted to features in the image extracted by internal energy creating an attractor image.
The liver performs a critical task in the human body; therefore, detecting liver diseases and preparing a robust plan for treating them are both crucial. Liver diseases kill nearly 25,000 Americans every year. A variety of image segmentation methods are available to
determine the liver's position and to detect possible liver tumours. Among these is the
limitations, such as local minima entrapment and initial contour dependency. The pre-processing method has a better ability to segment the liver tissue during a short time with respect to other mentioned methods in this paper. The proposed method was performed using Sliver CT image datasets. The results show high accuracy, precision, sensitivity, specificity and low overlap error, MSD and runtime with few ACM iterations.
The proposed algorithm has a simple calculation and low runtime.
Local minimal effect is decreased by the proposed pre-processing model, because it suitably can make the initial curve approximately close to the specified region boundaries.
The proposed method provides precise segmentation incorporating
prior knowledge about liver location and also using two energy intervals of healthy and disease tissues.
The user intervention has been tried to decrease so that it has been limited to adjust threshold values when needed.
Using GVF Snake to Segment Liver from CT Images
Liver segmentation on computed tomography (CT) images is a challenging task because the images are often corrupted by noise and sampling artifacts. Thus we choose GVF snake to have the task to be completed. Unfortunately, GVF snake use Gaussian function to generate the edge map.
To avoid this, a Canny edge detector is a good choice. Another problem during the segmentation is that GVF snake cannot works well with bad initialization. Fortunately we find that if the initial contour can cross the "bottleneck" of the deep concave, it can easily reach the boundary of liver. Thus an algorithm was developed to generate the initial contour automatically.
We introduce a new "maximum force angle map" to evaluate the direction variability of the GVF forces. This map can mark up the "bottleneck " and give a trace to run through it. There may be other trace we do not need in the map. With the help of transcendental knowledge about the liver, such as the position, the shape and the Hounsfield unit range of the liver, the correct trace can be found. The contour of this trace is suitable for using as initial contour for GVF snake. By this means we finally segment the liver slice by slice correctly.
Active Contours and their Utilization at Image Segmentation
Figure 3: Basic form of active contour
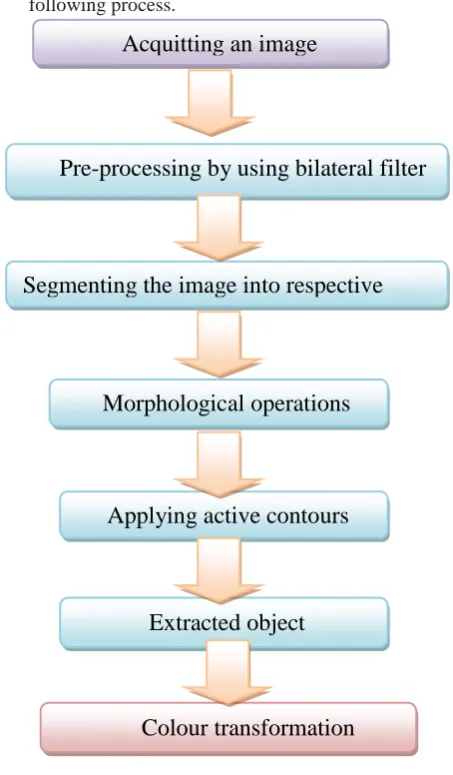
In order to have a complete segmentation on basis according to our requirement, we follow the following process.
Fig 4: proposed method
Firstly, we do the process of pre-processing which is the main process for completely knowing about the image with the use of a bilateral filter or median filter. Next , we should have to make the edges of the image to be filtered by using some morphological techniques. Then the affected area might be the cancer area can be segmented by applying the Active contour or any of the technique
Acquitting an image
Pre-processing by using bilateral filter
fil
filter
Segmenting the image into respective
regions
Morphological operations
Applying active contours
Extracted object
which results the image to be in the binary form. Now, the image will be super imposed on the original image which finally results for the colour transformation.
There are many methods for solving this, some of them are as below
Histogram equalization technique
Histogram equalization is a simple and effective image enhancing technique. But in some conditions, the luminance of an image may be changed after the equalization process, that is why it has never been utilized in a video system in the past. First, the image is decomposed into two equal area sub-images based on its original probability density function and thus they are equalized. Finally, we obtain the results after the processed sub-images are composed into one image. The simulation results indicate that the algorithm cannot only enhance the image information effectively but also preserve the original image luminance well enough to make it possible to be used in a video system directly.
MARKING METHOD:
Marking is techniques which initiates the contouring process. The suspicious area is marked by externally so that number of iterations are required to segmented the region are reduced.
5.RESULTS
The proposed methods are programmed with MATLAB and experimented on local Ct-scan liver data base available online. And also some images are taken from exiting work for comparison. The liver infections or suspicious regions are generally observed through high variations of the intensity levels. These regions are random in intensities and edges are so rough. In order to extract the regions are so difficult and gives false positives.
In our proposed method, initially a pre-processing is done by apply adaptive bilateral filter which remove the various types of noise during the acquisition process. The filter is very much effective to preserve the edge by including LOG in the process. The results of the filter are shown in the fig.
Fig: 5a) noised image b)pre-processed image Before apply the segmentation the suspicious regions is to be identified. In order to indentify various types of techniques are used such as histogram equalization and marking etc. The results are depicted as shown in the fig. 6
Fig:6 Histogram equalization process In the following part we are about to show some possibilities of the use of the active contour methods on liver images. However contouring techniques has extracted the regions by differential process or separation through energy of occupancy as mentioned equations. For better region segmentations morphological operators also include to improve the sharpness of the edges. As it is possible to see, in both cases the initiation points were given in tight vicinity of the sought contour for the algorithm to find the sought contour in the shortest time that is possible. The number of iterations depends on the size of the scanned surroundings – the bigger the scanned surrounding, the smaller the number of iterations. In the first case, it means in the application of the active contour method on the artificial picture, which is apparently easier, the result of the contour seeking is better as in the second case where the real picture was used. Active contour segmentation results are as shown in fig.
However, the sharp segmentation requires more number of iterations. Some may be over spelling the contouring process. To overcome this problem histogram equalization or marker controlled technique is incorporated along with active contouring process. The results are shown in Table:1. This table contains an pre- process image,
marked, segmented, colour image, superimposed image on input image for area identification. The efficiency of the algorithm is evaluated by applying number ct-scan images. later these results are compared with radiologist detections. It has shown optimum performance by observe ring these results. The results are evaluated by dice similarity coefficient.
TABLE 1: Results Of Proposed Method
6. CONCLUSIONS:
Computerized liver tumor segmentation on contrast-enhanced method is proposed for CT images. It is a challenging problem due to the great diversity of shape, intensity and texture. 3D active surface a previously existing 2D active contour mode. GVF based active contour techniques are used to segmented the liver in the CT scan image and detects the fatty liver and identify the various problems. The performance of the proposed method is evaluated. The active contour methods have many advantages liver CT-scan image but there are also some disadvantages to which we can count the fact of their dependency on the initial points of the contour, type of the picture and, the above mentioned, computing difficulty, as well the use of pre-processed operations, marking and histogram equalization techniques the active contour process can segment the suspicious regions with less number of false positive cases. The proposed methods are
more practiced in medical fields make them more advanced to solve complicate problems.
REFERENCES
[1] V.Dey, Y.Zhang, M.Zhong., 2010.A Review on image segmentation techniques.
[2] L. Rusko, G. Bekes, M. Fidrich, Automatic segmentation of the liver from multiand single-phase contrast-enhanced CT images, Med. Image Anal. 13 (2009) 871–882.
[3] D. Smeets, D. Loeckx, B. Stijnen, B. De
Dobbelaer, D. Vandermeulen, P. Suetens, Semi-automatic level set segmentation of liver tumors combining a spiralscanning technique with supervised fuzzy pixel classification, Med. Image Anal. 14 (2010) 13–20.
[4] J. Lee, N. Kim, H. Lee, J.B. Seo, H.J. Won, Y.M. Shin, et al., Efficient liver segmentation using a level-set method with optimal detection of the initial liver boundary from level-set speed images, Comput. Methods Progr. Biomed. 88 (2007) 26–38.
[5] Y. Boykov, G. Funka-Lea, Graph cuts and efficient N-D image segmentation, Int. J. Comput. Vis. 70 (2006) 109–131. [6] G. Chen, L. Gu, L. Qian, J. Xu, An improved level set for liver segmentation and perfusion analysis in MRIs, IEEE Trans.Inf. Technol. Biomed. 13 (2009) 94–103.
[7] E. Göçeri, M.N. Gürcan, O. Dicle, Fully automated liver segmentation from SPIR image series, Comput. Biol. Med. 53(2014) 265–278.
Models, in Proceedings of 1st International Conference on Computer Vision, London, 1987, pp. 259-267
[9] Marek J., Demjénová E., Tomori Z., Janáček J., Zolotová I., Valle F., Favre M., Dietler G.: Interactive Measurement and Characterization of DNA Molecules by Analysis of AFM images, Cytometry Part A, Volume 63A, Issue 2, March 2005, pp. 87-93, Wiley-Liss, Inc.
[10] Demjénová E., Zolotová I., Tomori Z.: Interactive Segmentation of Fibrelike Objects, in Proceedings of 2nd Slovakian-Hungarian Joint Symposium on Applied Machine Intelligence, SAMI 2004, Herľany, Slovakia, January 16-17, 2004, pp. 259-268, ISBN 963 7154 23 X.