Influence of Crown Effects in Losses:
Application on South Cameroon
Interconnected Network
Ndjiya Ngasop1, 2 and 3, Nana Tayou Franklin1 and 3, Ernest Kiata3 and 4and Haman-Djalo3 and 4
#1
Department of Electrical Engineering, Energy and Automation, National School of Agro-Industrial Sciences (ENSAI), University of Ngaoundere, Cameroon.
2
Department of Process Engineering, National School of Agro-Industrial Sciences (ENSAI), University of Ngaoundere, Cameroon.
3
Laboratory of Energy, Signal, Imagery and Automation (LESIA), ENSAI/University of Ngaoundere, Cameroon.
4
Department of Physics, Faculty of Sciences, University of Ngaoundere, Cameroon.
ABREVIATIONS
AAAC: All Aluminium Alloy Conductors ACSR: Aluminium Conductors Steel Reinforced BT : Basse Tension
BTA/BTB: Basse Tension A/ Basse Tension B CEI: Commission Electrotechnique International EHV: Electrical High Voltage
ENEO: Energy of Cameroon
HTA/HTB: Haute Tension A/ Haute Tension B MATLAB: MATrix LABoratory
MINEE: The Minister of Water and Energy MT: Moyenne Tension
NASA: National Aeronautics and Space Administration
RIE: East Interconnected network
RIN: North Interconnected network
RIS: South Interconnected network
Abstract
Crown effect, today is a well-known phenomenon, manifest itself in the form of aluminous bluish sheat which appears around a thin wire, when it is then carried at a sufficient potential. The creation of crown discharger in electrical energy transportation lines disrupt the normal functioning of electrical network elements thus conductive lines and isolators. The presence of this crown effect increases significantly powers losses, which can be comparable, and also being superior to words Joules losses in conducting lines. In this work, the study of crown effect of factors responsible of energy casualty on the southern interconnected network (RIS) of Cameroon will be studied by sampling calculation based on Peek formulae. For that, we use lines parameters of 225 kV of the southern Cameroonians interconnected network knowingly Oyomabang (Yaoundé), Song-Loulou-Logbaba (Douala) and Song-Loulou-Kribi. Also, thanks to the software RETScreen meteorological data of different towns obtain introduced were
simulated on the software Matlab/Simulink so as to give an estimation of crown losses on electrical lines of transportation of Cameroonians RIS. Specifically, we studied the crown effect and its influence on losses in transportation lines and determine losses on the different lines of 225 kV for hottest month (April) and the coldest month (August) of the year 2016. Results of different simulations shows that the crown losses for months of April and August are respectively526,44 kW and 4393,45 kW for Song-Loulou-Logbaba line, 566,25 kW and 6685,24 kW for Song-Loulou-Kribi line, 1000,83 kW and 9913,03 kW for Song-Loulou-Oyomabang line. These results shows that crown effect it source of none negligible losses on electrical networks Very High Voltage. This last one have to be taken into consideration by the network managers during the designing of an electrical line to transport more efficiently and more economically its energy.
Keywords - Losses (losses), Crown Effect, Peek
Formulae, High Voltage Line.
I.INTRODUCTION
classified into two types that is technics losses and non technics losses (Shahzadet al., 2015; Gueye, 2006; Eric, 2012). Thus, energy consumed not registered constitute the principal component non technics losses whiles the technics losses and magnetics results from energy dissipated in conductors and used material for the transportation and the distribution of electrical energy (Shahzadet al., 2015). These losses such as losses due to Joules effect, magnetic sin the transformer (Iron losses and losses due to crown effect) directly depends on the network characteristics and its functioning mode. The name « crown effect » comes from the fact that, in the case of a conducting wire sufficiently thin the phenomenon manifests with the appearance of violet blue luminous crown around the wire, when the voltage attain a certain threshold (Benamar, 2008; Enesi et al.; 2013). The thickness of the luminous sheath keeping on increasing as the voltage of the conductor increases. This effect (rare in the voltage level of at least 200 kV) is not desirable on the electrical lines, but issued by the industry, such as, in the production of ozone, in photocopiers. The crown discharge can be positive or negative. It belongs to the class being said autonomous or necessarily no external ionization source for persisting (Hamouimeche, 2011). Crown effect is from origins of radio phonics and televisual interference, telephonic, of audible noise, of mechanics vibration on lines and important electrical losses (Potvin, 2000; Harting, 2010). The increase in need in energy drives electricity companies to transport this at higher voltage levels, having as consequence the appearance of crown losses on the transportation. Thus, we ask ourselves the following question: how do we have to evaluate losses due to crown effect on a high voltage electrical transportation network?
In this work, the study of crown effect and of responsible factors will be studied with sample calculations based on the model the most used in the literary such as the Peek model. The objective of this study is to give an estimation of crown losses on electrical lines of Cameroonians RIS. More specifically, i will be studying the influence of different parameters on crown losses and to determine their value on each transport line of 225 kV of RIS, with a hypotheses the high voltage transport on long distances favours the crown discharge, the spacemen in between the conductors reduces the formation of crown effect. The methodology of this study will consist of modeling and simulating the crown losses model proposed by Peek with the aid of Simulink of the software Matlab. Using lines parameters of HTB of 225 kV of RIS and the software RETScreen will be used for acquiring meteorological data of the year 2016 of towns crossed by electrical lines, to observe the influence of different lines with respect to the temperature. This article in its articulation, present firstly the materials and methods which show in to
detail the study the influence of crown effect in losses: Application to the interconnected network Southern Cameroon, so the title results and discussion of the influence of crown effect in the losses followed by a critical comparison thanks to the literature and finished with a conclusion and of perspectives.
II. MATERIALS AND METHODS
A. Materials
For the good run up of our work, we shall use a computer, a software Matlab/Simulink 2014a (8.3.0. 532) and the structure of the southern interconnected network. The domain voltage of the high voltage used in the RIS for the transport of energy are of 225 kV and of 90 kV. RIS is a network constituted by two types of principal production sources (hydroelectric centers and thermal center) which supplies in electricity six big region of southern Cameroon except the East region (Annex 1) (the six region of the country : South, Littoral, West, center, South-West and North-West. it is subdivided into three bigger zones : the center zone constituted of the center and southern region ; the western zone constituted of the West, South-West and Nord-West region ; and the Littoral zone.) This network contains 14 nodes interconnected constituted of HTB lines of 225 kV and of 90 kV principally with conductors in Almelec. They permits the evacuation of the production of centers existing to the consumption centers. The table below present the three HTB lines of 225 kV at the beginning of the barrage of Song-Loulou such as:
Tableau 1 : HTB line of Cameroonian RIS.
Electric lines Transported
Voltage (kV)
Section
(mm2)
Length line (km) Song Loulou
-Mangombé- Oyomabang
225 366 225,84
Song Loulou-Mangombé- Logbaba
225 366 93
Song Loulou-Mangombé- Kribi
225 366 162,84
Figure 1: Transport network of ENEO of 14-Nodes (Ndjiya et al.; 2017).
Also, we used the management software of proper energies RETScreen Version 6.0.7.55 of 2016. RETScreen is a system management software of proper energies for the reliability analysis of projects of energetics efficiency, of renewable energies and of cogeneration and for the energetics performance analysis in continues. This tool of analysis contains databases of reference value, hydrologic and climatic which also upstanding climatic data obtained by satellite in real quasi time of the NASA. Data used in this study are those of the year 2016 and are represented in a collection of tables, which we put in annex 2.
B. Methods
a). Methods of simulating the crown losses
We saw in the literature several experimental models of losses by the crown effect, which have difference between them by the tension level and the number of parameters taken into consideration. We can cite the Peterson model, the Ryan and Henline model, the Nigol and Cassan model, the Anderson-Baretsky-Mc Carthy model (Project EHV). In our work, we have used the Peek model, which is the most, used in the literature.
To evaluate the thresholds of the crown effect at the surface of the anode, Peek, inspired by the theory of Townsend proposed in 1920, suggested for the first time an empiric law established in cylindrical geometry in ambient air, and in alternative voltage. This equation is name from the Peek’s law. These equations are demonstrated in the document (Peek, 1920).
b). Appearance tension of the crown effect: Critical disruptive Tension
Given the figure 2 below representing a single-phase transport line. Let r be the radius of each conductor and D the distance between the conductors in that D >> r. In this single phase transmission line, let qA = q the charge by unit length
on the conductor A and which qA = -qB = q on B.
If the service tension V, the potential of the conductor A in relation to the neutral plan O will be
V/2 and that of conductor B will be- V / 2.
Figure 1: Single phase transport line
(Sivanagarajus and Satyanarayana, 2009).
The field intensity at point P due to the line charges will be:
x
D
x
q
E
x1
1
2
(2.1)The potential difference between the conductors is:
D rr
r D
r
x
dx
x
D
x
q
dx
E
V
1
1
2
(2.2)
D rr
x
D
x
q
V
ln
ln
2
(2.3)
D
r
q
r
r
D
q
V
2
ln
ln
2
(D>>r) (2.4)
With (D >> r), D-r = D, the charge q will be:
r
D
V
q
ln
(2.5)
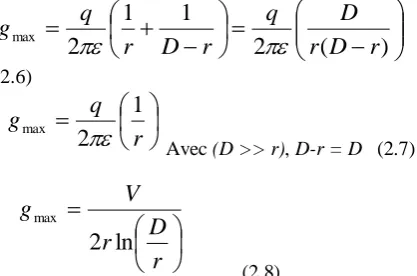
The superficial gradient of air noted by g.
The value of g is minimum if x = D/2 and maximum when x = r
)
(
2
1
1
2
maxr
D
r
D
q
r
D
r
q
g
(2.6)
r
q
g
1
2
max
Avec (D >> r), D-r = D (2.7)
r
D
r
V
g
ln
2
max(2.8)
on a three-phase line V0 represent the tension
between the phase and the neutral.
r
D
r
V
g
ln
.
0 max (2.9)
r
D
g
r
V
0.
maxln
(2.10)
The critical disruptive tension is define as a minimal tension from which the ionization of the conductor is produce (Sivanagarajus and Satyanarayana, 2009). This correspond to the gradient at the surface and is equal to the resistance of rupture of air. This dielectric resistance is noted
by
g
0 and is equal to 30kV / cm pic or to 21,21 kV/cm (r.m.s) in normal conditions of temperature and pressure (CNTP) that is to say 25°C and 760 millimeter mercury (mm Hg). This tension is noted by EC and is express as:
r
g
r
V
d0 0ln
D
(2.11)
This relation is true for loses conductors (m = 1) and in the CNTP.
From the experimental results obtain by Peek, the critical disruptive tension for rigorous and polluted conductors is inferior to that of loses conductors (Peek, 1920). It is calculated according to the
formula:
m
0.
.
V
d0 where
represent the airdensity and
m
0 is coefficient which takes in to account the state of surface of the conductor (the factor of conductor’s irregularity) and takes into account the influence of pollution of the conductor.Tableau 2: Factor of conductor’s irregularity.
In normal meteorological conditions, the value of
is 1, the critical disruptive tension is equalto
m
0.
V
d0 and the value ofm
0 varies from 0,8 to 1 during bad meteorological conditions. The value of
is calculated according to the formula:
T
P
273
.
392
,
0
(2.12)Where P is the barometric pressure millimeter mercury (mm Hg) and T, the temperature in degree centigrade (°C).
So, the critical threshold tension is express by:
D
ln
.
0 0 0
r
r
m
g
V
d
phase
kV
/
(2.13)With:
r: radius of conductor (cm),
D: spacemen between conductors (cm).
By replacing the equation (2.12) in (2.13) we have:
phase
kV
r
r
T
P
m
g
V
d/
D
ln
.
273
.
392
,
0
0 0 0
(2.14)The value of the critical disruptive tension is considerably reduce during bad atmospheric conditions like rainfall.
r
D
r
r
m
g
V
V Vln
.
301
,
0
1
.
.
0
(2.15)The term
r
.
301
,
0
1
: is called Peek’s correction, it takes into account the fact that the more the radius of the conductor is small the more it is difficult to ionize this conductor.The difficulties in ionization is because the electrical field decrease rapidly by moving away from the conductor (Hakim, 2001).
By replacing the equation (2.12) in (2.15) we have:
r
D
r
T
P
r
m
T
P
g
V
V Vln
273
.
392
,
0
301
,
0
1
.
273
.
392
,
0
0 (2.16) The value of the factor of roughness (mv) isdifferent from the factor of irregularity (m0). It can
be taken as a unit for smooth conductors, 0,93-098
for the rigorous expose to severe atmospheric conditions and 0,72 for pour trend conductors.
As the surface of the conductor is irregular, the crown losses does not start simultaneously on all the surfaces and is called local crown.
d). Power losses due to crown effect
Power losses due to crown effect is accompany by loss in energy dissipated in the form of light, of heat, of sound, and of chemical action, it also depends on climatic conditions (Muhammad and Ghous, 2015).
Conductor Factor of surface m0
Smooth and new Smooth, oxidize Strand
By default
1
Their effects are cumulative, permanent and are produce without warning on the HT network lines. According to the Peek’s formula demonstrated by (Peek, 1920), the crown loss express by:
x
10
3
.
.
25
.
241
52
0
V
wV
L
D
r
f
P
d
(2.17) With: V = Voltage between lines in kV
w = meteorological factor (w = 1, good meteorological conditions; w = 0,8 for the bad meteorological conditions).
f = Frequency in Hz L = Length of line in km
By replacing (2.13) in (2.17) we have:
By replacing (2.13) in (2.17) we have:
.
ln
x
10
3
.
.
25
.
241
2 50 0
L
r
D
r
m
wg
V
D
r
f
P
f). Factors influencing the crown losses
In this section of our studies, we are presenting the different parameters influencing the crown losses. To study the impact of each parameter, we will simulate the different standards under the environment Simulink of Matlab by using the characteristics of the South Interconnected Network (RIS) and the meteorological data obtained from the software RETScreen.
1). The transport network RIS
In our study, we are also supposing that the transport network of the RIS of 225 kV is constituted exclusively of aerial lines. According to the Cameroon network management, these lines have a section of 366 mm2 which correspond to a diameter of 24,9 mm according to the abacus of conductors in Almélec. Therefore, we will consider that it is a stable three phase network and that the spacemen between the conductors on all the chosen lines we be the same, as such we consider:
U
D
0
,
0075
x
3
x
(2.20) With U : The transported voltage in kV. From (2.20) the spacemen between the line conductors that we have chosen will be D = 3m for a transported voltage of 225 kV.2). The meteorological data
The standard of crown losses (Peek) the we will simulate is a function which depends on atmospheric conditions that is which depend on the correction factor of air density where the lines HT are transported which is inversely proportional to the losses. The meteorological data obtain from the software RETScreen (which takes in to consideration the readings of the NASA satellite) according to that of different towns, the starting and
ending of each High Tension line for the year 2016. We are using the annual temperature and pressure for the month of April, which correspond to the hottest month of this year. The data used permit us to simulate and study the influence of the different parameters on the South Interconnected Network of Cameroon.
The standards of the crown losses takes into consideration several parameters which have influence on it formation on the Electric network HT, we can cite the radius of the conductor, the frequency, the spacemen between the conductors, the pressure, the temperature, the density, the voltage of the line.
III. RESULTS AND DISCUSSIONS
In this section, it’s a question of presenting the results obtained and to do an explicit analyses of their obtainment.
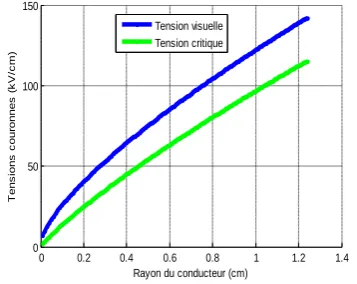
Visual tension and disruptive critic tension in function of radius
The following figures presenting the characteristics of disruptive critic tension (in green) in function of the radius of the conductor, the visual tension (in bleu) in function of the radius of the conductor.
0 0.2 0.4 0.6 0.8 1 1.2 1.4
0 50 100 150
Rayon du conducteur (cm)
T
e
n
s
io
n
s
c
o
u
ro
n
n
e
s
(
k
V
/c
m
)
Tension visuelle Tension critique
Figure 3: The tension of the crown losses in function of the radius of the conductor.
We observe on the figure above that critic and visual tension increase proportionally with increase in the radius of the conductor. The curve shows us that the visualisation tension of the crown losses is superior to the disruptive critic tension for it formation implies ionisation and elevation of electrons to an excited state. This excitation produces light and electromagnetic waves, which are visible to the necked eyes in darkness under the form of luminous crowns around the conductor. The curve obtained is in accord with that presented by Enesi
Influence of conductors radius on the losses
The radius of the conductor constitute one of the important parameter which influences the joules losses and the losses due to the crown.it one of the key points in the conception of electric networks. The figure below represent the profile of crown losses in function of the radius of the conductor. (V
= 225 kV, w = 1, D = 300 cm, f = 50 Hz,
= 0,9401, m0 = 0,85, g0 = 21,2 kV/cm).0 0.2 0.4 0.6 0.8 1 1.2 1.4
0 2000 4000 6000 8000 10000
Rayon du conducteur (cm)
P
e
rt
e
s
c
o
u
ro
n
n
e
s
(
k
W
/P
h
a
s
e
)
L=160 km L=100 km L=60 km
Figure 4: Crown losses in function of conductor radius.
Analyzing this circuit shows that the crown losses reduces with increase in conductor diameter. From the expression (2.14) of the critical tension Vd0 it is
approximately proportional to the radius of the conductor, this implies that when it increase it increases the value of the tension Vd0 and at the same
time reduces the difference between the functioning tension V and the disruptive critic tension which lead to the reduction of the crown losses. This profile accord with the (Harting, 2010; Krasniqi and al., 2011; Inesi and al., 2013; Zakariha, 2016). We also observe that on this curve the crown losses are proportional to the distance covered by the transport lines.
Influence of the distance between the conductors under losses
The influence of the distance between the conductors under the crown losses is shown in the figure below, which represent the profile of the crown losses in function to the spacemen between the conductors by varying the distance D between 0 and300 cm.
0 50 100 150 200 250 300
0 2000 4000 6000 8000 10000 12000 14000 16000 18000
Espacement entre les conducteurs (cm)
P
e
rt
e
s
c
o
u
ro
n
n
e
s
(
k
W
/P
h
a
s
e
)
Figure 5: Crown losses in function to the distance between the conductors.
At constant pressure, the threshold of absorption of the crown discharges increases with the distance between the conductors D. As a result, the increase of this distance makes difficult the transition to the arc responsible for the visible during the manifestation of the crown discharges. Therefore, each time there is less space between two parallel conductors, the electrostatic constraint between one conductors to the other are of a disadvantage due to the crown losses. To avoid this, the space between the conductors have to be more important so that there will be less electrostatic stress between them. We also observe that crown losses are inversely proportional to the spacemen between the conductors. During the conception of a HT transport line, if the distance between the three phase conductor is made to be large then the crown losses can be reduce to it maximum and can even disappear, for it variation affect the critical tension responsible for the initiation of losses.
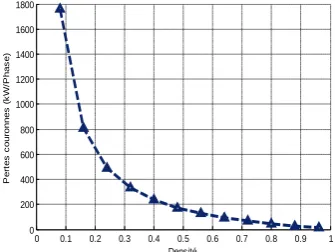
Influence of density on crown losses
Air density is part of the parameters, which the crown losses depends on, it is like to the climatic conditions. The figure below represent the profile of losses in function to the density by varying the density from 0 to 1 with the calculation conditions as follows: V = 225 kV; D = 300 cm; r = 1.245 cm; w = 1; f = 50 Hz; g0 = 21.2 kV/cm; m0 = 0.85; L = 93
km.
0 0.1 0.2 0.3 0.4 0.5 0.6 0.7 0.8 0.9 1 0
200 400 600 800 1000 1200 1400 1600 1800
Densité
P
e
rt
e
s
c
o
u
ro
n
n
e
s
(
k
W
/P
h
a
s
e
)
Figure 6: Crown losses in function to the density.
Observing this curve, we can say that the increase in the density of air reduces practically the crown losses. It depends on the meteorological conditions, as the number of ions in air is important during thunderstorm, raining time, and of the humidity surrounding the lines. Referring to equation (2.14) and (2.18), we can notice that the density of air influences the critical tension of appearance of the crown effect. It increase leads to the elevation of the tension Vd0 and to drop in the
difference
0
3
V
dV
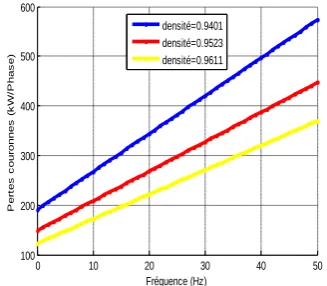
Influence of frequency on crown losses
The standard of crown losses developed Peek takes into consideration the frequency of the transport network of lines HTB. It is one of the fundamental values for the exploitation of network, there exist functioning frequencies of 60 Hz (North America, a part of Japan and South America) or 50 Hz for the rest of the world. The figure below shows the evolution of crown losses in function of the network frequency. It is obtained from the Simulink
standard of the figure 31 for different values of the air density with frequency f which varies from 0 to 50 Hz. The calculation conditions are as follows: V = 225 kV; D = 300 cm; r = 1,245 cm; w = 1; g0 =
21.2 kV/cm; m0 = 0.85 and L = 225.84 km.
0 10 20 30 40 50
100 200 300 400 500 600
Fréquence (Hz)
P
e
rt
e
s
c
o
u
ro
n
n
e
s
(
k
W
/P
h
a
s
e
)
densité=0.9401 densité=0.9523 densité=0.9611
Figure 7: crown losses in function of frequency.
The above figure shows us that the higher the frequency of the network the higher the crown losses. By comparing with the transportation of direct current, the losses in alternating current will be more as the variation of frequency on the generated network on harmonic lines that increases the crown losses and disrupt the network. On this same figure, we also observe that the crown losses are practically linear with the variation of the frequency and when the density increases the losses are reduce, giving results as that of the previous section. These results are similar to that of (Inesi and al., 2013; Muhammad and al., 2015).
Influence of temperature on the critical tension
The figure below represent the profile of the critical tension in function of the temperature, this is obtain by varying the temperature from 29 to 39 °C with the calculation condition as follows: D = 300 cm; r = 1.245 cm; g0 = 21.2 kV/cm and m0 = 0.85.
On this figure, we have considered the temperature of the month of April for the towns of the beginning and the ending of the different electric lines HTB of the RIS chosen, knowingly: The Song-Loulou-Oyomabang (Yaoundé) line in red, the temperature varies from 29 to35 °C; The Song-Loulou-Logbaba (Douala) line in bleu, the temperature varies from 29 to 39 °C and The
Song-Loulou-Kribi line in yellow, the temperature varies from 29 to 34 °C.
We observe that the critical tension decrease with an increase in the temperature. When the temperature increases with a constant pressure, the dielectric rigidity of air reduces which lead to a drop in the critical tension.
By referring to the equation (2.14), we notice that the critical tension is inversely proportional to the temperature at an atmospheric pressure. Therefore on the figure, the pressure (P = 765 mm Hg) of the Song-Loulou-Kribi line in yellow has a higher critical tension than the other lines. An increase in the pressure leads to an elevation of the critical tension which accord with the literature.
29 30 31 32 33 34 35 36 37 38 39
115 116 117 118 119 120 121
Température (°C)
T
e
n
s
io
n
p
e
rt
u
e
b
a
tr
ic
e
c
ri
ti
q
u
e
(
k
V
)
Song-loulou-Oyomabang, Pression=759mmHg Song-loulou-Logbaba, Pression=761mmHg Song-loulou-Kribi, Pression=765mmHg
Figure 2:Critical tension per line in function to the temperature.
Influence of temperature on crown losses
The figure below present the evolution of crown losses in function of the temperature of the environment where the electric lines are being passed, obtained for the different values of air pressure with the temperature with varies from 29 to 39 °C. The calculation conditions are as follows: V = 225 kV; D = 300 cm; r = 1.245 cm; w = 1; g0 =
21.2 kV/cm; f = 50 Hz; m0 = 0.85 and L = 93 km.
On this figure, we have considered the temperatures of the month of April of the town of the beginning and ending of the electric line HTB of the RIS chosen. For this profile, we have varied the temperature of the Song-Loulou-Logbaba (Douala) line from 29 to 39 °C which corresponds to the temperatures of two towns.
We observe that with the increase of temperature at an ambient pressure, the dielectric rigidity of air reduces and this favors the crown discharge. This is because in this case the average free ways of molecules in the air increases.
critical tension and favors the increase of losses at constant pressure.
29 30 31 32 33 34 35 36 37 38 39
200 300 400 500 600 700 800 900
Température (°C)
P
e
rt
e
s
c
o
u
ro
n
n
e
s
(
k
W
/P
h
a
s
e
)
P=760mmHg P=750mmHg P=740mmHg
Figure 3: Crown losses in function of temperature.
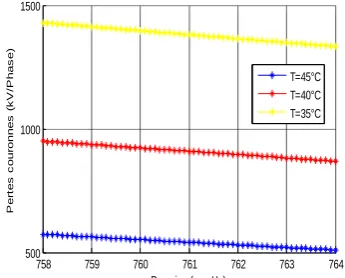
Influence of pressure on crown losses
The figure below shows the profiles of the crown losses in function of ambient temperature where the passage of electric line sis obtained for different values of the air temperature with pressure P which varies from 758 to 764 mm Hg. The conditions of calculation are as follows: V = 225 kV; D = 300 cm; r = 1.245 cm; w = 1; g0 = 21.2 kV/cm; f = 50 Hz; m0
= 0.85 and L = 162.8 km.
We noticed that an increase in the air pressure is accompanied by a corresponding increase in the tension of appearance of the crown effect (equation (2.14)) because of the drop of the average freeways, preventing the electrons from acquiring sufficient energy between the collisions. This increase in pressure is transform by the reduction of the crown losses at constant temperature.
758 759 760 761 762 763 764
500 1000 1500
Pression (mm Hg)
P
e
rt
e
s
c
o
u
ro
n
n
e
s
(
k
V
/P
h
a
s
e
)
T=45°C T=40°C T=35°C
Figure 4: Crown losses in function of ambient pressure.
Influence of line tension
In thunderstorm or bad atmospheric condition des conditions, like snowfall, rain, fog and hailstone, reducing the critical disruptive tension and increasing crown losses effect. The crown discharge starts when the exploitation tension of the transport network is Superior to the disruptive critical tension, and this will be the highest when the difference between the two tensions will be higher.
The figure below shows the profile of the crown losses in function to the transport tension on the network for different climatic conditions obtain by varying the tension V from 0 to 225 kV. The
conditions of calculations are as follows:
= 0.9401 (T = 39 °C, P = 759.8 mm Hg), f = 50 Hz, D = 300 cm, r = 1.245 cm, g0 = 21,2 kV/cm, m0 = 0,85,L = 93 km.
In this figure, we have considered the temperature of the month of April (T = 39 °C) of the Song-Loulou-Logbaba line as that of good meteorological conditions because in this period, the rains are less and the environment is dry (dry season), in this profile the meteorological factor W is equal to 1 (curve in green). We have also trace on the same the profile of losses in function of the line tension for bad meteorological conditions by taking as reference the month of April and the meteorological factor here is equal to 0.8.
0 50 100 150 200 250
0 2000 4000 6000 8000 10000 12000 14000 16000
V = 200.4
V = 160.3
Tension de ligne (kV)
P
e
rt
e
s
c
o
u
ro
n
n
e
s
(
k
W
/P
h
a
s
e
)
Bonnes conditions météorologiques, w = 1 Mauvaises conditions météorologiques, w = 0,8
Figure 11: crown losses in function of line tension.
We can observe on the above figure that the profile in green, the disruptive critical tension is Vd0
= 200,4 kV, meanwhile on the profile in red it is Vd0
= 160,3 kV between the phases ; this shows that the crown discharges start more faster in unfavorable meteorological conditions because it tension is more weaker than that of favorable meteorological conditions. Therefore, the crown losses will be higher when the disruptive tension becomes weaker because the different between the network transport tension and the critical tension will be higher. We can notice that the transport tension of the network electrical energy add directly to the crown losses that is to say the higher the tension the higher the losses on the network.
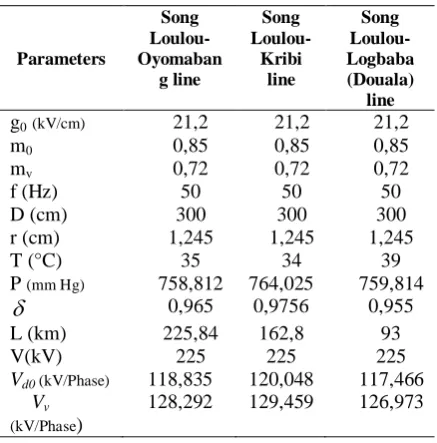
Estimation of crown losses on electrical line of RIS
to the data of the month of April 2016. For these two parameters, we will take the higher value between the starting and the ending town of each line. The table below shows all these parameters:
Tableau 3: Parameters for calculations for each line.
The parameters of the month of April will be taken as for that of favourable climatic conditions because it correspond to the month with the highest temperature during the year 2016 (dry season in Cameroon), here the meteorological factor will be w =1; For unfavourable climatic conditions, which correspond to the month with abundant rain fall, humidity (raining season in Cameroon), the month of August will be indicated because the monthly temperature is the lowest for the year 2016. To estimate the crown losses for August in relation to the month of April which is the reference, the meteorological factor will be taken as w = 0,8.
The table and the figure below present the two results.
Tableau 4: Estimation of crown losses on the lines of 225 kV of RIS.
Lines
Losses (kW)
Song Loulou-Logbaba
Song
Loulou-Kribi
Song Loulou-Oyomabang
April 526,449 566,256 1000,832
August 4393,456 6685,241 9913,036
Figure 5: Crown losses on the different lines Series 1: in August, Series 2: in April.
The above table and figure represent the crown discharges for the month of April and August. We can notice that the losses are higher for the month of August (more humid) than for April (drier). We also notice that on the Song-Loulou-Logbaba line, the losses for the month of August are equal to more than 8 times that for the month of April; for the Song-Loulou- Kribi line, are more 11 time that of the Song-Loulou-Oyomabang line, correspond to more than 9 times the losses for the month of April.
This figure shows that the dependent of the crown losses from climatic conditions, because for two months of the same year have different seasons (dry season and dry raining), the losses are very different and varies in function of the type of season. Thanks to this estimation of crown losses base on the Peek model, we can say that the Loulou-Oyomabang line have more losses than the Song-Loulou-Kribi line and Song-Loulou-Logbaba.
The crown losses contribute same as the joule losses to the diminution of energy transported on an electric network. As such, it has to be taken into consideration during the reducing or the evaluation of losses on a high-tension electrical energy transportation network.
CONCLUSION AND PERSPECTIVES
The objectives of this study was to evaluate the crown losses in an air electric transport network HTB in a part of Cameroonian electrical network. The work realized consisted of presenting the materials, which made the topic of our study, which is the South Interconnected Network (RIS) of Cameroon, more precisely the high-tension lines 225 kV, next the software RETScreen provided the temperature and pressure readings for the various towns having this electric lines. Finally, we used the crown losses model proposed by Peek, which is mostly use in the literature and the simulation thanks to RIS Cameroonian parameters under the environment Simulink of the software Matlab and then showing the influence of the different parameters on the crown discharges. At the end, we have presented the results of this study. The profiles of the different parameters influencing the losses are Parameters
Song Loulou-Oyomaban
g line
Song
Loulou-Kribi line
Song Loulou-Logbaba (Douala)
line
g0(kV/cm) 21,2 21,2 21,2
m0 0,85 0,85 0,85
mv 0,72 0,72 0,72
f (Hz) 50 50 50
D (cm) 300 300 300
r (cm) 1,245 1,245 1,245
T (°C) 35 34 39
P (mm Hg) 758,812 764,025 759,814
0,965 0,9756 0,955L (km) 225,84 162,8 93
V(kV) 225 225 225
Vd0 (kV/Phase) 118,835 120,048 117,466
Vv (kV/Phase)
all in accord with the literature. The estimation results of the losses on the different lines shows that the Song-Loulou-Oyomabang have losses of 1000,8327 kW (in April) when the temperature is very and of 9913,0360 kW when the temperature is very low (in August), for the Song-Loulou-Kribi lines, they are of 566,2561 kW (in April) and of 6685,2413 kW (in August) and the Song-Loulou-Logbaba lines, the losses are of 526,4482 kW (in April) and of 4393,4555 kW (in August). Therefore, we can conclude that the Song-Loulou-Oyomabang lines experience many crown losses more than other lines of 225 kV of the RIS.
These results shows that the crown effect is a non-negligible source of losses on the high tension electrical network, this one has to be taken in to consideration by network managers during the construction of electrical lines in order to transport more effectively and more economically it energy. This result will not be a perfect one since it is the first we are proposing. It has permit us to envisage some perspective like the study and the evaluation of the crown losses with specialist software (COREF, P PSICE etc…) and compare them, the evaluation of percentage losses on the assembly of Cameroonian transport network in relation to the joule losses. The study of this phenomenon on the network in view of the Cameroonian network interconnection with the neighboring countries propose a model of crown losses for the Cameroonian network.
ACKNOWLEDGEMENT
We thank engineer NEBA Cornelius AMBE, Christopher MORIKANG AWAH and KAMGA Thomas for the reading and the translation of this document into the English version.
REFERENCES
[1] Anonyme (2014) : Les moyens de production d’énergie
électriques et thermiques. Agence de l’Environnement et de Maitrise de l’Energie (ADEME), Bretagne, France, 39 p.
[2] Anonyme (2000): Méthodologie de calcul du taux de
pertes de transport. Rapport Hydro-Québec, direction affaires réglementaires et tarifaires, 15 p.
[3] Basit A., Imran S. (2016) : Effect of Corona on
Transmission Lines due to itslinkedParameters. International Journal of Scientific& Engineering Research, Vol 7, N° 9, pp 581-583.
[4] Benamar B. (2008) :La faisabilité de l’électrofiltration
d’une atmosphère chargée en poussières de bois : étude expérimentale et numérique. Thèse de doctorat, Université Henri Poincaré, Nancy, 157 p.
[5] Boudjamaa M. A., Sebti R. (2012) : Modélisation des
phénomènes de pollution des isolateurs de Haute Tension. Mémoire de master, Université KasdiMerbath-Ouaragla, Algérie, 79 p.
[6] Brahami M., Tilmatine A., Meghnefi F., Sayah H.
(2008) : Prédétermination des grandeurs liées aux conséquences de l’effet couronne sur les lignes haute tension. Mediamira Science Publisher, Vol 49, N° 1, pp 47-53.
[7] Brian H. (2011) : A Guide to MATLAB for
Beginners and Experienced Users. Cambridge UniversityPress.
[8] Courtecuisse V. (2009) : Supervision d’une centrale
multi source à base d’éoliennes et de stockage d’énergie connectée au réseau électrique, Thèse de doctorat, Ecole Nationale Supérieure d'Arts et Métiers, France, 297 p.
[9] Draidi A. (2016) : Répartition optimale des puissances
utilisant les techniques de l’intelligence artificielle, Thèse de doctorat, Université des Frères Mentouri Constatine, Algérie, 141 p.
[10] Enesi A. Y., Tsado J., Mark N., Ahmed A. (2013) :
Power loss due to Corona on High Voltage Transmission Lines, Journal of Electrical and Electronics Engineering (IOSR-JEEE), Vol 8, N°3, pp 14-19.
[11] Eric F. (2012) : Les pertes techniques dans les réseaux de
transport et de distribution de l’énergie électrique. Fiche technique PRISME, Rapport sur la planification énergétique sectorielle, Fiche N08, 8 p.
[12] Fontella G. M. A. (2008) : Interaction des réseaux de
transport et de distribution en présence de production décentralisée. Thèse doctorat, Institut Polytechnique de Grenoble, France, 289 p.
[13] Gueye I. Y. (2006) : Le contrôle des pertes non
techniques d’électricité. Fiche technique PRISME, Rapport sur les politique de maitrise de l’énergie, Fiche N08, 8 p.
[14] Hachimi E. S. (2013) : Amélioration du rendement du
réseau BT de la RADEEF. Rapport De Fin D’études, Université Sidi Mohammed Ben Abdellah, 35 p.
[15] Hamel M. (1991) : Influence de la variation de
température ambiante sur les vibrations induites par effet de couronne. Mémoire de master, Université du Québec à Chicoutimi, Canada, 101 p.
[16] Hamouimeche K. (2009) : Étude de l’interaction entre
une barrière de papier et une décharge couronne en géométrie pointe-plan. Mémoire de magister, UMMTO, Algérie, 97 p.
[17] Harting C. (2010). AC Transmission Line Losses.
Stanford University, htlm.
[18] Krasniqi I., Komoni V., Alidemaj A., Kabashi G.
(2011): Corona losses dependence from the conductor diameter. Recent Researches in Power Systems and Systems Science, 6 p.
[19] Kolcio N. (1969): Radio-Influence and Corona-Loss
Aspects of AEP 765-kV Lines. IEEE Transactions on Power Apparatus and Systems PAS-88, No.9, pp1343.
[20] Lahti K., Lahtinen M. and Nousiainen K. (1997):
Transmission Line Corona Losses Under Hoar Frost Conditions. IEEE Transactions on Power Delivery, Vol. 12, No. 2, pp 928-933
[21] Lilien J. (2009) : Transport et distribution de l‘énergie
électrique. Institut d’Electricité Montefiore, Université de Liège, 55 p.
[22] Lilien J. (2010) : Transport et distribution de l‘énergie
électrique. Institut d’Electricité Montefiore, Université de Liège, 130 p.
[23] Marie-Cécile A.-H. (2009) : Architectures des réseaux
de distribution du futur en présence de production décentralisée, Thèse de doctorat, Institut National Polytechnique de Grenoble, 199p.
[24] Mekhloufi M. A. (2012) : Modélisation, simulation et
analyse des régimes de fonctionnement et des conditions d’exploitation des longues lignes de transport d’énergie électrique a extra haute tension (e.h.v) 400 kV et plus. Mémoire de magister, USTOMB, Algérie, 98 p.
[25] Metz-Noblat B. (2004) : Les calculs sur les réseaux
électriques BT et HT. Cahier Technique, Rapport Schneider Electric, N0 213, 40 p.
[26] Ministère de L’Energie et de L’Eau (2006) : Plan de
Développement à long terme du Secteur de l’Électricité Horizon 2030 (PDSE 2030). Rapport Final, Vol 4, 153 p.
[27] Muhammad A. D., Ghous B. N. (2015) : Modeling of
International Journal of Scientific & Engineering Research (IJSER), Vol 6, N° 1, pp 721-731.
[28] Nader A., Mufreh A., Erik L., Sven J. (2015) :
Transmission lines in SAUDI ARABIA. 37p.
[29] Ndjiya N., Nana T., Ernest K., Haman-Djalo (2017):
Contribution of and stability analysis of an electrical network using stability index: Application to Southern Interconnected Grid (SIG) in Cameroon. Global Journal of Engineering Sciences and Researches, Vol 4, N° 6, pp 33-41.
[30] Peek F. W. (1920) : Dielectric phenomena in high
voltage engineering. Mc graw-hill book company, second edition, New York, 320 p.
[31] Potvin C. (2000) : Comportement de l’effet de la charge
d’espace sur le mécanisme des vibrations induites par effet couronnes. Mémoire de maitrise en ingénierie, Université du Québec à Chicoutimi, Canada, 120 p.
[32] Rami G. (2006) : contrôle de tension auto adaptatif
pour des productions décentralisées d’énergies connectées au réseau électrique de distribution. Thèse de doctorat, Institut National Polytechnique de Grenoble, 177 p.
[33] Saad D. (2011) : Effet de la décharge couronne sur les
surfaces isolantes et les surfaces métalliques. Mémoire de magister, UMMTO, Algérie, 127 p.
[34] Shahzad B. S., Lodhi U. U., Shan U. H. (2015):
Electric power transmission and distribution losses overview and minimization in Pakistan. International Journal of Scientific and Engineering Research, N04, Vol. 6, p 1108-1112.
[35] Sivanagararaju S., Satyanarayana S. (2009): Power
transmission and distribution. Pearson Education, Dehli, pp 219-238.
[36] Tchinda R. (2015) : Electrification rurale et énergies
renouvelables : Quels enjeux pour L’Afrique Centrale : cas du Cameroun. Conférence AFRICASOLAR. Ouagadougou, Burkina Faso, 23 p.
[37] Trinh N. G., Maruvada P. S., Poirier B. (1974): A
Comparative Study of the Corona Performance of Conductor Bundles for 1200 kV Transmission Lines. IEEE Transactions on Power Apparatus and Systems PAS-93,940.
[38] YAL L. B. SC. A (1993): Contribution à l’étude de
l’influence des décharges de couronne sur la perte de volume d’une aspérité de glace portée à un potentiel élevé. Thèse de maitrise en ressources et systèmes, Université de Québec à Chicoutimi, 71 p.
[39] Zakariya H. (2016): Corona power loss versus ohmic
power loss in HVDC transmission line. Researchgate, 4 p.
[40] Zellagui M. (2010) : Etude des protections des réseaux
électriques MT (30 & 10 kV). Mémoire de magister, Université Mentouri Constantine, Algérie, 151 p.
ANNEXE
Tableau 5:Characteristics of electrical lines (Ndjiya et al., 2017).
FROM TO L(km) U(kV) R X
1 2 225 105 72
2 3 57,84 225 5,08 24
2 7 93 225 8,17 38,6
3 4 225 3,45 52
3 7 61,40 225 5,40 25,48
4 5 2,8 90 0,41 1,03
5 10 165,4 90 23,156 66,16
6 5 90 1,21 48
7 9 41,5 225 2,6 16,89
7 8 90 3,4 51
10 12 76,7 90 11,11 28,13
11 3 168 225 14,77 69,72
12 11 225 3,5 52
13 14 225 3,6 54