Identification of recurrent non-coding mutations in B-cell lymphoma using capture Hi-C
Short title: Recurrent non-coding mutations in B-cell lymphoma
Alex J. Cornish1, Phuc H. Hoang1,2, Sara E. Dobbins1, Philip J. Law1, Daniel Chubb1, Giulia Orlando1, Richard S. Houlston1,2,*.
1. Division of Genetics and Epidemiology, The Institute of Cancer Research, London, UK.
2. Division of Molecular Pathology, The Institute of Cancer Research, London, UK.
* Correspondence: Richard S. Houlston; Tel: +44(0) 208 722 4175, Fax: +44(0) 208 722 4365,
e-mail: [email protected], Postal Address: The Institute of Cancer Research, 15
Cotswold Road, Sutton, London SM2 5NG, UK.
Article word count: 3,940
Abstract word count: 168
Number of figures: 6
Number of tables: 0
Number of references: 60
Published in:
ABSTRACT
The identification of driver mutations is fundamental to understanding oncogenesis. While
genes frequently mutated in B-cell lymphoma have been identified, the search for driver
mutations has largely focused on the coding genome. Here we report an analysis of the
non-coding genome using whole genome sequencing data from 117 B-cell lymphoma patients.
Using promoter capture Hi-C data in naïve B-cells we define cis-regulatory elements, which
represent an enriched subset of the non-coding genome in which to search for driver
mutations. We identify regulatory regions whose mutation significantly alters gene
expression, including copy number variation at cis-regulatory elements targeting CD69,
IGLL5 and MMP14, and single-nucleotide variants in a cis-regulatory element for TPRG1.
Additionally, we demonstrate the commonality of pathways targeted by coding and
non-coding mutations, exemplified by MMP14, which regulates Notch signaling, a pathway
important in lymphomagenesis, and whose expression is associated with patient survival.
This study provides an enhanced understanding of lymphomagenesis and demonstrates the
advantages of employing chromosome conformation capture to decipher non-coding
KEY POINTS
• Integration of B-cell lymphoma genomic data and capture Hi-C reveals recurrently
mutated regulatory elements influencing gene expression.
• Expression of MMP14, which is targeted by a mutated cis-regulatory element, is
INTRODUCTION
B-cell lymphoma comprise a heterogeneous group of cancers, with diverse etiologies,
clinical behaviors and outcomes1. The different B-cell lymphoma resemble B cells at specific
stages of differentiation1, with diffuse large B-cell lymphoma (DLBCL) and follicular
lymphoma (FL), accounting for around 43% and 17% of cases respectively2.
The identification of driver mutations is fundamental to understanding oncogenesis and
response to therapy. Although studies have identified genes and pathways frequently
mutated in B-cell lymphoma3-8, many tumors have no detectable driver mutations and we
do not yet have complete understanding of the genetic alterations necessary for tumor
development6.
The search for driver mutations in B-cell lymphoma has however been primarily restricted
to coding regions3-6. Gene regulation is highly cell-type specific, and the interpretation of
mutations within non-coding regions of lymphoma genomes has been in part constrained by
a lack of information on relevant regulatory elements and their target genes9,10.
Furthermore, although mutation recurrence is an indicator of positive selection in tumors,
the sheer size of the non-coding genome places a high statistical burden on an ability to
distinguish passenger from driver mutations.
Cis-regulatory elements (CREs) and promoters controlling gene expression represent a
highly enriched subset of the non-coding genome in which to search for potential driver
capture Hi-C (CHi-C) in naïve B cells12 in an analysis of whole-genome sequencing (WGS)
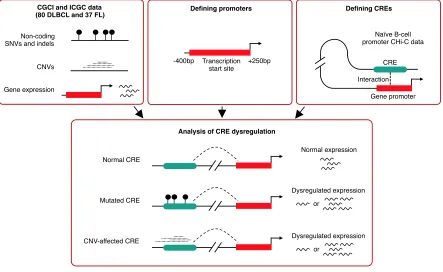
data on 80 DLBCL and 37 FL tumors. By linking CRE mutation to gene expression (Figure 1),
we identify recurrently mutated non-coding regulatory regions, enhancing our
understanding of the oncogenic pathways and mechanisms relevant to B-cell lymphoma
METHODS
Sequencing data
Data from 40 DLBCL, 37 FL and 61 chronic lymphocytic leukemia (CLL) tumors, and matched
normal samples, were obtained from the International Cancer Genome Consortium
(ICGC)5,13. Data from an additional 40 DLBCL tumors and matched normal samples were
obtained from The Cancer Genome Characterization Initiative (CGCI)8. The ICGC data has
been aligned, processed and variants called as part of the Pan-Cancer Analysis of Whole
Genomes (PCAWG) project. A consensus approach to variant calling was adopted by
PCAWG, combining the results of multiple pipelines to call SNVs, indels, CNVs and SVs
(https://github.com/ICGC-TCGA-PanCancer). For each mutation type we downloaded and
used variants called by a respective pipeline. To minimize technical differences between the
cohorts, we aligned, processed and called variants in the CGCI data using identical pipelines,
as described in Supplementary Methods. RNA-sequencing data for all samples were
obtained from the CGCI and ICGC and processed as described in Supplementary Methods.
This study uses only published sequencing data and therefore ethical approval was not
sought.
Definition of regulatory regions
Promoter regions were defined as the intervals spanning 400bp upstream to 250bp
downstream of transcription start sites from RefGene14. CREs were defined using promoter
CHi-C data generated on naïve B cells12. HindIII fragments interacting with at least one
protein-coding gene promoter were considered CREs. Only promoter-CRE interactions with
filtering the CHi-C data was completed to reduce false identification of interactions
(Supplementary Methods).
Analysis of recurrent mutation of regulatory regions
Promoters and CREs were tested independently for recurrent mutation across tumors above
that expected given the background mutation rates, using a Poisson binomial model as per
Melton et al.17. We employed a Poisson binomial model as it allowed us to consider
tumor-specific mutation rates17, which is not possible using many alternative approaches18,19.
Briefly, the mutation probability of each regulatory region in each tumor was computed by
fitting a logistic regression model to all data, taking into account the following features:
tumor ID, mutation trinucleotide context, regional replication timing and 1Mb mutational
density. Replication timing was estimated as the mean of replication timing data from HeLa,
HepG2, K562, MCF-7 and SK-N-SH cell lines20. Promoters and CREs overlapping open reading
frames (defined in Ensembl v73), extended 5bp in each direction to account for splice sites,
were excluded from the analysis18 Regions of CREs overlapping 3’ UTR and 5’ UTR were also
excluded from the analysis18.
The probability that a region is mutated was defined as:
! regionis mutated = 1− (1− !!)
!
!!!
where i is the base position, s is the number of nucleotides considered in the region (i.e. not
excluded) and pi is the probability that a mutation occurs at base i. P-values were computed
for each promoter and CRE using an approximation of the Poisson binomial model
distribution and we therefore used the right tail masses to compute randomized P-values
for each region21.
Relationship between simple somatic mutations at CREs and gene expression
Significantly mutated CREs were examined for differential expression of target genes
between mutated and non-mutated tumors. For each CRE, tumors were classified mutated
or non-mutated based on the presence of SNVs or indels at the CRE, and differential
expression assessed using permutation testing22. In the permutation testing a t-test was
performed using the mutated/non-mutated tumor labels to generate a single t-value (the
observed t-value). The expression values for the mutated/non-mutated tumors were then
permuted 10,000 times to generate 10,000 additional t-values (the permutated t-values).
The permuted t-values generally fit a Gaussian distribution, against which the observed
t-value could be compared using a two-tailed test22. Samples with CNVs at either the CRE or
target gene were excluded. Additionally, samples with translocation or inversion
breakpoints ≤1Mb from the target gene were excluded. Only CREs mutated in at least five
tumors were tested, after removal of tumors with CNVs at the CRE or target gene, or
proximal translocation or inversion breakpoints. CREs interacting with multiple gene
promoters were tested multiple times. Only CREs interacting with the promoters of
protein-coding genes were examined. The Benjamini-Hochberg procedure was used to adjust for
multiple testing and significance thresholded at Q<0.1.
Relationship between CNVs at CREs and gene expression
Focal amplifications and deletions were defined as absolute copy number changes ≥1 and
identified tumors with amplifications or deletions at a CRE, (ii) excluded tumors with CNVs
at the target gene, (iii) excluded tumors with translocation or inversion breakpoints ≤1Mb
from the target gene, and (iv) assessed the association between the copy number change d
and log2-transformed gene expression e by fitting a linear regression model: ! = !!+ !!!.
A t-statistic was computed using the estimated !! coefficient and standard error, and a
P-value was computed from this t-statistic under the null hypothesis of no association
between copy number change and gene expression (!! = 0). Only regulatory regions
mutated in at least five tumors were tested, after exclusion of tumors with CNVs at the
target gene or proximal translocation and inversion breakpoints. Copy number changes
were calculated relative to the ploidy of the tumor, as determined by ascatNgs23. For
simplicity, all losses and gains were considered equally when calculating correlation
coefficients (i.e. each tumor is defined as having either a loss, no change, or gain in copy
number). In addition to conducting individual analyses of DLBCL and FL tumors, we
completed a meta-analysis of the two tumor types under a fixed effects model. The
Benjamini-Hochberg procedure was used to adjust for multiple testing and significance
thresholded at Q<0.1.
Survival analysis
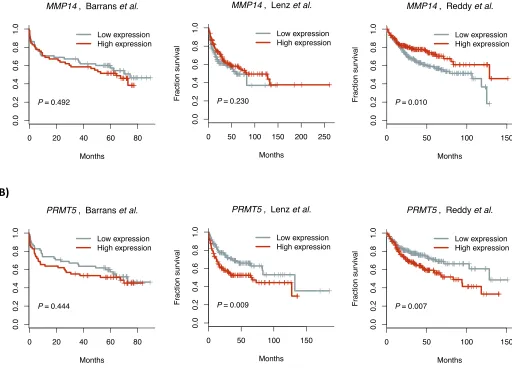
To examine the relationship between gene expression and overall survival, we made use of
data from three independent DLBCL patient cohorts from Barrans et al.24, Lenz et al.25 and
Reddy et al.6, which were downloaded from GEO. Patients were censored based on their
last known clinical follow up. For each series, gene expression was first treated as a
continuous variable in a Cox proportional hazards model with inclusion of age at diagnosis,
Analysis was performed using the log-rank test to estimate expression-associated HRs, and
the Wald test was used to determine statistical significance. The proportional hazards
assumption in the Cox models was assessed using scaled Schoenfeld residuals implemented
in the “cox.zph” function from the survival R-package. Meta-analyses of the independent
patient cohorts were performed under a fixed-effects model. We also stratified cancers by
the expression of the gene, defining tumors as having high or low expression of a gene if the
expression value was within the top or bottom third of expression values for the gene
across all cancers respectively. Kaplan-Meier analysis was then performed using this tumor
stratification and the difference between the survival distributions assessed using the
log-rank test.
Data availability
ICGC data, processed as part of the PCAWG project, were downloaded from the ICGC Data
Coordination Center (DCC) Data Portal (project codes MALY-DE and CLLE-ES). CGCI data
were downloaded from dbGaP (phs000532.v7). Naïve B-cell CHi-C data were obtained from
Javierre et al12. Histone ChIP-seq data were downloaded from BLUEPRINT (sample C005Q).
Clinical and gene expression data used in survival analyses were downloaded from GEO
RESULTS
Recurrently mutated non-coding regulatory regions
After quality control and filtering of WGS data, we identified 1,169,005 single nucleotide
variants (SNVs) in the DLBCL tumors (5.07 mutations per megabase [Mb]), and 255,889
SNVs in FL tumors (2.40 mutations per Mb; Table S1). Recurrently mutated regions were
identified as those containing a greater number of mutations than that expected given the
background mutation rate, adjusting for tumor-specific mutation rates, trinucleotide
contexts, replication timing and 1Mb mutational density17. To identify somatic mutations in
non-coding regulatory regions, we defined 21,750 regions associated with 17,677 genes as
promoters14. We identified recurrently mutated promoters associated with 17 and 4 genes
in DLBCL and FL tumors respectively (Q<0.1, Table S2). These genes include BLK, IRF8 and
SPIB, which are implicated in lymphoma development and growth26-28, but for which
recurrent promoter mutations have not previously been reported9.
Using promoter CHi-C in naïve B cells12 we defined 69,872 genomic fragments containing
putative CREs (median size 2.1Kb), involved in 142,791 unique significant interactions with
promoters (median linear distance 292Kb) and constituting 7% of the genome. These
promoter-interacting fragments have previously been shown to be enriched for ATAC-seq
accessibility and regulatory histone marks12. We identified 78 recurrently mutated CREs
interacting with the promoters of 72 genes in DLBCL tumors (Q<0.1, Table S3), and 42
recurrently mutated CREs interacting with the promoters of 37 genes in FL tumors (Q<0.1,
Table S3). The majority of these recurrently mutated CREs (59% in DLBCL and 63% in FL) do
genes. Genes targeted by recurrently mutated CREs include PAX5, which interacts with ten
and eight recurrently mutated CRE fragments in DLBCL and FL respectively, and whose
expression is disrupted by non-coding mutations in chronic lymphoblastic leukemia (CLL)13
and multiple myeloma (MM)29. Furthermore, we identified recurrently mutated CREs
interacting with genes known to also be affected by coding mutations, including five genes
previously associated with non-coding mutations in B-cell lymphoma (ARID5B, BCL2, BCL6,
ETS1, PAX5) and five genes for which only coding mutations have previously been reported
(DMXL1, IKZF3, PCDHB1, SEMA3D and SYPL1; Table S3)6,7,9,10.
We used Palimpsest to characterise the processes most likely to be responsible for the
recurrent mutation of promoters and CREs (Tables S4, S5 and S6; Supplementary
Methods)30-32. In DLBCL, promoters and CREs of genes including BCL6 were enriched for
mutations attributed to signatures SBS84 or SBS85 (P < 0.05; Table S4), which are associated
with the activity of activation-induced deaminase (AID)32, supporting previous
observations33. Furthermore, the promoters and CREs of multiple genes, including SGK1 and
ST6GAL1 in DLBCL, were enriched for mutations attributed to signature SBS3 (Table S4 and
S5), which is indicative of defective homologous recombination repair34, consistent with
distinct processes underling the mutation of different regulatory elements.
To identify non-coding driver mutations in regulatory regions, we compared the expression
levels of target genes of recurrently mutated CREs between mutated and non-mutated
tumors, using RNAseq data from each tumor. Tumors with copy number changes
overlapping either the CRE or target gene, and tumors with translocation or inversion
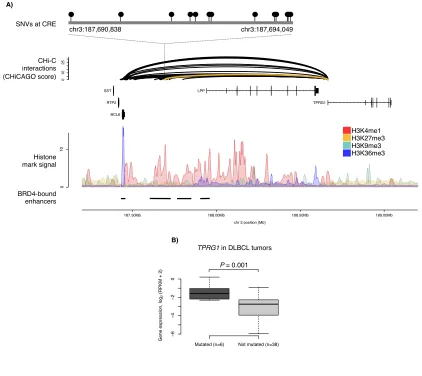
interacting with the TPRG1 promoter, occurring in nine tumors (Figure 2), was associated
with increased TPRG1 expression in DLBCL (Q=0.09, Figure 3, Table S7). This CRE is
annotated by epigenetic marks indicative of active enhancers (Figure 3, Figure S1,
Supplementary Methods) and located at a regulatory region previously identified in DLBCL
to be bound by the bromodomain 4 (BRD4) chromatin reader protein (Figure 3A,
Supplementary Methods)35, which is characteristic of enhancers important in DLBCL growth
and cell cycle progression35. Amplifications of the TPRG1 gene were present in an additional
18 DLBCL tumors, with the mutation of recurrently mutated TPRG1 CREs and TPRG1 gene
amplifications tending to occur in different tumors (P=0.016, two-tailed Fisher’s exact test),
suggesting alternative mechanisms of gene dysregulation. Whilst the mutation of this region
has previously been reported in B-cell lymphoma, it was not previously associated with
disrupted TPRG1 expression9. This TPRG1 CRE is enriched for mutations attributed to
signatures SBS84 (P=0.002) and SBS85 (P=0.030) (Table S5), consistent with it being a target
of AID activity32,36. Whilst the function of TPRG1 is poorly characterized, it is regulated by
p6337, which has been implicated as playing a role in lymphoma oncogenesis38.
Copy number variation at CREs dysregulates gene expression
To identify CREs subject to somatic copy number variation (CNV), we identified CNVs in
tumors using WGS data (Figure 2). CNV-positive CREs were assessed for a correlation with
the expression of target genes, excluding cases where the gene was encompassed by a CNV,
using RNAseq data from each tumor. In DLBCL tumors, 20 CNV-positive CREs were
associated with target gene expression (Q<0.1, Table S8), 19 of which are located in a 220Kb
region on chromosome 14. In FL tumors, two CNV-positive CREs, located in the same region
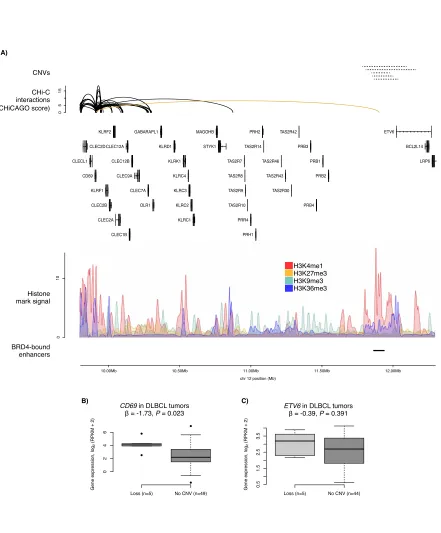
The CD69 promoter interacts with a CRE annotated by multiple epigenetic marks,
overlapping a DLBCL BRD4-bound regulatory region (Figure 4A, Figure S2)35. This CRE region
is deleted in five DLBCL tumors, which were associated with higher CD69 expression
(Q=0.06, Figure 4B, Table S8), suggesting this element acts as a repressor of CD69
expression. CD69 plays a role in B-cell development in mice39 and enhanced antitumor
immunity has been observed in mice deficient in CD6940. Higher CD69 protein expression
has previously been associated with shorter survival in B-cell lymphoma patients41,42,
although we did not replicate this association with RNA expression in three independent
series totaling 1,670 DLBCL cases (Table S9). Whilst deletion of the CD69 CRE was
accompanied by ETV6 exon deletions in three of the five tumors, altered ETV6 expression
was not observed in these samples (Figure 4C).
The T-cell receptor alpha (TRA) locus, which undergoes V(D)J recombination during T-cell
development43, is the subject of copy number losses and gains in both DLBCL and FL tumors
(Table S8). This region is annotated with multiple histone marks and contains two DLBCL
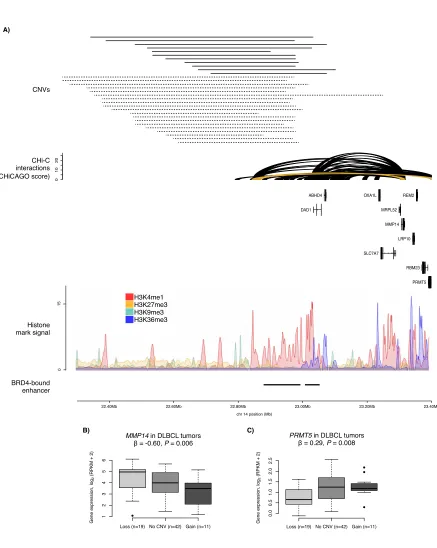
BRD4-bound regulatory regions35 (Figure 5A, Figure S3). In DLBCL, eight CRE fragments at
the TRA locus were deleted in 20 and amplified in 11 tumors. These CRE fragments contact
the promoters of 16 genes, with copy number changes associated with the expression of
ABHD4, LRP10, MMP14, PRMT5 and SLC7A7 (Q<0.1, Figure 5B-C, Table S8). In FL, these CRE
fragments were deleted in 17 tumors and amplified in one, with copy number changes
associated with the expression of only ACIN1 (Q=0.04, Table S8). In the DLBCL tumors,
increased CRE copy number was associated with reduced MMP14 expression (Q=0.03,
disrupted in DLBCL45, and through which the loss of MMP14 impairs B-cell differentiation44.
Lower MMP14 expression was associated with worse overall survival in DLBCL (hazard ratio
[HR]=0.85, 95% confidence interval [CI]: 0.77-0.95, P=0.003, Figure S4, Table S9). Increased
CRE copy number was associated with increased PRMT5 expression in DLBCL tumors
(Q=0.03), although this trend in expression was driven by lower PRMT5 expression in
tumors with CRE deletions, as increased PRMT5 expression was not observed in tumors with
CRE amplifications (Figure 5C).
Although copy number changes at the TRA locus have previously been observed in B-cell
malignancies46-48, it is disputed whether these variants are pathogenic lesions occurring in
the tumor cells46, or whether they occur not in the tumor cells but in infiltrating T-cells47,
which are often found in lymphoma as part of the immune response49. To assess whether
infiltrating T cells may be responsible for CNVs at the TRA locus, we addressed the potential
issue of normal contamination using tumor purity estimates from ascatNgs for each sample.
CNV calling by ascatNgs is suboptimal where there is >50% contamination50. In view of this,
T-cell contamination is less likely to be responsible for observed CNVs when normal
contamination is <50%. In 15/20 of DLBCL samples and 11/17 of FL samples with TRA locus
deletions, normal contamination was >50%, suggesting that the TRA locus losses observed
in these samples may not occur in cancer cells, but instead in infiltrating T-cells. Conversely,
in all 11 DLBCL samples and in the one FL sample with TRA locus amplifications, normal
contamination was <50%, consistent with TRA locus amplification being more likely
Many CREs are affected by expression-associated CNVs in both DLBCL and FL tumors (Table
S8) and we therefore conducted a meta-analysis of these association statistics under a
fixed-effects model (Table S10). In this meta-analysis, CNV-positive CREs interacting with the
promoters of MMP14, PRMT5 and SLC7A7 were associated with the expression of these
genes (Q<0.1), suggesting a common effect of these CNVs on target gene expression in
these B-cell malignancies.
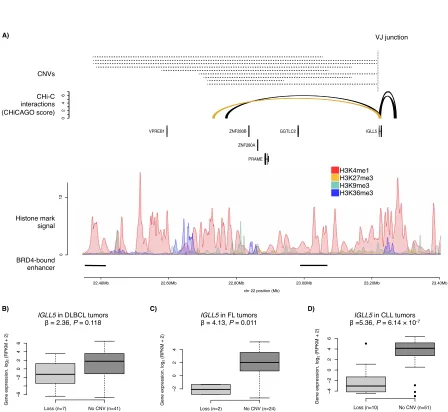
Meta-analysis of the DLBCL and FL tumors also identified two CREs interacting with the
IGLL5 promoter, for which focal deletion was associated with lower IGLL5 expression
(Q<0.1, Table S10). The CNV-positive CRE most strongly association with IGLL5 expression
(Q=0.03, Figure 6A-D) was deleted in 14 DLBCL tumors and 6 FL tumors, and annotated by
epigenetic marks indicative of active enhancers (Figure 6A, Figure S5). Whilst the function of
IGLL5 remains to be established, it is recurrently mutated in DLBCL51, and is homologous to
IGLL1, a gene which plays a critical role in B-cell development52. Furthermore, IGLL5 has
been shown to function as a tumor suppressor in a CRISPR-based screen of DLBCL cell lines6,
a finding in keeping with reduced IGLL5 expression being associated with CRE deletion.
Although focal deletion of regions encompassing the IGLL5 CRE occur in other B-cell
malignancies, including childhood acute lymphoblastic leukemia (ALL)53 and CLL54, their
pathogenicity is unclear54,55. Since the IGLL5 CRE is located at the immunoglobulin lambda
light chain locus (IGL) Mraz et al. postulated that such deletions are likely to merely be the
consequence of IGL rearrangements55. Conversely, Mangum et al. has shown that the locus
deletions observed in ALL occur independently of IGL rearrangement and frequently do not
involve the VJ junction nor follow the ordered model of V(D)J recombination53. Many of the
6A), suggesting that they also occur independently of V(D)J recombination. As focal deletion
of this region has previously been observed in CLL54, we completed a secondary analysis of
this CRE in 61 CLL tumors13. In these tumors deletion of the CRE was also associated with
lower IGLL5 expression (P=6.1×10⁻⁷, Figure 6D), suggesting that the effect of the deletion of
this CRE on IGLL5 expression may be generic to B-cell malignancies.
We examined whether tumors harboring CNV-positive CREs associated with target gene
expression were enriched for DLBCL tumors of either the activated B-cell-like (ABC) or
germinal center B-cell-like (GCB) cell-of-origin (COO) subtypes (Table S11, Supplementary
Methods). Although CD69 CRE deletions were observed exclusively in ABC or unclassified
tumors, this enrichment was non-significant (P=0.16).
Pathways targeted by both coding and non-coding mutation in DLBCL
To better inform the interplay between non-coding driver mutations with other driver
mechanisms, we identified pathways targeted by coding and non-coding mutations,
combining genes identified in this analysis and genes with recurrent coding mutations
from an analysis of 1,001 DLBCL whole exomes6 (Table S12, Supplementary Methods).
One pathway identified is Notch signaling (Q=2.1×10⁻⁴), which contains genes affected by
coding mutations, such as CREBBP, and genes affected by non-coding mutations, such as
IKZF1 and PLXND1. Other pathways affected by both coding and non-coding mutations
include DNA repair, transcriptional regulation by TP53, and WNT-signaling (Q<0.1), all of
DISCUSSION
This analysis has identified putative non-coding driver mutations in B-cell lymphoma and
highlights that pathways key to lymphomagenesis can be targeted somatically through
multiple mechanisms. Using promoter CHi-C, we identify recurrently mutated CREs and link
them to the genes they regulate. By adopting this strategy we have sought to address the
issue that many recurrently mutated CREs will not necessarily interact with the promoter of
the proximal gene and hence the target gene will remain unidentified. This is illustrated by
the CREs interacting with the promoters of IGLL5 and TPRG1, neither of which interact with
their proximal genes, but whose mutation is associated with dysregulated expression of the
respective target gene.
It has previously been demonstrated that disruption of the Notch-signaling pathway,
through coding mutations in genes such as NOTCH2 and FBXW7, confers an unfavorable
prognosis in DLBCL57. Here we add MMP14 to the list of genes in this pathway disrupted in
DLBCL, the lower expression of which is similarly associated with worse survival (Table S9).
V(D)J recombinase recognizes recombination sequence signals (RSSs), which consist of
conserved heptamer and nonamer elements separated by a spacer58. We identified RSS
sites adjacent to the boundaries of 11/49 TRA locus CNVs, 10/25 IGLL5 CRE CNVs, and 0/5
CD69 CRE CNVs (Table S13). Calling RSS sites is inherently difficult, due to some sites being
less conserved nor adjacent to identified breakpoints59. Therefore, whilst this analysis
provides no evidence that many of the CRE-disrupting CNVs occur due to V(D)J
Here we utilize naïve B-cell CHi-C data to characterize CREs and map them to their
respective target genes. DLBCL and FL tumors develop from B cells at various stages of
differentiation1, and naïve B-cell CHi-C data may therefore not fully recapitulate the
regulatory interactions active in each tumors’ COO. Nevertheless, many interactions
involving mutated CREs associated with differential target gene expression are also
observed in total B-cell CHi-C data (Table S14)12, suggesting that these interactions may not
be unique to a single stage of B-cell differentiation. These CREs are also annotated by
epigenetic marks indicative of active enhancers in B cells at different differentiation stages
(Figures S1-S3 and S5), indicating that the activity of these CREs is not restricted to a single
differentiation stage.
We acknowledge that this analysis has limitations. Firstly, when evaluating the effect of
CRE mutations on gene expression we consider all CRE mutations to be potential drivers.
It is also possible that some CREs contain a mixture of mutations that do and do not
affect gene expression, thereby reducing study power. Secondly, we do not consider the
clonality of mutations in the differential expression analysis. Thirdly, we did not assess
whether CRE mutations affect promoter interactions or the affinity of transcription
factors. CRISPR/Cas9-based genome editing and electrophoretic mobility shift assays could
be used to investigate the functional impact of these mutations.
In summary, our findings highlight the contribution of non-coding mutations and CNVs to
B-cell lymphomagenesis, and provide further insight into the genetic complexity of B-B-cell
chromosome conformation capture to decode regulatory elements relevant to B-cell
ACKNOWLEDGEMENTS
This work is funded by grants from Bloodwise and Cancer Research UK. The results
published here are part based upon data generated by the CGCI, Non-Hodgkin Lymphoma
project, developed and managed by the NCI. Information about CGCI projects can be found
at https://ocg.cancer.gov/programs/cgci. This study makes use of data from ICGC,
processed as part of the PCAWG project. We would like to thank the clinical contributors
and data producers for these projects. This study also makes use of data generated by the
Blueprint Consortium. A full list of the investigators who contributed to the generation of
the data is available from www.blueprint-epigenome.eu. Funding for the project was
provided by the European Union's Seventh Framework Programme (FP7/2007-2013) under
grant agreement no 282510 BLUEPRINT.
AUTHORSHIP CONTRIBUTIONS
A.J.C. and R.S.H. conceived and designed the study. A.J.C., P.H.H., S.E.D., P.J.L., D.C. and G.O.
performed bioinformatic analyses. A.J.C. performed statistical analyses. A.J.C. and R.S.H.
wrote the manuscript, with contributions from P.H.H., D.C. and G.O. All authors reviewed
the final manuscript.
DISCLOSURE OF CONFLICTS OF INTEREST
REFERENCES
1. Campo E, Swerdlow SH, Harris NL, Pileri S, Stein H, Jaffe ES. The 2008 WHO
classification of lymphoid neoplasms and beyond: evolving concepts and practical
applications. Blood. 2011;117(19):5019-5032.
2. Smith A, Crouch S, Lax S, et al. Lymphoma incidence, survival and prevalence
2004-2014: sub-type analyses from the UK's Haematological Malignancy Research Network. Br J
Cancer. 2015;112(9):1575-1584.
3. Pasqualucci L, Dominguez-Sola D, Chiarenza A, et al. Inactivating mutations of
acetyltransferase genes in B-cell lymphoma. Nature. 2011;471(7337):189-195.
4. Lohr JG, Stojanov P, Lawrence MS, et al. Discovery and prioritization of somatic
mutations in diffuse large B-cell lymphoma (DLBCL) by whole-exome sequencing. Proc Natl
Acad Sci U S A. 2012;109(10):3879-3884.
5. Richter J, Schlesner M, Hoffmann S, et al. Recurrent mutation of the ID3 gene in
Burkitt lymphoma identified by integrated genome, exome and transcriptome sequencing.
Nat Genet. 2012;44(12):1316-1320.
6. Reddy A, Zhang J, Davis NS, et al. Genetic and Functional Drivers of Diffuse Large B
Cell Lymphoma. Cell. 2017;171(2):481-494 e415.
7. Zhang J, Grubor V, Love CL, et al. Genetic heterogeneity of diffuse large B-cell
lymphoma. Proc Natl Acad Sci U S A. 2013;110(4):1398-1403.
8. Morin RD, Johnson NA, Severson TM, et al. Somatic mutations altering EZH2 (Tyr641)
in follicular and diffuse large B-cell lymphomas of germinal-center origin. Nat Genet.
9. Mathelier A, Lefebvre C, Zhang AW, et al. Cis-regulatory somatic mutations and
gene-expression alteration in B-cell lymphomas. Genome Biol. 2015;16:84.
10. Arthur SE, Jiang A, Grande BM, et al. Genome-wide discovery of somatic regulatory
variants in diffuse large B-cell lymphoma. Nat Commun. 2018;9(1):4001.
11. Orlando G, Law PJ, Cornish AJ, et al. Promoter capture Hi-C-based identification of
recurrent noncoding mutations in colorectal cancer. Nat Genet. 2018;50(10):1375-1380.
12. Javierre BM, Burren OS, Wilder SP, et al. Lineage-Specific Genome Architecture Links
Enhancers and Non-coding Disease Variants to Target Gene Promoters. Cell.
2016;167(5):1369-1384 e1319.
13. Puente XS, Bea S, Valdes-Mas R, et al. Non-coding recurrent mutations in chronic
lymphocytic leukaemia. Nature. 2015;526(7574):519-524.
14. Rheinbay E, Parasuraman P, Grimsby J, et al. Recurrent and functional regulatory
mutations in breast cancer. Nature. 2017;547(7661):55-60.
15. Cairns J, Freire-Pritchett P, Wingett SW, et al. CHiCAGO: robust detection of DNA
looping interactions in Capture Hi-C data. Genome Biol. 2016;17(1):127.
16. Dryden NH, Broome LR, Dudbridge F, et al. Unbiased analysis of potential targets of
breast cancer susceptibility loci by Capture Hi-C. Genome Res. 2014;24(11):1854-1868.
17. Melton C, Reuter JA, Spacek DV, Snyder M. Recurrent somatic mutations in
regulatory regions of human cancer genomes. Nat Genet. 2015;47(7):710-716.
18. Weinhold N, Jacobsen A, Schultz N, Sander C, Lee W. Genome-wide analysis of
noncoding regulatory mutations in cancer. Nat Genet. 2014;46(11):1160-1165.
19. Nik-Zainal S, Davies H, Staaf J, et al. Landscape of somatic mutations in 560 breast
20. Hansen RS, Thomas S, Sandstrom R, et al. Sequencing newly replicated DNA reveals
widespread plasticity in human replication timing. Proc Natl Acad Sci U S A.
2010;107(1):139-144.
21. Imielinski M, Guo G, Meyerson M. Insertions and Deletions Target Lineage-Defining
Genes in Human Cancers. Cell. 2017;168(3):460-472 e414.
22. Feigin ME, Garvin T, Bailey P, et al. Recurrent noncoding regulatory mutations in
pancreatic ductal adenocarcinoma. Nat Genet. 2017;49(6):825-833.
23. Raine KM, Van Loo P, Wedge DC, et al. ascatNgs: Identifying Somatically Acquired
Copy-Number Alterations from Whole-Genome Sequencing Data. Curr Protoc
Bioinformatics. 2016;56:15 19 11-15 19 17.
24. Barrans SL, Crouch S, Care MA, et al. Whole genome expression profiling based on
paraffin embedded tissue can be used to classify diffuse large B-cell lymphoma and predict
clinical outcome. Br J Haematol. 2012;159(4):441-453.
25. Lenz G, Wright G, Dave SS, et al. Stromal gene signatures in large-B-cell lymphomas.
N Engl J Med. 2008;359(22):2313-2323.
26. Xu Y, Jiang L, Fang J, et al. Loss of IRF8 Inhibits the Growth of Diffuse Large B-cell
Lymphoma. J Cancer. 2015;6(10):953-961.
27. Petersen DL, Berthelsen J, Willerslev-Olsen A, et al. A novel BLK-induced tumor
model. Tumour Biol. 2017;39(7):1010428317714196.
28. Takagi Y, Shimada K, Shimada S, et al. SPIB is a novel prognostic factor in diffuse
large B-cell lymphoma that mediates apoptosis via the PI3K-AKT pathway. Cancer Sci.
29. Hoang PH, Dobbins SE, Cornish AJ, et al. Whole-genome sequencing of multiple
myeloma reveals oncogenic pathways are targeted somatically through multiple
mechanisms. Leukemia. 2018.
30. Shinde J, Bayard Q, Imbeaud S, et al. Palimpsest: an R package for studying
mutational and structural variant signatures along clonal evolution in cancer. Bioinformatics.
2018;34(19):3380-3381.
31. Letouze E, Shinde J, Renault V, et al. Mutational signatures reveal the dynamic
interplay of risk factors and cellular processes during liver tumorigenesis. Nat Commun.
2017;8(1):1315.
32. Alexandrov L, Kim J, Haradhvala NJ, et al. The Repertoire of Mutational Signatures in
Human Cancer. bioRxiv. 2018.
33. Alvarez-Prado AF, Perez-Duran P, Perez-Garcia A, et al. A broad atlas of somatic
hypermutation allows prediction of activation-induced deaminase targets. J Exp Med.
2018;215(3):761-771.
34. Alexandrov LB, Nik-Zainal S, Wedge DC, et al. Signatures of mutational processes in
human cancer. Nature. 2013;500(7463):415-421.
35. Chapuy B, McKeown MR, Lin CY, et al. Discovery and characterization of
super-enhancer-associated dependencies in diffuse large B cell lymphoma. Cancer Cell.
2013;24(6):777-790.
36. Kasar S, Kim J, Improgo R, et al. Whole-genome sequencing reveals
activation-induced cytidine deaminase signatures during indolent chronic lymphocytic leukaemia
37. Antonini D, Dentice M, Mahtani P, et al. Tprg, a gene predominantly expressed in
skin, is a direct target of the transcription factor p63. J Invest Dermatol.
2008;128(7):1676-1685.
38. Fukushima N, Satoh T, Sueoka N, et al. Clinico-pathological characteristics of p63
expression in B-cell lymphoma. Cancer Sci. 2006;97(10):1050-1055.
39. Lauzurica P, Sancho D, Torres M, et al. Phenotypic and functional characteristics of
hematopoietic cell lineages in CD69-deficient mice. Blood. 2000;95(7):2312-2320.
40. Esplugues E, Sancho D, Vega-Ramos J, et al. Enhanced antitumor immunity in mice
deficient in CD69. J Exp Med. 2003;197(9):1093-1106.
41. Erlanson M, Gronlund E, Lofvenberg E, Roos G, Lindh J. Expression of activation
markers CD23 and CD69 in B-cell non-Hodgkin's lymphoma. Eur J Haematol.
1998;60(2):125-132.
42. Del Poeta G, Del Principe MI, Zucchetto A, et al. CD69 is independently prognostic in
chronic lymphocytic leukemia: a comprehensive clinical and biological profiling study.
Haematologica. 2012;97(2):279-287.
43. Livak F, Schatz DG. T-cell receptor alpha locus V(D)J recombination by-products are
abundant in thymocytes and mature T cells. Mol Cell Biol. 1996;16(2):609-618.
44. Jin G, Zhang F, Chan KM, et al. MT1-MMP cleaves Dll1 to negatively regulate Notch
signalling to maintain normal B-cell development. EMBO J. 2011;30(11):2281-2293.
45. Lee SY, Kumano K, Nakazaki K, et al. Gain-of-function mutations and copy number
increases of Notch2 in diffuse large B-cell lymphoma. Cancer Sci. 2009;100(5):920-926.
46. Nacheva EP, Brazma D, Virgili A, et al. Deletions of immunoglobulin heavy chain and
T cell receptor gene regions are uniquely associated with lymphoid blast transformation of
47. Broseus J, Chen G, Hergalant S, et al. Relapsed diffuse large B-cell lymphoma present
different genomic profiles between early and late relapses. Oncotarget.
2016;7(51):83987-84002.
48. Bignell GR, Greenman CD, Davies H, et al. Signatures of mutation and selection in the
cancer genome. Nature. 2010;463(7283):893-898.
49. Keane C, Gould C, Jones K, et al. The T-cell Receptor Repertoire Influences the Tumor
Microenvironment and Is Associated with Survival in Aggressive B-cell Lymphoma. Clin
Cancer Res. 2017;23(7):1820-1828.
50. Chen GK, Chang X, Curtis C, Wang K. Precise inference of copy number alterations in
tumor samples from SNP arrays. Bioinformatics. 2013;29(23):2964-2970.
51. de Miranda NF, Georgiou K, Chen L, et al. Exome sequencing reveals novel mutation
targets in diffuse large B-cell lymphomas derived from Chinese patients. Blood.
2014;124(16):2544-2553.
52. Thompson EC, Cobb BS, Sabbattini P, et al. Ikaros DNA-binding proteins as integral
components of B cell developmental-stage-specific regulatory circuits. Immunity.
2007;26(3):335-344.
53. Mangum DS, Downie J, Mason CC, et al. VPREB1 deletions occur independent of
lambda light chain rearrangement in childhood acute lymphoblastic leukemia. Leukemia.
2014;28(1):216-220.
54. Gunn SR, Bolla AR, Barron LL, et al. Array CGH analysis of chronic lymphocytic
leukemia reveals frequent cryptic monoallelic and biallelic deletions of chromosome 22q11
55. Mraz M, Stano Kozubik K, Plevova K, et al. The origin of deletion 22q11 in chronic
lymphocytic leukemia is related to the rearrangement of immunoglobulin lambda light chain
locus. Leuk Res. 2013;37(7):802-808.
56. Basso K, Dalla-Favera R. Germinal centres and B cell lymphomagenesis. Nat Rev
Immunol. 2015;15(3):172-184.
57. Karube K, Martinez D, Royo C, et al. Recurrent mutations of NOTCH genes in
follicular lymphoma identify a distinctive subset of tumours. J Pathol. 2014;234(3):423-430.
58. Hesse JE, Lieber MR, K. M, Gellert M. V(D)J recombination: a functional definition of
the joining signals. Genes and Development. 1989;3(7):1053-1061.
59. Papaemmanuil E, Rapado I, Li Y, et al. RAG-mediated recombination is the
predominant driver of oncogenic rearrangement in ETV6-RUNX1 acute lymphoblastic
leukemia. Nature Genetics. 2014;42(2):116-125.
60. Skidmore ZL, Wagner AH, Lesurf R, et al. GenVisR: Genomic Visualizations in R.
FIGURE LEGENDS
Figure 1: Analysis overview. CGCI: The Cancer Genome Characterization Initiative, ICGC:
The International Cancer Genome Consortium, DLBCL: diffuse large B-cell lymphoma, FL:
follicular lymphoma, SNV: single nucleotide variant, CNV: copy number variant, CRE:
cis-regulatory element, CHi-C: capture Hi-C.
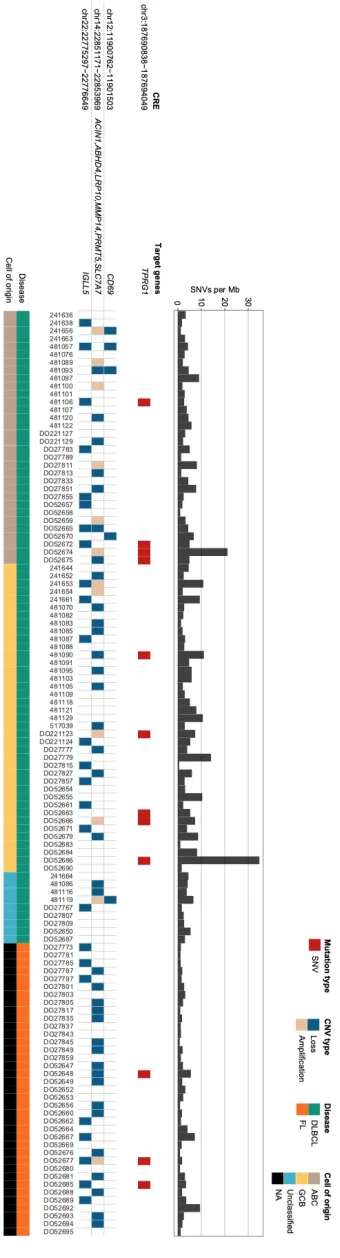
Figure 2: Overview of CRE mutations, amplifications and losses associated with altered
target gene expression in DLBCL and FL. Top panel shows the genome-wide mutation
burden for each tumor. Second panel shows the occurrence of SNVs in the TPRG1 CRE. Third
panel shows the occurrence of amplifications and losses at CREs associated with altered
target gene expression. Bottom panel indicates the disease type and the cell of origin of
each tumor. Figure generated using GenVisR60.
Figure 3: Single nucleotide variants at cis-regulatory element are associated with TPRG1
expression in DLBCL. (A) SNVs at a CRE interacting with the TPRG1 promoter. Top panel
shows position of SNVs at the CRE. Second panel shows chromatin looping interactions
between the TPRG1 promoter and CREs, with the interaction between the promoter and
the SNV-disrupted CRE colored yellow. Third panel details ChIP-seq histone mark signals in
naïve B-cells. Bottom panels show positions of BRD4-bound enhancers in DLBCL35. (B) CRE
mutation status and gene expression. Whilst the TPRG1 CRE is mutated in nine DLBCL
tumors, only six tumors are considered in the differential expression analysis, as three
permutation test. Boxplot hinges extend to the most extreme data points that are no more
than 1.5 times the interquartile range from the box.
Figure 4: Copy number variation at cis-regulatory element is associated with CD69
expression in DLBCL. (A) Loss of a CRE interacting with the CD69 promoter. Top panel shows
position of CNVs at CRE, all of which are copy number losses. Second panel shows chromatin
looping interactions between the CD69 promoter and CREs, with the interaction between
the promoter and the CNV-disrupted CRE colored yellow. Third panel details ChIP-seq
histone mark signals in naïve B-cells. Bottom panel shows positions of BRD4-bound
enhancers in DLBCL35. (B) CNV status at CRE and CD69 expression in DLBCL tumors. (C) CNV
status at CRE and ETV6 expression in DLBCL tumors. Association between copy number
status and gene expression assessed through linear regression. Boxplot hinges extend to the
most extreme data points that are no more than 1.5 times the interquartile range from the
box.
Figure 5: Copy number variation at cis-regulatory elements at T-cell receptor alpha locusis
associated with gene expression in DLBCL. (A) Gain and loss of a CRE interacting with the
MMP14 and PRMT5 promoters. Top panel shows position of CNVs at the CRE; with copy
number gains and losses represented by solid and dashed lines respectively. Second panel
shows chromatin looping interactions between the MMP14 and PRMT5 promoters and
CREs, with the interaction between the promoters and the considered CRE colored yellow.
Third panel details ChIP-seq histone mark signals in naïve B-cells. Bottom panels show
positions of BRD4-bound enhancers in DLBCL4. CNV status at CRE and expression of (B)
tumors are considered in the differential expression analysis, as one tumor also has a CNV at
the target genes. Association between copy number status and gene expression assessed
through linear regression. Boxplot hinges extend to the most extreme data points that are
no more than 1.5 times the interquartile range from the box.
Figure 6: Copy number variation at cis-regulatory element is associated with IGLL5
expression in B-cell malignancies. (A) The loss of a CRE interacting with the IGLL5 promoter.
Top panel shows position of CNVs at the CRE, all of which are losses, and the position of the
VJ junction. Second panel shows chromatin looping interactions between the IGLL5
promoter and CREs, with the interaction between the promoter and the considered CRE
colored yellow. Third panel details ChIP-seq histone mark signals in naïve B-cells. Bottom
panels shows positions of BRD4-bound enhancers in DLBCL35. CNV status at CRE and gene
expression in (B) DLBCL and (C) FL tumors. (D) CNV status at CRE and gene expression in
secondary analysis of CLL tumors. Association between copy number status and gene
expression assessed through linear regression. Boxplot hinges extend to the most extreme
FIGURE 1
CGCI and ICGC data (80 DLBCL and 37 FL)
Non-coding SNVs and indels
Gene expression CNVs
Analysis of CRE dysregulation
Normal CRE
Mutated CRE
CNV-affected CRE
or
Dysregulated expression
or
Dysregulated expression Normal expression
Naïve B-cell promoter CHi-C data Defining promoters
CRE
Gene promoter Interaction Defining CREs
-400bp Transcription +250bp
FIGURE 3
0
10
25
LPP >>>>>>>>>>>>>>>>>>>>>>>>>>>>>>>>
TPRG1 >>>>>>>>>>>>>>>>>> SST
RTP2<
BCL6<
chr 3 position (Mb)
187.50Mb 188.00Mb 188.50Mb 189.00Mb
0
10
25
LPP >>>>>>>>>>>>>>>>>>>>>>>>>>>>>>>>
TPRG1 >>>>>>>>>>>>>>>>>> SST
RTP2<
BCL6<
chr 3 position (Mb)
187.50Mb 188.00Mb 188.50Mb 189.00Mb
CHi-C interactions (CHiCAGO score) Histone mark signal BRD4-bound enhancers 0 10
SNVs at CRE
chr3:187,690,838 chr3:187,694,049
A)
B)
Mutated (n=6) Not mutated (n=38)
− 6 − 4 − 2 0
P = 0.0011
Gene e
xpression, log
2
(RPKM + 2)
P = 0.001
TPRG1 in DLBCL tumors
H3K27me3
H3K36me3 H3K4me1
FIGURE 4
Loss (n=5) No CNV (n=44)
0.5
1.5
2.5
3.5
P = 0.391
Gene e
xpression, log
2
(RPKM + 2)
CNVs CHi-C interactions (CHiCAGO score) Histone mark signal A) B) BRD4-bound enhancers 0 5 15 KLRF2> CLEC12A> CLEC12B> CLEC9A > GABARAPL1> KLRD1>
PRH2> ETV6 > > > > > > > > >
BCL2L14> CLEC2D > KLRF1> CLEC2B< CLEC2A< CLEC1B< CLEC1A< CLEC7A< OLR1< KLRK1< KLRC4 KLRC3< KLRC2< KLRC1< MAGOHB< STYK1 < TAS2R7 TAS2R8 TAS2R9 TAS2R10 PRR4 PRH1 TAS2R13 TAS2R14 TAS2R50 TAS2R20 TAS2R19 TAS2R31 TAS2R46 TAS2R43 TAS2R30 TAS2R42 PRB3 PRB4 PRB1 PRB2 LRP6 < CLECL1< CD69<
chr 12 position (Mb)
10.00Mb 10.50Mb 11.00Mb 11.50Mb 12.00Mb
●
●
●
●
Loss (n=5) No CNV (n=49)
0
2
4
6
P=0.0133
Gene e
xpression, log
2
(RPKM + 2)
CD69 in DLBCL tumors β = -1.73, P = 0.023
H3K27me3 H3K36me3 H3K4me1 H3K9me3 0 10 0 5 15 KLRF2> CLEC12A> CLEC12B> CLEC9A> GABARAPL1> KLRD1>
PRH2> ETV6 > > > > > > > > >
BCL2L14> CLEC2D > KLRF1> CLEC2B< CLEC2A< CLEC1B< CLEC1A< CLEC7A< OLR1< KLRK1< KLRC4 KLRC3< KLRC2< KLRC1< MAGOHB< STYK1 < TAS2R7 TAS2R8 TAS2R9 TAS2R10 PRR4 PRH1 TAS2R13 TAS2R14 TAS2R50 TAS2R20 TAS2R19 TAS2R31 TAS2R46 TAS2R43 TAS2R30 TAS2R42 PRB3 PRB4 PRB1 PRB2 LRP6 < CLECL1< CD69<
chr 12 position (Mb)
10.00Mb 10.50Mb 11.00Mb 11.50Mb 12.00Mb
C)
FIGURE 5
0
10
20
ABHD4> OXA1L>
MRPL52>
MMP14>
LRP10>
REM2>
DAD1 <
SLC7A7 < < <
RBM23 <
PRMT5<
chr 14 position (Mb)
22.40Mb 22.60Mb 22.80Mb 23.00Mb 23.20Mb 23.40Mb
CNVs CHi-C interactions (CHiCAGO score) A) B) BRD4-bound enhancer 0 10 20
ABHD4> OXA1L>
MRPL52>
MMP14>
LRP10> REM2>
DAD1 <
SLC7A7 < < <
RBM23 <
PRMT5<
chr 14 position (Mb)
22.40Mb 22.60Mb 22.80Mb 23.00Mb 23.20Mb 23.40Mb
●
Loss (n=19) No CNV (n=42) Gain (n=11)
1 2 3 4 5 6
P=0.01
Gene e
xpression, log
2
(RPKM + 2)
MMP14 in DLBCL tumors β = -0.60, P = 0.006
● ●
●
Loss (n=19) No CNV (n=42) Gain (n=11)
0.0 0.5 1.0 1.5 2.0 2.5
P = 0.0065
Gene e
xpression, log
2
(RPKM + 2)
PRMT5 in DLBCL tumors β = 0.29, P = 0.008
FIGURE 6
Loss (n=7) No CNV (n=41)
− 6 − 2 0 2 4 6
P=0.1176
Gene e
xpression, log
2
(RPKM + 2)
Loss (n=2) No CNV (n=24)
−
2
0
2
4
P=0.0105
Gene e
xpression, log
2
(RPKM + 2)
0
2
4
6
VPREB1 ZNF280B GGTLC2 IGLL5>
ZNF280A
PRAME<
chr 22 position (Mb)
22.40Mb 22.60Mb 22.80Mb 23.00Mb 23.20Mb 23.40Mb
CNVs CHi-C interactions (CHiCAGO score) Histone mark signal A) 0 2 4 6
VPREB1 ZNF280B GGTLC2 IGLL5>
ZNF280A
PRAME<
chr 22 position (Mb)
22.40Mb 22.60Mb 22.80Mb 23.00Mb 23.20Mb 23.40Mb
B)
IGLL5 in DLBCL tumors
β = 2.36, P = 0.118
●
● ● ● ●
Loss (n=10) No CNV (n=51)
− 4 − 2 0 2 4 6
P =0.0001
Gene e
xpression, log
2
(RPKM + 2)
BRD4-bound enhancer VJ junction 0 12 H3K27me3 H3K36me3 H3K4me1 H3K9me3 C)
IGLL5 in FL tumors
β = 4.13, P = 0.011
D)
IGLL5 in CLL tumors
SUPPLEMENTARY METHODS
Whole genome sequencing data
WGS data from the ICGC samples were downloaded from the ICGC DCC Data Portal as tumor and matched-normal BAM files aligned to GRCh37. WGS data from the CGCI samples were downloaded from dbGaP as tumor and matched-normal unaligned FASTQ files. We aligned CGCI sample reads to the same version of GRCh37
employed in the PCAWG project, using BWA MEM1. Duplicate reads were marked,
base quality scores recalibrated and local realignment around indels completed
using GATK (v3)2.
Calling SNVs and indels
For the ICGC samples, sets of SNVs, called using MuTect3 with data from dbSNP
v1324 and COSMIC noncoding variants v545 used for additional support, were
downloaded from the ICGC DCC Data Portal. For the CGCI samples, we called mutations across the whole genome using MuTect and data from the same versions of dbSNP and COSMIC. For both the ICGC and CGCI samples we used FoxoG to remove any mutations that may have been caused by oxidative DNA damage during
sample preparation6. In addition, we ensured that variants were supported by a
minimum of one alternative read in each strand direction, a mean Phred base quality score >26, mean mapping quality ≥50, and an alignability site score of 1 when using the alignability of 100mers by GEM from ENCODE. To minimize the likelihood of false positives, the Duke excluded and HiSeqDepth top 5% regions defined by UCSC Genome Browser were omitted from the analysis. Furthermore, we excluded immune system-coupled somatic hypermutation regions corresponding to 429 annotated immunoglobulin loci and the major histocompatibility complex loci (with each region extended by 50kb, as defined in Ensembl v73).
For the ICGC samples, small insertions and deletions (indels), called using Platypus7,
Calling structural variants
For the ICGC samples, somatic CNVs called using ascatNgs8, and translocation and
inversion breakpoints called using DELLY9, were downloaded from the ICGC DCC
Data Portal. For the CGCI samples, we also called somatic CNVs using ascatNgs and translocation and inversion breakpoints using DELLY.
RNA-sequencing data
ICGC tumor sample RNA-seq data were downloaded as aligned BAM files from the ICGC DCC Data Portal. As part of the PCAWG project, reads in these files were
aligned to GRCh37 using TopHat210 and GENCODE v19 annotated mRNA transcripts.
We downloaded CGCI tumor sample RNA-seq data as unaligned FASTQ files from dbGaP and aligned reads using a pipeline identical to that used to align the ICGC sample reads. For both the ICGC and CGCI samples, we computed read counts using
htseq-count and excluded genes with zero counts in >90% of tumors11. We applied
upper-quartile normalization and computed RPKM values. Batch correction between
cohorts was conducted using ComBat12. To avoid taking the logarithm of negative
values, 2 was added to RPKM values before they were log2 transformed.
Classification of DLBCL as ABC or GCB
DLBCL tumors were assigned to ABC, GCB and Unclassified subtypes as per Reddy et
al.13. Using this approach, 32 DLBCL tumors were classified as ABC, 39 as GCB and 9
as Unclassified.
Additional filtering of CHi-C data
We performed an additional filtering of the CHi-C data to remove regions identified
as duplicated in hg38, but not hg1914, as these may lead to the false identification of
Mutational signature analysis
Signatures reported by Alexandrov et al.15 were attributed to each sample using
Palimpsest with default parameters (Table S6)16, 17. Only those signatures previously
observed in B-cell lymphoma and lymphoid cells were considered (SBS1, SBS2, SBS3, SBS5, SBS6, SBS9, SBS13, SBS17a, SBS17b, SBS34, SBS36, SBS37, SBS40, SBS42, SBS84
and SBS85)15. Mutations caused by canonical activation-induced cytidine deaminase
(AID) tend to cluster in the genome18, and we therefore classified mutations as
clustered or non-clustered and attributed signatures to these mutations
separately15. Mutations were classified as clustered if the minimum distance to all
other mutations on the same chromosome in the same tumour was less than
1,000bp18. The numbers of clustered and non-clustered mutations associated with
each signature in each tumour was then summed to calculate the overall
contribution of each signature to each tumour. As per Letouzé et al.16, we computed
the probability that each somatic mutation occurs as a result of the process underlying each mutational signature, considering the substitution type and the overall contribution of each signature to each tumour. To assess whether each recurrently mutated promoter and CRE was enriched with mutations attributed to each signature, we compared the probability distribution of mutations in the regulatory element to the probability distribution of all other mutations observed in tumours in which the regulatory element was mutated, using a one-sided Wilcoxon
rank-sum test. We consider a significance threshold of P<0.05 to be suggestive of
signature enrichment.
RSS motif identification
We used FIMO to identify RSS sites at CNV boundaries19, with weights for position
weight matrices taken from a reported RSS conservation table20. For each
CRE-disrupting CNV associated with differential gene expression, we scanned windows of 1kb centered on each CNV boundary called by ascatNgs, to allow for ambiguity in the exact position of the boundary. Spacer lengths of 9-13bp and 20-25bp were allowed
between the motifs21. In Table S13 we report those RSS sites with a space of correct
Subtype analyses
For those CREs affected by mutations associated with differential target gene expression, we assessed the enrichment of DLBCL COO subtypes in the affected tumors. For each COO subtype enrichment was assessed using a two-tailed Fisher’s exact test, comparing tumors from the subtype against all other tumors.
Integrated analysis of coding and non-coding mutations
The tendency of coding and non-coding mutations affecting genes to occur in different tumors was assessed using a two-tailed Fisher’s exact test. Pathways significantly altered by coding and non-coding mutations in DLBCL were identified
using Reactome22, with significance thresholded at Q<0.1. 150 genes with recurrent
coding mutations in DLBCL identified by Reddy et al. were included in this analysis13.
Epigenetic annotation of regulatory regions
ChIP-seq data from naïve B cells (NC14_42), CD38-negative naïve B cells (S004KB), germinal center B cells (T14_10), unswitched memory B cells (pool_9) and class-switched memory B cells (csMBC_pool_2) for H3K4me1, H3K27me3, H3K9me3 and H3K36me3 were downloaded from BLUEPRINT. Co-ordinates were mapped from GRCh38 to GRCh37 using liftOver. BRD4-loaded enhancers, defined using ChIP-seq
data from the Ly1 cell line, were obtained from Chapuy et al.23, and co-ordinates
mapped from NCBI36 to GRCh37 using liftOver.
REFERENCES
1. Li H. Aligning sequence reads, clone sequences and assembly contigs with
BWA-MEM. arXiv. 2013.
2. McKenna A, et al. The Genome Analysis Toolkit: a MapReduce framework for
analyzing next-generation DNA sequencing data. Genome Res. 2010; 20 (9):
1297-1303.
3. Cibulskis K, et al. Sensitive detection of somatic point mutations in impure
4. Sherry ST, et al. dbSNP: the NCBI database of genetic variation. Nucleic Acids
Res. 2001; 29 (1): 308-311.
5. Forbes SA, et al. COSMIC: exploring the world's knowledge of somatic
mutations in human cancer. Nucleic Acids Res. 2015; 43 (Database issue): D805-811.
6. Costello M, et al. Discovery and characterization of artifactual mutations in
deep coverage targeted capture sequencing data due to oxidative DNA damage
during sample preparation. Nucleic Acids Res. 2013; 41 (6): e67.
7. Rimmer A, et al. Integrating mapping-, assembly- and haplotype-based
approaches for calling variants in clinical sequencing applications. Nat Genet. 2014;
46 (8): 912-918.
8. Raine KM, et al. ascatNgs: Identifying Somatically Acquired Copy-Number
Alterations from Whole-Genome Sequencing Data. Curr Protoc Bioinformatics. 2016;
56 15 19 11-15 19 17.
9. Rausch T, Zichner T, Schlattl A, Stutz AM, Benes V, Korbel JO. DELLY:
structural variant discovery by integrated paired-end and split-read analysis. Bioinformatics. 2012; 28 (18): i333-i339.
10. Kim D, Pertea G, Trapnell C, Pimentel H, Kelley R, Salzberg SL. TopHat2:
accurate alignment of transcriptomes in the presence of insertions, deletions and
gene fusions. Genome Biol. 2013; 14 (4): R36.
11. Anders S, Pyl PT, Huber W. HTSeq--a Python framework to work with
high-throughput sequencing data. Bioinformatics. 2015; 31 (2): 166-169.
12. Johnson WE, Li C, Rabinovic A. Adjusting batch effects in microarray
expression data using empirical Bayes methods. Biostatistics. 2007; 8 (1): 118-127.
13. Reddy A, et al. Genetic and Functional Drivers of Diffuse Large B Cell
Lymphoma. Cell. 2017; 171 (2): 481-494 e415.
14. Hoang PH, et al. Whole-genome sequencing of multiple myeloma reveals
oncogenic pathways are targeted somatically through multiple mechanisms. Leukemia. 2018.
15. Alexandrov L, et al. The Repertoire of Mutational Signatures in Human
16. Letouze E, et al. Mutational signatures reveal the dynamic interplay of risk
factors and cellular processes during liver tumorigenesis. Nat Commun. 2017; 8 (1):
1315.
17. Shinde J, et al. Palimpsest: an R package for studying mutational and
structural variant signatures along clonal evolution in cancer. Bioinformatics. 2018;
34 (19): 3380-3381.
18. Kasar S, et al. Whole-genome sequencing reveals activation-induced cytidine
deaminase signatures during indolent chronic lymphocytic leukaemia evolution. Nat
Commun. 2015; 6 8866.
19. Grant CE, Bailey Tl Fau - Noble WS, Noble WS. FIMO: scanning for
occurrences of a given motif. Bioinformatics. 2011; 27 1017-1018.
20. Hesse JE, Lieber MR, K. M, Gellert M. V(D)J recombination: a functional
definition of the joining signals. Genes and Development. 1989; 3 (7): 1053-1061.
21. Papaemmanuil E, et al. RAG-mediated recombination is the predominant
driver of oncogenic rearrangement in ETV6-RUNX1 acute lymphoblastic leukemia. Nature Genetics. 2014; 42 (2): 116-125.
22. Croft D, et al. Reactome: a database of reactions, pathways and biological
processes. Nucleic Acids Res. 2011; 39 (Database issue): D691-697.
23. Chapuy B, et al. Discovery and characterization of super-enhancer-associated
0
10
25
LPP >>>>>>>>>>>>>>>>>>>>>>>>>>>>>>>>
TPRG1 >>>>>>>>>>>>>>>>>>
SST
RTP2<
BCL6<
chr 3 position (Mb)
187.50Mb 188.00Mb 188.50Mb 189.00Mb
0
10
25
LPP >>>>>>>>>>>>>>>>>>>>>>>>>>>>>>>>
TPRG1 >>>>>>>>>>>>>>>>>>
SST
RTP2<
BCL6<
chr 3 position (Mb)
187.50Mb 188.00Mb 188.50Mb 189.00Mb
CHi-C interactions (CHiCAGO score)
Naive B cell
0
15
CD38-negative naive B cell
0
20
Germinal center B cell
0
30
Unswitched memory B cell
0
8
Class-switched memory B cell
0 20 H ist o n e ma rk si g n a l H3K27me3 H3K36me3 H3K4me1 H3K9me3 CRE
CHi-C interactions (CHiCAGO score) 0 5 15 KLRF2> CLEC12A> CLEC12B> CLEC9A > GABARAPL1> KLRD1>
PRH2> ETV6 > > > > > > > > >
BCL2L14 > CLEC2D > KLRF1> CLEC2B< CLEC2A < CLEC1B< CLEC1A < CLEC7A< OLR1< KLRK1< KLRC4 KLRC3< KLRC2< KLRC1< MAGOHB< STYK1 < TAS2R7 TAS2R8 TAS2R9 TAS2R10 PRR4 PRH1 TAS2R13 TAS2R14 TAS2R50 TAS2R20 TAS2R19 TAS2R31 TAS2R46 TAS2R43 TAS2R30 TAS2R42 PRB3 PRB4 PRB1 PRB2 LRP6 < CLECL1< CD69<
chr 12 position (Mb)
10.00Mb 10.50Mb 11.00Mb 11.50Mb 12.00Mb
0 5 15 KLRF2> CLEC12A> CLEC12B> CLEC9A > GABARAPL1> KLRD1>
PRH2> ETV6 > > > > > > > > >
BCL2L14 > CLEC2D > KLRF1> CLEC2B< CLEC2A < CLEC1B< CLEC1A < CLEC7A< OLR1< KLRK1< KLRC4 KLRC3< KLRC2< KLRC1< MAGOHB< STYK1 < TAS2R7 TAS2R8 TAS2R9 TAS2R10 PRR4 PRH1 TAS2R13 TAS2R14 TAS2R50 TAS2R20 TAS2R19 TAS2R31 TAS2R46 TAS2R43 TAS2R30 TAS2R42 PRB3 PRB4 PRB1 PRB2 LRP6 < CLECL1< CD69<
chr 12 position (Mb)
10.00Mb 10.50Mb 11.00Mb 11.50Mb 12.00Mb
H3K27me3
H3K36me3 H3K4me1
H3K9me3
Naive B cell
CD38-negative naive B cell
Germinal center B cell
Unswitched memory B cell
Class-switched memory B cell
H ist o n e ma rk si g n a l
Figure S2. Loss of a CRE interacting with the CD69 promoter. Top panel shows position of CNVs at the CRE, all of which are copy number
losses. Second panel shows chromatin looping interactions between the CD69 promoter and CREs, with the interaction between the promoter
0 5 0 9 0 15 0 10 0 10 0 5 15 KLRF2> CLEC12A> CLEC12B> CLEC9A > GABARAPL1> KLRD1>
PRH2> ETV6 > > > > > > > > >
BCL2L14 > CLEC2D > KLRF1> CLEC2B< CLEC2A < CLEC1B< CLEC1A < CLEC7A< OLR1< KLRK1< KLRC4 KLRC3< KLRC2< KLRC1< MAGOHB< STYK1 < TAS2R7 TAS2R8 TAS2R9 TAS2R10 PRR4 PRH1 TAS2R13 TAS2R14 TAS2R50 TAS2R20 TAS2R19 TAS2R31 TAS2R46 TAS2R43 TAS2R30 TAS2R42 PRB3 PRB4 PRB1 PRB2 LRP6 < CLECL1< CD69<
chr 12 position (Mb)
10.00Mb 10.50Mb 11.00Mb 11.50Mb 12.00Mb