265 |
P a g e
VORTEX MANIPULATION BY CHANGING
GEOMETRY AND ORIENTATION
Peram Laxmi Reddy
1, S Sujeeth Kini
2, Sushma Y
31
Assistant Professor, Mechanical Engineering,
Geethanjali College of Engineering and Technology, (India)
2,3
Student, Mechanical Engineering, CVR College of Engineering, (India)
ABSTRACT
Effect of curvature and orientation on vortex formation is presented in this paper. Different types of chord are taken of radii 17.5, 25 of a circle keeping the chord length 35mm. Flow analysis is done at Reynolds no. 900 by changing the orientation of the arc. Increment of 5° is made to the flow direction in anti-clockwise fashion and the results are compared with a straight edge model. Introducing curvature in the model has shown effect on vortex size and formation. Arc-2 model shows significant effect at orientation 15°.
Keywords: Mass Entrainment, Stagnation Point, Streamline Flow, Vortex, Arcs
I. INTRODUCTION
Vortex dynamics play an important role in all the three transport processes. Therefore, vortex manipulation is
the key for the efficiency of any device that involves mixing. For example, the fuel–air mixing in combustion
chambers is a dictating process governing the combustion efficiency. A mixing process involving more than two
streams or two species should have an appropriate combination of large and small vortices for efficient mixing.
It is well known that large vortex structures are efficient suction creators, but they are highly unstable and easily
get fragmented into small vortices. Therefore, they are short lived and cannot travel long distances in a flow
field. In contrast, small vortices are stable and could travel long distances in a flow field, but because of their
small size, they are poor suction creators. However, because of their long life they are efficient mixing
promoters. Therefore, in a flow process such as a free jet, where the surrounding fluid needs to be inducted into
the jet flow, and the inducted low momentum fluid mass needs to be transported towards the jet axis, an
appropriate proportion of the mass entraining large vortices at the jet periphery, and the mass transporting small
vortices inside the jet field for efficient mixing is required .However, even though it is understood that an
appropriate proportion of large and small vortices are essential for efficient mixing, identifying such a
proportion and generating the desired sizes of large and small structures still remains a black box. Even though
vast literature is available for enhancing the mixing in a number of engineering devices, almost all the reported
information is on the end result of mixing efficiency. For example, Griffin and Ramberg[1] studied vortex
shedding from a vibrating cylinder in a uniform flow. They found that the vortex shedding takes place Re 190
onwards. Ayoub and Karamcheti[2] experimentally studied uniform flow past a finite cylinder at high subcritical
and supercritical Reynolds number (Re), and reported cellular structure in the wake. Also, they found that the
wake region could be subcritical even when the main flow is supercritical. Griffin[3] investigated bluff body
266 |
P a g e
have been proposed earlier. He visualized vortex shedding at Re 200 for a circular cylinder. Prasad andWilliamson[4] studied the instability of shear layer separating from a bluff body. It was found that the span wise
end conditions, which control the primary vortex shedding from the cylinder, affect the instability of the
separated shear layer. There was wake formation even at Re 260. Okajima et al[5]. studied flow-induced
oscillation of a circular cylinder in a water tunnel. They investigated the response amplitude of a
two-dimensional circular cylinder with increasing flow velocity. Konstantinidis and Balabani[6] reported symmetric
vortex shedding in the near wake region of a circular cylinder due to stream wise perturbation in the Re range
1200–1240. All these investigations are on the effect of the vortices shed by the cylinder on the flow field
behind it. These investigations do not focus on the size of the vortex and its manipulation. But the vortex size
and its management are essential for applications involving mass entrainment and mixing. For example,
Lovaraju and Rathakrishnan[7] reported that introduction of vortices with control tabs into a jet flow can result in
an enhanced mixing. This is because of the active interaction between the mass entraining vortices formed at the
jet boundary and the stream wise vortices shed by the tab. Also, Thanigaiarasu et al. studied flat and arc tabs,
and found that reducing the size of the vortices shed by changing the flat tab into a circular arc is more
beneficial in view of mixing enhancement. Even though these studies present the effect of vortex size on the
flow field intuitively, there is no direct information on the vortex size and management. Therefore, in this study
an attempt is made to visualize and measure the size of vortices behind a flat plate and manipulate the vortex
size with circular arc plates of three specific radii. In other words, an attempt is made to investigate the physics
behind the generation and size manipulation of twin vortices behind flat and arc plates at some specified
Reynolds numbers.
II. EXPERIMENTAL SETUP
The channel is made of G.I sheet of 5mm thickness and the sheet was bent into the shape as shown in the figure.
The width of the test section is of about 280mm and the depth of water will be maintained 8mm. Photographic
view of the channel is shown in Fig.2.1. To get flow visualization die is injected into the system. To inject the
die in channel injection system is established. The injection system comprises of mainly three parts such as
burette, stand, and an injection valve consisting of a pipe connected to the burette as shown in the Fig. 2.2. A
valve is provided at the end of the injection system for controlling amount of flow is to be injected into the
channel. The main use of this injection system is to provide the flow along with the water without creating any
disturbance in the flow.
2.1 Calculation of Reynolds number
The Reynolds number plays an important role in the fluid dynamics, because it is the only reference parameter
for the representation of the drag on the bluff bodies. It also plays a main role in the representation of the flow
feature in the visualization techniques. To find out the Reynolds number first the main parameter needed is
velocity of flow which can be measured by the different techniques. Among the many other techniques, floating
particle method is used to in the present study. In the floating particle method, time taken to the travel floating
particle over a distance is estimated. The velocity can be calculated by dividing the distance with the time. After
finding out the velocity the Reynolds number can be calculated with reference to the width of the model by
using the following formula:
267 |
P a g e
Figure 2.1: Open channel Figure 2.2: Injection System
2.2 Experimental Model
Experiment is carried out with four different models, of which three models have an arc shape of different radii
and same chord length, which are compared to a flat model of length equal to the chord length of arcs. The
detailed dimensions of models are shown in below Table 2.2.1.
Table 2.2.1: Details of Models
S.no
Model Name
Shape
Dimensions
1
Model-1
Arc
17.5R chord length 35
2
Model-2
Arc
25R chord length 35
3
Model-3
Flat
35*5
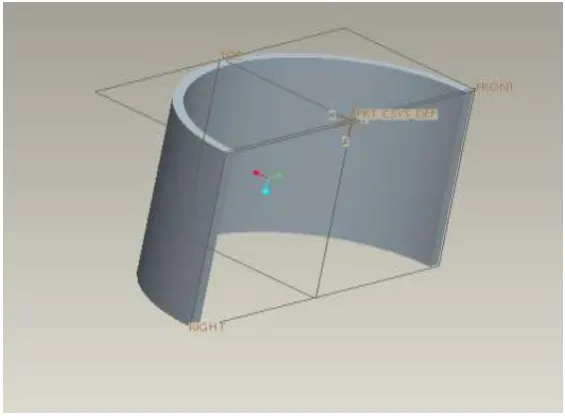
The Fig.2.2.1 shows the artistic view of Model-1 it contains radius of 17.5 and chord length equal to 35mm, i.e.
it’s a semi circular shape.
Figure 2.2.1: Model-1 of diameter 35mm & chord length 35mm
268 |
P a g e
Figure 2.2.2: Model-2 of diameter 50mm & chord length 35mm
2.3 Experimental Procedure
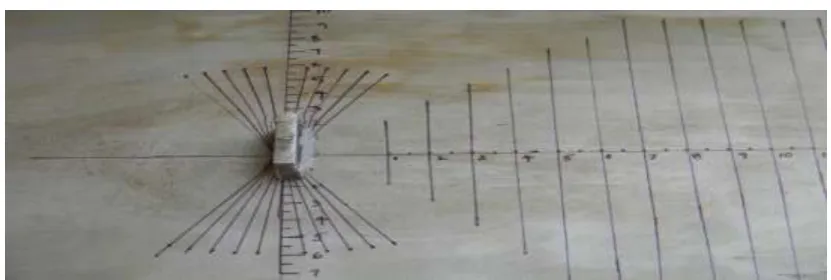
In the first step, mark the scale and the angles on the test section portion of the channel, which will be used to
measure the flow parameters. Fig.2.3 shows the marking on channel. Place the channel on fine and a straight
place which has no inclination. Now, give the water supply to the channel at the water chamber, so that the
fairly uniform flow will be entering into the test section due to the effect of wedge and screens. Test for the
uniformity of the flow i.e., either the flow was going in the straight line from starting to the end of the channel,
if not make some adjustments to get the uniform flow.
Velocity is to be set in the channel according to the requirement. The velocity of flow can be calculated by using
the floating particle method. Now, inject the sufficient amount of dye at the second screen which will help to get
the streamline flow. Take the video from the start to the end of flow pattern over the object for further
investigation. From the video extract the frames and keep the necessary frames for the analysis.
Figure 2.3: Marking on the Channel
III. RESULTS AND DISCUSSION
The experimental results consist of the video of the flow field over the flat and arc plates of the present scheme
at different orientations from 0° to 20° at two Reynolds numbers and the vortex lengths, for different cases.
When the model is at an angle with the incoming flow, the twin vortices assume different lengths. Before
getting into the quantitative aspects of the vortex size, it is necessary to understand the flow physics behind the
formation of these vortices. It was found that on reaching the forward stagnation point, the flow encounters a
269 |
P a g e
curved streamlines, find a large space at the back of the model on reaching the edges and turn towards the modelbase. This process of turning towards the base results in the formation of two vortices of opposite nature.
Because of these vortices formation, a low pressure region is created at the model base. When the flow velocity
increases, the suction at the base increases as well. This low pressure at the base attracts the flow from the zone
just downstream of the vortices, towards the base. Thus, a reverse flow towards the base is established.
With increase in flow velocity, the suction at the base progressively increases reaching a stage at which the
twin-vortex formation behind the model is due to the reverse flow rather than the roll-in of the incoming flow
from the edges. Under this situation, the streamlines of the flow from the model face are pushed away by the
vortices formed by the reverse flow. Thus, there is a definite location behind the model where the reverse flow
begins and reaches the model base, establishing twin-vortex. However, there is no quantitative information
about the location of the beginning of the reverse flow and its sensitivity to the object geometry and flow
Reynolds number. To gain an understanding of this important aspect of reverse flow, the location, which has
been identified as the end of the twin vortex, its sensitivity to the plate geometry, and its orientation has been
analyzed in this study.
3.1 Flow over a Flat Plate
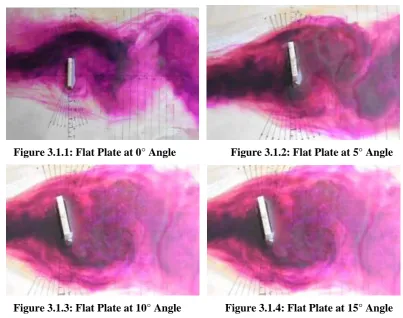
The following figures 3.1.1 ,3.12 ,3.1.3,3.1.4 & 3.1.5 shows the flow over a flat plate of orientation from 0° to
20°.Has changing orientation from 0° to 20° the left and right vortex increased up to 5° then after right vortex
size increase and left vortex size decreased. The deviation of vortex size of left and right is same up to 15° no
effect is then after.
Figure 3.1.1: Flat Plate at 0° Angle Figure 3.1.2: Flat Plate at 5° Angle
270 |
P a g e
Figure 3.1.5: Flat plate at 20° angle
3.2 Flow Over a Model-1 Arc
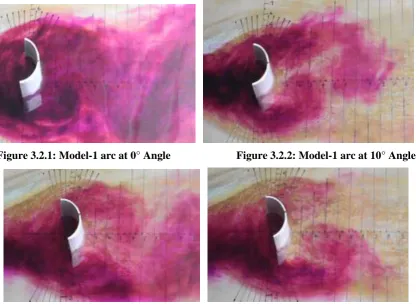
The following figures 3.2.1, 3.2.2, 3.2.3, & 3.2.4 show the flow over a model-1 arc of orientation from 0° to 20°.
In this model left and right vortex increased up to 5°.Right vortex increased up to 5° and no significant effect
then after .up to 15° later it is increased. Left vortex is decreased from 5° to 20°. In all the position right vortex
size is more compared to left vortex.
Figure 3.2.1: Model-1 arc at 0° Angle Figure 3.2.2: Model-1 arc at 10° Angle
Figure 3.2.3: Model-1 arc at 15° Angle Figure 3.2.4: Model-1 arc at 20° Angle
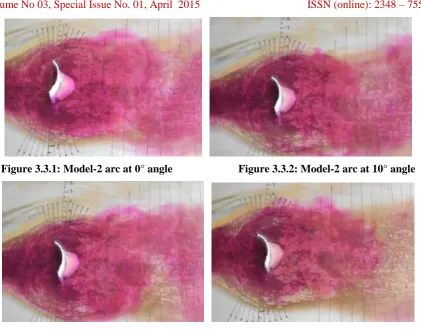
3.3 Flow over a Model-2 arc
The following figures 3.3.1, 3.3.2, 3.3.3 & 3.3.4 show the flow over a model-2 arc of orientation from 0° to 20°.
Arc 2 shows different effect compared to the other models. Vortex size increases up to 5°.Left and Right vortex
271 |
P a g e
Figure 3.3.1: Model-2 arc at 0° angle Figure 3.3.2: Model-2 arc at 10° angle
Figure 3.3.3: Model-2 arc at 15° angle Figure 3.3.4: Model-2 arc at 20° angle
3.4 Vortex Size
To quantify the vortex size, the vortex length has been taken as the representative measure. The vortex size
measured from the visualization pictures has been non dimensional zed with the chord of the flat plate and the
arcs. Here the shortest distance between the tips of the plate is termed the chord.
The vortex length variation with plate orientation for Re 900 is shown. It is seen that up to a 100 orientation, the
size of the vortex is almost closer to the chord length. Also, the difference between the left and right vortices is
significant. However, beyond 100 the vortex behind the edge in the front (left vortex) is larger than that behind
the edge in the rear (right vortex). The vortex size variation for arc-1 at Re 900 is shown. It is seen that the
curvature introduced to the plate results in the elongation of the vortices at Ɵ in the range 0°-15°. However, the
difference between the length of left and right vortices continues to be not significant at all values of Ɵ. Further,
for Ɵ beyond 15°, the size of the vortices appears to be significant to Ɵ. The vortex size variation for arc-2 at Re
900 is shown. This is the case of an arc with reduced radius of curvature than the arc-1, i.e. the geometric
deviation from the flat plate is larger than arc-1. For this case too, the vortex length is larger when compared
with the vortex behind the flat plate for Ɵ from 0° to 15°. However, the difference between the size of left and
right vortices is lesser than that for arc-1 for Ɵ ranging 0°-20°.
IV. CONCLUSIONS
At Reynolds number 900 the flow over flat plate and arcs of radii 17.5 mm and 25mm is studied. It is found that
there is a definite location behind the plate where the reverse flow begins and reaches the plate base,
272 |
P a g e
an object with geometrical modification, and changing its orientation. Flat plate model has show significanteffect up to 15°. As introducing arc geometry vortex size is same at 0° orientations. As changing orientation
arc-2 shows different vortex nature with arc-1 model. And left and right vortex size is show significant effects.
Arc-2 model has show significant effect of left and right vortex formation at 15° orientation.
REFERENCES
[1] Griffin, O. M. and Ramberg, S. E. Vortex shedding from a cylinder vibrating in line with an incident
uniform flow. J. Fluid Mech., 1976, 75, 257–271.
[2] Ayoub, A. and Karamcheti, K. An experiment on the flow past a finite circular cylinder at high
subcritical and supercritical Reynolds numbers. J. Fluid Mech., 1982, 118, 1–26.
[3] Griffin, O. M. A note on bluff body vortex formation. J. Fluid Mech., 1995, 284, 217–224.
[4] Prasad, A. and Williamson, C. H. K. The instability of the shear layer separating from a bluff body. J.
Fluid Mech., 1997, 333, 375–402.
[5] Okajima, A., Kosugi, T., and Nakamura, A. Flow-induced in-line oscillation of a circular cylinder in a
water tunnel. ASME J. Press. Vessel Technol., 2002, 124, 89–96.
[6] Konstantinidis, E. and Balabani, S. Symmetric vortex shedding in the near wake of a circular cylinder due
to stream wise perturbations. J. Fluids Struct.2007, 23, 1047–1063.
[7] Lovaraju, P. and Rathakrishnan, E. Subsonic and sonic jet control with crosswire. AIAA J., 2006, 44(11),