X -ray and o p tica l stu d ies o f
A c tiv e G alactic N u clei
J o n a th a n P a tr ic k D u n c a n M it t a z
Mullard. Space Science Laboratory
Department o f Physics and Astronom y
University College London
A thesis subm itted to the University of London for the degree of Doctor of Philosophy
ProQuest Number: 10608874
All rights reserved
INFORMATION TO ALL USERS
The qu ality of this repro d u ctio n is d e p e n d e n t upon the q u ality of the copy subm itted.
In the unlikely e v e n t that the a u th o r did not send a c o m p le te m anuscript and there are missing pages, these will be note d . Also, if m aterial had to be rem oved,
a n o te will in d ica te the deletion.
uest
ProQuest 10608874
Published by ProQuest LLC(2017). C op yrig ht of the Dissertation is held by the Author.
All rights reserved.
This work is protected against unauthorized copying under Title 17, United States C o d e M icroform Edition © ProQuest LLC.
ProQuest LLC.
789 East Eisenhower Parkway P.O. Box 1346
Sum m ary
Active Galactic Nuclei are among the most highly energetic objects in the universe, but they are still poorly understood. Of particular interest at the mom ent is the existence and effects of massive accretion disks near the centre of AGN. Accretion disks have been invoked to explain both the UV and soft X-ray continuum in AGN and have also been used to try and explain the characteristics of the observed X-ray variability in AGN.
This thesis describes both optical and X-ray observations of Active G alactic Nuclei. The optical data consists of a soft X-ray selected sample taken from the E X O S A T High Galactic Latitude Survey. In chapter 1, an extensive introduction details current theories about the continuum and line emission in AGN. Chapters 2-5 then go on to detail the results obtained from AGN identified from the E X O S A T HGLS, w ith detailed studies of both the continuum and line emission properties. The conclusion from the analysis is th a t the E X O S A T HGLS contain objects with a strong soft X-ray excess, and th a t the origin of the soft excess is from the high energy tail of an accretion disk. The edge-on disk model of Laor and Netzer (1990) is favoured. The emission lines indicate th a t these objects axe in no way different from other AGN, and imply th a t the soft X-ray excess m ust be em itted anisotropically. There is also a slight suggestion of a change in the spectral characteristics of the AGN as a function of luminosity.
C o n ten ts
1 In tr o d u ctio n 12
1.1 A brief overview of the structure of AGN ...12
1.2 The different classes of AGN ... 14
1.3 The central e n g i n e ... 16
1.3.1 Dense Star C l u s t e r s ... 17
1.3.2 ‘Spinars’ or ‘m agnetoids’ ... 17
1.3.3 Massive black h o le s... 17
1.4 The continuum emission from A G N ... 19
1.4.1 Narrow Emission Line O b j e c t s ... 19
1.4.2 Seyfert 2 ’s ...21
1.4.3 Seyfert l ’s and QSO’s ...21
1.4.3.1 The medium energy X-ray e m is s i o n ... 23
1.4.3.2 The Radio - optical c o n tin u u m ... 25
1.4.4 Therm al emission - the blue b u m p ...27
1.4.5 O ther continuum co m p o n e n ts ...30
1.4.6 Blazars ...32
1.5 The emission l i n e s ...34
1.5.1 The Broad L i n e s ... 34
1.5.1.1 The Emission Line c lo u d s ... 34
1.5.1.2 Models for the production of the Broad l i n e s ...36
1.5.1.3 The Iron Line problem ... 38
1.5.1.4 Anisotropic continuum e m is s i o n ...39
1.5.1.5 Line emission from accretion d i s k s ... 40
1.5.1.6 Broad Line profiles ...43
1.5.2 The Narrow Lines ...• ...45
1.6 Conclusion ... 47
2 T h e E X O SA T H igh G alactic L a titu d e S u rv e y 49 2.1 In tro d u c tio n ...49
2.2 The E X O S A T s a te l li te ...49
2.3 Source searching E X O S A T f i e l d s ... 51
2.4 The HGLS s a m p l e ... 56
2.4.1 The identification p r o c e s s ... 56
2.5 The MSSL s a m p l e ... 57
2.5.1 The D ata Analysis of the optical s p e c tra ...57
2.5.2 The Stellar C o n t e n t ...58
2.5.3 The AGN content of the MSSL sample - The X-ray properties . . 61
2.5.3.1 The spectral slope of the AGN in the 14 MSSL fields . . 61
2.5.3.2 The Spectral Slope of the AGN from the complete HGLS s a m p le ... 63
2.5.4 The AGN content of the MSSL sample - The Optical properties . 63 2.5.4.1 Classification of A G N ... 63
2.5.4.2 The classification of the low-luminosity o b je c ts ...64
2.5.4.3 The other active g a l a x ie s ...66
2.5.5 R e d s h if t...66
2.5.6 Individual O b j e c t s ... 67
3 T h e M SSL A G N - T h e o p tic a l co n tin u u m 76 3.1 In tro d u c tio n ... 76
3.2 The optical c o n tin u u m ... 76
3.3 AGN C o lo u r s ... 77
3.4 The different continuum c o m p o n e n ts ...81
3.4.1 The Power law and therm al blue bump ... 81
3.4.1.1 The accuracy of extrapolating a single power-law into the U V ... 82
3.4.1.2 The power-law s l o p e s ... 83
3.4.1.3 Direct evidence for a Therm al c o m p o n e n t...88
3.4.1.4 In terpretatio n of the power-law d a t a ...88
3.4.2 The overall energetics of the sample - the Seyferts and Quasars . . 91
3.4.3 The overall energetics of the sample - the narrow line objects . . . 98
3.5 Other continuum m e c h a n is m s ... 99
3.5.1 The B alm er/Paschen c o n t in u u m ... 99
3.5.2 Two photon em ission...102
3.5.3 S ta rlig h t... 104
3.6 The X-ray flux and a ox ... 105
3.6.1 Evidence for a steep com p o n en t... 105
3.6.2 The a o x ... 106
3.7 The BL L a c s ...107
4 T h e M SSL A G N - th e em issio n lin es 114
4.1 D ata r e d u c t i o n ... 114
4.2 Observations of the Broad l i n e s ... 115
4.2.1 The Line F l u x e s ... 115
4.2.2 Line-Luminosity c o r r e l a ti o n s ...119
4.2.2.1 The Ha/H/3 dependence on lum inosity ... 120
4.2.3 EW -luminosity c o r r e la tio n s ...123
4.2.4 The F ell li n e s ... 126
4.2.5 The Line P ro file s ... 129
4.2.6 Velocity dependence of line r a tio s ... 133
4.3 The Narrow emission li n e s ...137
4.3.1 C o rrelatio n s... 137
4.3.2 Physical condition of the N L R ...138
5 T h e M SSL A G N - C o n clu d in g rem arks 141 6 V ariab ility in A G N - E X O S A T o b serv a tio n s o f N G C 6 8 1 4 143 6.1 In tro d u c tio n ...143
6.2 X-ray tim e lin e s ... 145
6.2.1 Low Energy CMA d a t a ... 145
6.2.2 Medium Energy d a t a ...147
6.2.2.1 A utocorrelation an aly sis... 152
6.2.2.2 Power spectra an alysis...154
6.2.2.3 Fractal analysis ... 158
6.3 Interpretation of the flux v a r i a b i l i t y ...160
6.3.1 Nuclear flares visible for a face-on g e o m e tr y ...162
6.3.2 P air production in s ta b ilitie s ... 162
6.3.3 Possible disk origin of the flares and oscillations... 165
6.3.4 The issue of ‘characteristic’ tim e s c a le s ...166
6.4 X-ray S p e c tr a ...166
6.4.1 Interpretation of the Spectral V ariab ility ... 170
6.5 C o n clu sio n s... 171
A S P E C T R U M - a fittin g p rogram 172 A .l Fitting M e th o d ...172
A. 1.1 The gradient and the H e s s ia n ...173
A .1.2 The Levenberg-M arquardt m e t h o d ... 174
A .I.3 Convergence c r i t e r i a ... 174
A.2 Errors on the fit ... 175
A.2.1 Using the covariance m a tr ix ... 176
A .3 The m o d e l s ... 179
A ck n o w led g em en ts 184
List o f F igu res
1.1 A Simplified picture of the center of an A G N ... 13
1.2 Five different sort of Active G a la x y ... 15
1.3 The to tal flux and the polarized flux for NGC1068 showing the broad lines seen in polarized l i g h t ... 22
1.4 The continuum emission from Mkn841 from the radio to the X-ray . . . . 24
1.5 The distribution of slopes from the Wilkes and Elvis (1987)sample . . . . 26
1.6 The Fv vs v distributions for a sample of PG q u a s a rs ...28
1.7 Some weak bump quasars from McDowell et al. ( 1 9 8 9 )... 29
1.8 The EUV spectrum of HS1700+6416 ... 31
1.9 The change in the observed spectrum of an accretion disk as a function of a n g l e ... 41
1.10 The model assumed by Collin-Souffrin et al. (1988) to explain both low and high ionization l i n e s ... 42
1.11 An example of a doubled peak profile in a cataclysmic v a r i a b l e ...44
1.12 An example of a doubled peak profile in A r p l2 0 B ...45
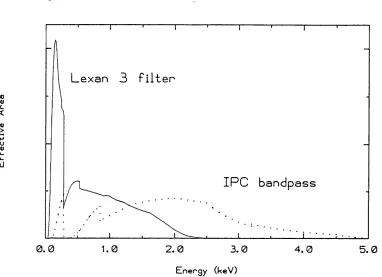
2.1 The filter responses for the E X O S A T Lexan3 filter and the Einstein IPC f i l t e r ... 50
2.2 The change in sensitivity across the E X O S A T field of v ie w ...52
2.3 A figure showing the distribution of boxes used in source searching . . . . 53
2.4 The field of TY PYX showing the 5cr d e te c tio n s... 54
2.5 The variation of the sky coverage for the 14 fields analysed as a function of assumed spectral s l o p e ... 62
2.6 The line ratio plots from Osterbrock and Veilleux (1 9 8 7 )... 65
2.7 The redshift distribution of the MSSL AGN s a m p le ...67
2.8 The optical spectra of the MSSL A G N ... 72
3.1 B-V against the optical lum inosity for th e s a m p le ... 81
3.2 fB/fX against B-I for the s a m p l e ...82
3.3 The effect of a UV bum p on the accuracy of a fitted power-law from the red 84 3.4 The correlation between fitted power-law slope and r e d s h i f t ...86
3.6 Fits to the continuum of EX O 1205+52 ... 89
3.7 A fit to the continuum of EX 02317+16 ... 90
3.8 vFv vs v for the QSO’s and the Seyfert’s ...93
3.9 uFy vs v for the Narrow line o b j e c t s ... 96
3.10 The vFv distribution for weak and strong bump QSO’s taken from Mc Dowell et al. ( 1 9 8 9 ) ... 97
3.11 The Balmer flux F ^ plotted against the optical f l u x ... 103
3.12 The fit of a two photon continuum to EX 01429+36 ... 104
3.13 The fit to the continuum of EXO0419-54 showing the fit of a tem plate galaxy s p e c t r u m ...105
3.14 The X-ray and optical continuum fluxes for both the E X O S A T sample and Stephens (1989) s a m p le ... 106
3.15 The Fu vs v distribution for the BL Lacs ...110
3.16 vF u vs v distribution for the BL Lacs ... I l l 3.17 The fit of a tem plate elliptical galaxy to the spectrum of EX00507-04 . . 112
3.18 The spectra of EX 01118+42 taken on three different days showing the variable s l o p e ... 113
4.1 H7/H/3against H a/H /?for the MSSL AGN, for the Stephens sample, for the Osterbrock sample and for the Morris and W ard s a m p le ...118
4.2 The Hccflux versus continuum flux for the MSSL A G N ... 119
4.3 The Balmer line luminosities against the optical and X-ray continuum lu m in o sities...121
4.4 The H a and H@ luminosities against optical continuum lum inosity for the Stephens s a m p l e ...122
4.5 The EW of H a and TLf3 against continuum lum inosity for the MSSL AGN and the Stephens sample ... 124
4.6 A fit to the optical spectrum of EXO 1205+52 showing all the different fitted components, including F ell em issio n ... 127
4.7 A fit to the optical spectrum of EXO 1205+52 around H/?showing the detailed fit of the F ell m u l tip l e ts ... 127
4.8 Fell fits to the spectrum of E X 0 1 3 4 6 + 2 6 B ...130
4.9 The distribution of H(3 FW HM for the MSSL AGN, the MSS d a ta from Stephens (1989) and from Osterbrock ( 1 9 7 7 ) ... 131
4.10 Ha/H/3 versus velocity for Seyferts through to QSO’s from Shuder (1984) 133 4.11 The dependence of H a/H /?against velocity for the MSSL A G N ...135
4.12 A plot of the correlation between [0 HI] A5007 and optical luminosity. . 138 4.13 The fits to the four cases where [O m ] A4363 was detected... 140
6.2 The LE CMA and ME lightcurves and the ME hardness ratio for the first
four observations of N G C 6814...149
6.3 The LE CMA and ME lightcurves and the ME hardness ratio for obser vation 5 ... 150
6.4 The rapid dip in the MS flux from observation 2 ...151
6.5 The autocorrelation function of the five ME observations...153
6.6 The ME lightcurve of observation 3 folded onto a 3,000 second period . . 155
6.7 The power spectra of the 5 ME observations of N G C 6 8 1 4 ...156
6.8 Simulations of the variability of N G C 6 8 1 4 ... 157
6.9 Fourier transforms of the simulated d a t a ... 159
6.10 The power spectrum for the fifth o b s e r v a tio n ... 160
6.11 The result of a fractal analysis of the ME light curve of observation 5 . . 161
6.12 A reconstruction of the shape of the flaxes from observation 5 ... 164
List o f Tables
2.1 The source detections in the 14 MSSL f ie ld s ...55
2.2 The sources found in the HGLS sample to d a t e ...57
2.3 The stellar id e n tific a tio n s ...60
2.4 Expected num ber of AGN against the assumed spectral s l o p e ...62
2.5 The narrow line ratios for the L L A G N ...64
2.6 The classification of the AGN in the MSSL s a m p l e ...67
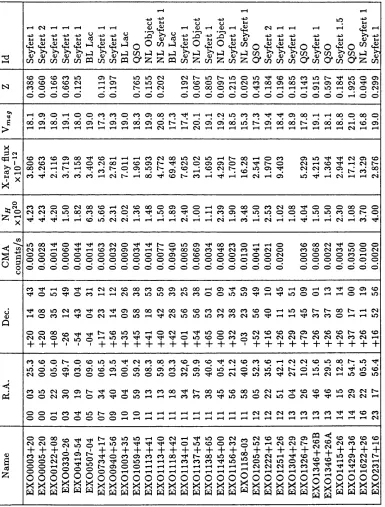
2.7 The MSSL A G N ...69
3.1 The optical and X-ray lum inosities of the MSSL A G N ... 78
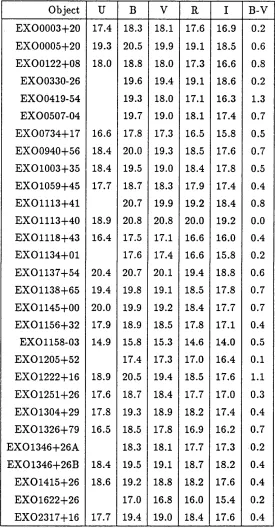
3.2 The magnitudes and B-V colour for the MSSL A G N ... 80
3.3 Power law param eters for the MSSL A G N ... 85
3.4 Balmer continuum n o rm alisatio n s...102
3.5 The a oxfor the MSSL A G N ... 108
3.6 Power-law fits to the three observations of EXO 1 1 1 8 + 4 2 ... 109
4.1 The measured line fluxes for the MSSL A G N ...116
4.2 The equivalent widths for H a and Hft... 123
4.3 Fell fluxes relative to Hft from different energy le v e ls ...128
4.4 The FWHM for Eft and M g l l ...132
4.5 [0 III](4959+5007)/4363 ratios and derived t e m p e r a t u r e s ... 139
6.1 NGC6814 fluxes observed w ith E X O S A T...146
6.2 The ACF characteristic timescales for the five E X O S A T observations of N G C 6 8 1 4 ...154
6.3 Single power-law best fits of NGC6814 spectra ...167
A .l The models available in SPECTRU M ...179
C h a p te r 1
In tro d u ctio n
Active Galactic Nuclei (AGN) are among the most luminous objects in the universe and offer a unique opportunity to study the highly energetic and extrem e behaviour th at m ust occur in them. Many different classes of AGN have been discovered ranging from extremely luminous objects, such as quasars, down to nearby galaxies th a t only show a very low level of activity. Much recent work has gone into attem p tin g to obtain an overall picture of these objects by multi-wavelength studies and, at least for some classes of objects, similarities are emerging which may suggest a ‘unified’ picture.
1.1
A b r ie f o v e r v ie w o f t h e s t r u c t u r e o f A G N
AGN are extremely complex objects w ith many different processes occurring in different regions and on different timescales. A detailed picture of the structure of the centre of an AGN is, at present, very difficult to obtain but there is some general agreement on the overall structure. At the nucleus is the so called central engine. The innermost regions produce most of the highly energetic emission; X-rays, 7-rays etc. Variability studies indicate th at the inferred size of the central engine is small ( ~ 1013 cm) and this, together w ith the high luminosity of these objects, has led people to believe th a t the central engine consists of a massive black hole ( ~ 1O7M0) onto which m atter accretes. Accretion onto the black hole is thought to occur via a disk, and these disks have been invoked to try to explain a variety of phenomena including the collimation of radio jets. Perhaps the strongest observational evidence for accretion disks comes from the observation of their therm al emission in the form of the so called ‘blue bum p’ (ie. Malkan and Saxgent 1982).
It is not clear where the different continuum processes occur, and w hat connections exist between them. As an example, there is little evidence for a direct connection between the X-ray and optical emission in NGC4051 on short timescales (Done et al.
NLR NLR
O
, ,JetO
o
° °
X-ray »/UV b u m p \ IO m
Q
°
O
o
^
. 1
^
0
o
® / I \ \ Accretion disk r Q
1021 1017 1016101310131016 1017 1021
Distance scale (cm)
Figure 1.1: A Simplified picture of the center of an AGN
thought to arise from incoherent synchrotron emission and (in the case of radio jets) can extend for hundreds of kpc. The exact mechanism for collim ating these jets is poorly understood,but they could be collimated by the inner p art of an accretion disk.
Surrounding the ‘central power-house’ are the so called Broad and Narrow Line regions (the BLR and NLR) which are believed to consist of clouds or filaments of gas which are photoionised by the continuum radiation from the central regions. From the variability characteristics of the optical/U V lines it is clear th a t the BLR lies closer to the center than the NLR. The narrow line emission alm ost certainly originates from photoionised or shocked gas clouds but the origin of the BLR emission is a m atter of some controversy. The lines could be em itted from gas clouds similar to those responsible for the line emission from the NLR, or from the photospheres of stars bloated by incident X-rays (eg. Penston 1988). A nother more controversial possibility is th a t they could arise from an accretion disk (Dum ont and Collin-Souffrin et al. 1990).
1 .2
T h e d iffe r e n t c la s s e s o f A G N
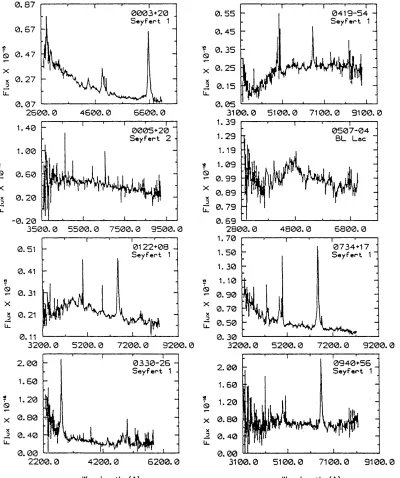
Active Galaxies have been classified into a num ber of different types of objects. Figure 1.2 shows some of the different sorts of objects found in the E X O S A T High. Galactic Latitude Survey (see chapters 2,3,4)- Detailed below are five possible ‘classes’ and often each class can be subdivided into smaller sub-classes. In some instances the classification seems to be a little arbitrary and it is likely th a t overlaps exist.
1. Narrow Emission Line Galaxies (NELG): These are very low luminosity ob jects (L(H a) < 1041 ergs s-1 Filippenko 1989) where only narrow lines axe observed and any non-therm al continuum is usually swamped by starlight. There can be some confusion between those objects where the line emission is dominated by photoionization by stars and ‘active’ objects; line ratio plots are often used to distinguish between them (Veilleux and O sterbrock 1987). The active NELG’s can be classified in a number of different ways, the two most common being low-luminosity Seyfert 2’s (ie. Phillips, Charles and Baldwin 1983) and Low Ionization Nuclear Emission Region objects (the so called LINER’s (Heckman 1980)). These low lum inosity AGN (LLAGN) seem to be relatively common. Heckman (1980) found th a t up to a third of nearby galaxies showed some evidence for activity, and other workers (eg. Keel 1983) have shown th at 50 - 80% of early type spirals and ellipticals have LINER like activity.
2. Seyfert l ’s: Seyfert l ’s axe the ‘original’ Active Galaxies, first discovered by Seyfert in 1943 (Seyfert 1943). They have strong perm itted lines which are generally broad (of order 1000-5000 km s-1 ) and have [O III]A5007/H/3A4861 ~
1. Seyfert l ’s can be subdivided into Seyfert l ’s, Seyfert 1.5’s - Seyfert 1.9’s and Narrow Line Seyfert l ’s. The essential difference between the different classes is in the line profiles of the perm itted lines. The broad component of the line decreases in im portance in going from a Seyfert 1 to a Seyfert 1.9. Seyfert l ’s generally have large covering factors ie. the volume taken up by the BLR clouds is laxge (eg. f c ~ 1 in NGC4151 (Pounds et al. 1986)) and in general the host galaxy can be seen. This host galaxy is often a spiral (eg. Adams 1977).
BL Lac 0 .1 1 7
0 . 0 9 7
U_ 0 . 0 7 7
---3 1 0 0 . 0 4 1 0 0 . 0 5 1 0 0 . 0 6 1 0 0 . 0 7 1 0 0 . 0 0 . 8 7
QSO 0 . 6 7
S> 0 . 4 7 0 . 2 7 li_ 0 . 0 7
2 6 0 0 . 0 3 6 0 0 . 0 4 6 0 0 . 0 5 6 0 0 . 0 6 6 0 0 . 0 7 6 0 0 . 0 0 . 5 6
S e y f e r t 1 0 . 4 6
<9 0 . 3 6 0 . 2 6
16
---3 5 0 0 . 0 4 5 0 0 . 0 5 5 0 0 . 0 6 5 0 0 . 0 7 5 0 0 . 0 8 5 0 0 . 0
0 . 5 9 S e y f e r t 2 0 . 4 9
0 . 3 9 0 . 2 9
-| g ---1--- 1---1--- 1______ i______ I______ i_____ ’I i ■______
3 9 0 0 . 0 4 9 0 0 . 0 5 9 0 0 . 0 6 9 0 0 . 0 7 9 0 0 . 0 8 9 0 0 . 0
2 . 1 0 - LLAGN (HII lik e /L I N E R )-1 . 7 0
10
-
-® 1. 3 0
i :
X 0 . 9 0
X
D
C 0 . 5 0
4 5 0 0 . 0 5 5 0 0 . 0 6 5 0 0 . 0 7 5 0 0 . 0 8 5 0 0 . 0 Wavelength (A)
1983) by Osterbrock and Shaw (1988) the ratio of Seyfert 2’s to Seyfert l ’s was found to be approxim ately 4:1.
4. QSO’s: Quasars are generally split into two types, radio loud (Q SR’s) and radio quiet (QSO’s). They are very similar to Seyfert l ’s, though generally brighter (ie. logio(L 0pt) > 40.6 (Stephens 1989)). Studies of line and con tinuum correlations of b o th Seyfert l ’s and QSO’s indicates a continuity in properties between the two classes. However, in QSO’s th e covering factor is generally much smaller ( / c ~ 10- 3 ) and the underlying galaxy is less promi nent. Imaging studies of th e host galaxies of QSO’s (ie. Sm ith et al. 1986) indicate th a t many quasars reside in galaxies with disturbed morphologies ie. ones th a t may have recently undergone a collision or merger. There may also be a general tendency for radio loud quasars to reside in ellipticals, and radio quiet objects to reside in spirals (Smith et al. 1986).
5. BL Lac’s: BL Lac’s are highly luminous AGN whose spectra are dominated by the continuum and which show no evidence for line emission. They are characterised by strong radio emission and are highly polarized. They also tend to be highly variable even down to a timescale of hours (ie. Pica et al.
1980a). It is thought th a t the difference between ordinary AGN and BL Lac’s is just due to an orientation effect such th a t in BL Lac’s our line of sight is directly down a jet. Elliptical galaxies are generally thought to be the host galaxies of BL Lacs (eg. Perez-Fournon and Biermann 1984).
As can be seen, there is likely to be much overlap in the properties between different AGN, and indeed this is why m any people are trying to unify all Active Galaxies into one reasonably simple model.
1.3
T h e c e n tr a l e n g in e
W hat is thought to lie at the centre of AGN? The processes occurring there involve the release of large amounts of energy (1042 — 1046 ergs s- 1 ) in a small region (< 1017cm). Such energies place severe constraints on any possible emission mechanism.
Three possible explanations have been suggested:
1. Dense Star Clusters
2. Massive Stars, ‘spinars’ or ‘m agnetoids’ 3. Accretion onto massive black holes
1 .3 .1 D e n s e S ta r C lu s te r s
A dense star cluster can produce energy via supernova explosions (Colgate, Colvin and Petschek 1975). If the stellar density is high enough, stellar coalescence m ay produce a large population of ~ 100 Mq stars and nearby supernovae can trigger instabilities in neighbouring stars. Ten supernova events in one year are enough to release ~ 1052 —
1053 ergs into th e surrounding medium, mainly as 7-rays and highly energetic particles. Under this scenario the BLR could then be produced by cooled ejecta th a t escaped from the cluster. Such a scenario implies th a t the AGN would undergo repeated flaring on the timescale of about one m onth. However, there is increasing evidence of variability timescales much shorter than this, w ith flaring on a timescale of days to hours (eg. NGC4151 Lawrence 1980, NGC6814 M ittaz and Branduardi-Raym ont 1989) as well as fast X-ray variability (eg. NGC4051 Lawrence et al. 1987). Such variability is difficult to reconcile w ith the SNR model.
1 .3 .2 ‘S p in a r s ’ or ‘m a g n e t o id s ’
Gravity powered models have concentrated on making the fast particles and m agnetic fields needed to promote synchrotron emission. In these collapsing m agnetoid and spinar models (see Cavalier, Morrison and Wood (1971) and Pacini and Salvati (1978)) a large ro tating body loses angular m om entum to the surrounding gas via the interaction of a magnetic field with the surrounding m aterial. This can produce optical and radio emission via the synchrotron process and X-rays by inverse compton scattering. Unlike the SNR model, rapid variability can be produced since the differential ro tatio n of the body would generate a strong toroidal field which would give rise to violent hydrodynam ic explosions or to flaring events similar to those seen on the sun.
If the large body itself is centrifugally supported then the rotation period will become progressively smaller as it shrinks following angular mom entum losses. Therefore, a hallm ark of this model is a shortening period accompanied by the brightness increasing leading to a crescendo. After th a t the spinar collapses into a black hole. However, such a scenario seems at odds with observations. Since nearby objects (ie. Seyferts) are less luminous th an the brighter, younger objects (the quasars), such a model would imply th a t the Seyferts are powered by some other mechanism, such as accretion onto the black hole formed at the end of the^spinar’s lifetime. Since there are m arked similarities between the emission in Seyferts and quasars it seems unlikely th a t two such divergent continuum models could explain the continuity between the two classes.
1 .3 .3 M a ss iv e b la ck h o le s
rotating black bole is 5.7%. However most stars rotate, so any black bole formed by the collapse of a star is likely to have significant angular m om entum . Also, unless the accretion process is strictly spherical (ie. no angular m om entum in the accreting gas) the black hole will gain angular m om entum through the accretion process. Therefore a K err black hole is more likely than a non-rotating one. Under this scenario the maximum efficiency of conversion is 42%. It is unlikely th a t this maximum efficiency would ever be achieved due to some swallowing of the radiation but efficiencies of up to 1/3 are thought to be possible.
There are a num ber of reasons why a black hole model (or at least a single central mass) is to be preferred. Perhaps the most direct evidence comes from the observation of rapid X-ray variability (~ 1000s) in some Seyferts. Such variability severely limits the volume from which the emission m ust be coming from (ie. Terrel 1967). Further, observations of radio galaxies have indicated th a t the central engine has m aintained a preferred axis for millions of years (ie. Pauliny-Toth 1981). This would be difficult to m aintain for a cluster of stars. C entral light cusps (Sargent et al. 1978), superluminal expansion (eg. Cohen and Unwin 1984) and observations of the G alactic Center (eg. Lo and Claussen 1983) provide further indirect evidence for spinning, relativistically deep potential wells.
W hat supplies the m aterial for accretion? The luminosity can be w ritten in terms of the accretion rate M and the mass M as
L = ^ w r (L 1 )
where R s is the Schwartzchild radius R s = This can be rew ritten in terms of the accretion rate to give
M ~ O.377 M Qyr 1 (1.2)
Xl O^ergs/ s,
If the efficiency of conversion 77 is of the order of 0.1 then for a lum inosity of between
1042 — 1046 ergs s-1 the accretion ra te m ust be of the order of 10“ 3 — 1 M© y r- 1 . Such an accretion rate can easily be obtained from mass loss from stars. The num ber of stars in a typical galaxy is of the order of 1011 and the average mass loss ra te is of the order of 10-11 M© y r-1 for a star of 1 M©. Unless such m aterial is forced out of the galaxy by some inter-galactic wind, it will g rav itate to the center and will be able to fuel the active nucleus. A further possibility is th a t stars themselves can be disrupted and either fall into the central regions or, in the case of massive stars, have their extensive atmospheres ripped off.
al. (1984) claimed th a t in their sample of 78 objects one th ird of QSO’s appeared to be interacting. Such interactions or mergers would provide a n atu ral source of fuel for the central engine.
1 .4
T h e c o n tin u u m e m is s io n fr o m A G N
In general the emission from AGN can be split into two components. Continuum emis sion, which provides the driving force behind the other processes, and line emission. The continuum emission in many AGN is quite complex and probably arises in m any different regions and under different conditions. Due to the complicated nature of the continuum emission, it is easiest to look at each class of AGN in turn.
1 .4 .1 N a r r o w E m is sio n L in e O b je c ts
As mentioned above, these are low-luminosity objects w ith weak line emission and where any continuum emission is likely to be swamped by starlight. There are as yet few studies of these objects in the UV (where the contribution of starlight is much weaker), and in those objects which have been looked at in the UV the evidence for a non-therm al continuum is weak (eg. NGC7469 Puchnarewicz, private com munication). In general line ratios are used to try and determine the origin of the continuum . There are three different mechanisms for exciting line emission in these objects.
1. Starlight: The line emission could arise in giant HII regions (eg. French 1980). In this case, the excitation mechanism is starlight from hot O or B stars photoionising the surrounding gas. Such galaxies are not ‘active’ in the accepted sense of the word. They can, however, be discriminated against by studying line ratio plots (eg. Veilleux and O sterbrock 1987). The prim ary difference between non-therm al and starlight excitation is th a t in a non-therm al continuum a significant fraction of the energy is em itted by X- rays, whereas for an HII region the ionization is due to UV photons from hot OB stars (Osterbrock 1974). Since the absorption cross section of H°, He0, He+ and all other ions decrease rapidly w ith increasing energy, any keV X-rays can penetrate deeply into the predom inantly neutral region th a t lies behind the region ionised by the UV photons, and create a partially ionised zone. Electrons em itted by X-ray photoionization and Auger processes can effect line strengths by collisional excitation. It is in such a region th a t im portant discriminatory lines axe em itted, such as [0 I] A 6300, [S II] XX 6716, 6731 and [N II] A 6583. These lines can be used to discrim inate between HII regions and emission excited by non-therm al processes, since a partially ionised region does not exist in classical HII regions (O sterbrock 1974).
power-law which may arise from Synchrotron emission. As shown above, it is possible to distinguish HII region like objects from those w ith a non-therm al excitation source. However, there is little direct evidence for a power-law in the spectra of NELG’s.
3. Shocks: The shocking of a gas also leads to line emission. Again, it should be possible to distinguish between photoionization by a non-therm al contin uum and shocks from line ratios, since shocked m aterial will be dominated by collisional ionization. Contini and Aldrovandi (1983) use a model which included both photoionization and shock models, and concluded th a t shock models best describe LINER like activity.
There is still a lot of controversy about the power source for m any N ELG ’s. For the Seyfert 2 like objects studied by Phillips, Charles and Baldwin (1983), the obvious candidate for photoionization is by a non-therm al power-law. For other objects differ ent mechanisms may play a role. As an example the power source for LINERS is still poorly understood. From line ratio studies it is clear th a t LINERs are not HII regions like objects (Veilleux and O sterbrock 1987) but the optical line ratios of LINERs can be consistent with both photoionization and shock models. However, the lack of UV observations of any UV non-therm al continuum adds strength to the shock model inter pretation. Other possible mechanisms are th a t the line emission m ay arise from a cooling flow, which as well as em itting the observed X-ray emission (H alpern and Steiner 1983), can explain the optical emission (Fabian et al. 1986a). Gas could also have been shocked by galaxy mergers or interactions, and not from any ‘activity’ at all (eg. Fosbury and Wall 1979). Therefore for this class of low luminosity AGN, the situation is far from clear.
1 .4 .2 S e y fe r t 2 ’s
Seyfert 2’s are at higher luminosities th an the NELG’s (ie. L (H a) > 1041 ergs s- 1 ). They are characterised by having strong forbidden lines (H /?/[0 IIIJA5007 < 3) where the line widths of b oth forbidden and perm itted lines axe narrow (of the order of a few hundred km s-1 ). The optical continuum of Seyfert 2’s can be represented as star light diluted by an underlying continuous continuum (Koski 1978), and is mostly unpolarised. Line ratios indicate th a t the lines seen from Seyfert 2’s are similar to those observed from the narrow line region in Seyfert l ’s which may im ply a sim ilarity between the two classes. Theoretical work on the line emission from the narrow line region of AGN show th a t Seyfert 2 galaxies are consistent w ith a radiatively dom inated scenario, w ith shocks being relatively unim portant (eg. Contini and Aldrovandi 1983). Therefore the ionising continuum is likely to be a non-therm al power-law of the sort seen in Seyfert l ’s and QSO’s.
Further strong evidence for a connection between Seyfert l ’s and Seyfert 2’s is the recent work on their polarisation properties (Antonucci and Miller 1985). Antonucci and Miller showed th a t when certain Seyfert 2’s were observed in polarized light broad emission lines could be seen (ie. NGC1068 see figure 1.3). This may imply th a t the BLR is shielded from our direct line of sight, but can be seen in light scattered off obscuring m aterial, probably in the shape of a torus. Further evidence th a t the nucleus of NGC1068 contains a Seyfert 1 like nucleus comes from E X O S A T observations where a medium energy X-ray slope of —0.68 was found, this value being very close to the canonical value of —0.7 for Seyferts (Elvis and Lawrence 1988). Interestingly, soft (0.02 - 2.5 keV) X-ray emission was also observed, which at first sight would appear to contradict the obscuring torus scenario. Elvis and Lawrence interpret these X-rays as arising from a photoionised electron scattering region lying within the dust torus. Krolik and Kallman (1987) showed th a t such an electron scattering region would produce large amounts of Fe K a by fluoresence.. The large equivalent width of Fe K a observed by Ginga therefore supports this model (Koyama 1989).
Other evidence also exists for torii in Seyfert 2 galaxies. Imaging studies of NGC5252 have shown a conical structure in [O III] emission w ith a central band perpendicular to these cones. This central band of absorption has been interpreted as a torus collimating
the emission cones, and such a torus could be identified w ith th a t necessary to obscure the BLR (Tadhunter and Tsvetanov 1989). All of this evidence strongly suggests th a t at least some Seyfert 2’s contain obscured Seyfert 1 nuclei.
1 .4 .3 S e y fe r t l ’s a n d Q S O ’s
con-40
30
20
10
0
.4
.3
.2
.1
0
Figure 1.3: The to tal flux and the polarized flux for NGC1068 showing th e broad lines seen in polarized light (Miller 1989).
NGC 1068 nucleus total flux
polarized flux
5000 5500 6000
4500 4000
timium in a Seyfert galaxy.
1.4.3.1 T h e m ed iu m en ergy X -ra y em issio n
The X-ray emission observed in AGN m ust come from a region very close to the black hole, since variability studies indicate a very small em itting region. It is found th a t the medium energy X-ray spectrum (2 - 10 keV) of individual AGN is adequately described by a single power-law with a mean index of ~ —0.7 (Turner and Pounds 1989). Such a power-law provides im portant constraints on the hard X-ray emission mechanisms since the spread of value is small (a ~ 0.17 Turner and Pounds 1989). There are a number of different mechanisms for providing such a spectrum:
1. Synchrotron self-Compton models. Here synchrotron photons are upscattered to X-ray energies by relativistic electrons which are p art of the electron pop ulation em itting the synchrotron radiation. As noted by Turner and Pounds (1989) to get a power-law spectrum with a slope of ~ —0.7 the relativistic elec trons must have a power-law distribution of the form iV7 = 7-2,4. However, for such a distribution the cooling tim e of these electrons (ie the time it takes the electrons to lose a significant am ount of their energy) is shorter than the escape time (~ R fc where R is the radius of the em itting sphere). Therefore the distribution of electrons will cool and so steepen the X-ray slope. This would therefore require a continuous re-acceleration or continuous injection of the electrons.
2. Compton cooling of therm al electrons. This was studied for a two tem perature disk model by Shapiro, Lightman and Eardley (1976) where soft photons are Compton upscattered by therm al electrons from the disk. Their work suggested th at the typical slope would be ~ —1, steeper th an observed. 3. Optically thin therm al brem sstrahlung. Given a high enough tem perature
(>25keV) the spectrum can look power-law-like in the range 2-10 keV. How ever, this process has a low efficiency and would therefore require a larger volume than th at indicated by variability studies.
4. Electron-positron pair production. The standard model (ie. Done and Fabian 1989) assumes th at mono-energetic particles of ~ GeV energy are continuously injected into the source. Soft photons (such as those arising from the inner regions of an accretion disk) are up-scattered by the injected particles via inverse comptonisation forming a high energy spectrum which extends to 7
ray energies. The overall spectrum produced by the injected prim ary particles is a power-law of slope a = —0.5. By interacting w ith photons of lower energies, 7-rays produce electron-positron pairs which also scatter photons to X-ray energies. The equilibrium overall spectrum is steepened to the observed
>s —>
£
Ll^
?
100/i Synchrotron self absorption ' 0.15keV 1 keV 3
Synchrotron Power-law
Blackbody of kT=0.0166 keV 2
\ Blackbody Accretion Disc
Balmer con tinuum /F ell
0
Effect of Absorption by
NH= 2 .9 x 1020 cm -2 2
3
X-ray Power-law
12 13 U 15 16 17 18 19
l og v (Hz)
contribute to the emission m ainly at lower (X-ray) frequencies. The exact effect of the pairs depends on the compactness of the source ie.
' = { 1 - 3 )
where L is the luminosity of the source, R is the size of the em itting region and ctt is the Thomson cross-section. The more compact the source, the more im portant the pair production process. There are, however, a num ber of problems with this scenario. Lightman and Zdiarski (1987) and Done and Fabian (1989) concluded th a t to reproduce the observed X-ray slope of a ~ —0.7 required a compactness of ~ 30. However, this produces too m any 7-rays to be consistent with the 7-ray background. An attem p t at re-accelerating and re-injecting the electrons cooled by up-scattering the soft X-ray photons reduced the number of high energy 7 rays, but could not steepen the slope from a = —0.5. Therefore, pairs may not be im portant in determ ining the shape of the 2-10keV spectrum . Pairs may still be im p ortan t in some objects, for example NGC6814 M ittaz and Branduardi-Raym ont (1989).
Higher resolution observations are now indicating th a t the observed medium energy X-ray spectrum is likely to be more complex th an a simple power-law. Ginga observations of AGN are starting to show the presence of cold m atter near the center of the AGN, both from the variability of soft X-rays and from the observation of Fe lines and edges in the X-ray spectra (ie. Pounds 1989). Further, Pounds (1989) summed the spectra of seven AGN and found th at the shape of the spectrum was significantly different from a power-law. A good fit to the d a ta was made by including the effects of reflection or scattering off cold m aterial near the center. Such m aterial is consistent with th a t expected from an accretion disk.
1 .4 .3.2 T h e R a d io - o p tic a l c o n tin u u m
6
4
O z:
2
0
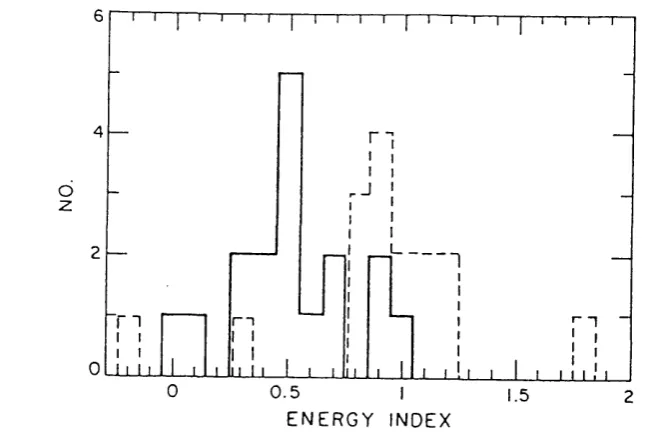
Figure 1.5: The distribution of slopes from the Wilkes and Elvis (1987) sample, showing the radio loud (solid line) and radio quiet (dashed line) quasars.
shown th a t radio loud quasars are relatively more luminous in X-rays th a n radio quiet quasars. Wilkes and Elvis (1987) have interpreted this as being due to a multicomponent X-ray spectrum with different slopes a = —0.5 and a = — 1. In radio loud objects, the
a = —0.5 component dominates, whereas in radio quiet objects th e a = — 1 component dominates (see Figure 1.5). The flatter component could be due to synchrotron self- compton emission. Worral et al. have also shown a connection between radio spectral properties and X-ray emission in th a t flat spectra radio sources have a higher X-ray luminosity than steep spectrum sources. This all probably implies a connection between the radio and X-ray emission.
The relation between the IR and the X-ray emission has been studied by Elvis et al. (1989). In an earlier paper (Elvis et al. 1986) eight PG quasars were found to have IR slopes consistent with the X-ray d a ta in th a t an extrapolation of the IR power-law gave good agreement with the observed X-ray flux. The situation now is slightly less clear in th a t other IR studies have shown th a t a single power-law is probably not a good description of the IR continuum, and there are likely to be m any other components to the IR emission, such as dust and starlight (Carleton et al. 1987, W ard et al. 1987 and Edelson and Malkan 1986). F urther evidence against such a sim plistic single power- law model comes from the optical d a ta where polarisation studies have shown little evidence for a non-thermal (ie. synchrotron) continuum. Some polarisation has been detected in NGC4151 (Schmidt and Miller 1980) but in general there is no direct evidence from polarim etry of a strong non-therm al source in the optical (Schm idt and Miller
1985). This m ay imply a tangled m agnetic field in the emission region, or substantial reprocessing.
T h at there should be some connection between the emission at different wavelengths seems reasonable. After all, the continuum flux is a consequence of the emission from the central engine. However, it is likely th a t significant reprocessing occurs. Done et al.
(1990) observed NGC4051 simultaneously in the IR, optical and X-ray bands to search for correlated variability, which would be expected if the IR-X-ray emission arose at the same location. However, no such correlated variability was seen therefore implying th a t the op tical/IR emission arises in a different region th an the X-ray emission.
1 .4 .4 T h e r m a l e m is sio n - th e b lu e b u m p
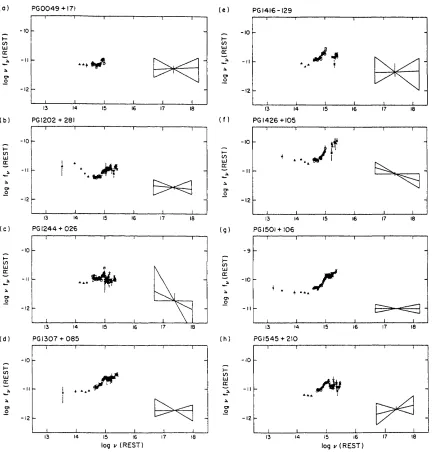
The feature th a t dominates the energetics of m any AGN is emission from a therm al component seen in the UV/EUV - the so called UV or blue bump. Broad band m ea surements indicate th a t there is progressively less variability going from the blue (U band) to the red (K band) which suggests a second blue component (C utri et al. 1985). Mushotzky and Wandel (1989) found th a t the flux at 7500A is more strongly correlated w ith the X-ray d ata for a sample of QSO’s than the flux at 4200A. This they interpreted as implying a separate component in the blue causing the reduced correlation. This second component can be identified with the blue bump, first observed as a flattening of the IR power-law at optical wavelengths and discussed by Shields (1978) for the quasar 3C273. He interpreted the optical excess as therm al radiation from an accretion disk of effective tem perature 104 — 105K but his d ata only covered a small wavelength range so detailed fits to the excess were not possible. This was remedied by the work of Malkan and Sargent (1982), where high quality d ata spanning 2.5 decades of frequency were fitted with a variety of models including power-law, black body emission,Balmer contin uum emission and line emission. They found th a t the IR and X -ray d a ta could be joined relatively smoothly with a power-law of index —1.0 to —1.2 bu t th a t a ‘blue excess’ started to appear around 1 - 2 /zm. A t this stage only single black-bodies were fitted with tem peratures ranging from 20,000 — 3 0 ,000K. Further work by Malkan for high redshift (z~ 2) quasars showed th a t a single tem perature approxim ation was not really good enough and the d ata were more consistent w ith a range of tem peratures (Malkan 1983). This is precisely the behaviour which would be expected if the emission was due to an accretion disk. Figure 1.6 presents multiwavelength spectra of a sample of PG quasars clearly showing the blue bump rising from ~ 1 fi (Elvis et al. 1986). However, not all AGN show strong UV bumps. A recent study of PG quasars has shown th a t several have weak blue bumps (McDowell et al. 1989, Figure 1.7), and there is even evidence th a t one object (PHL 909) may show the high energy ta il of an accretion disk (see as an excess of soft X-ray photons over a medium energy power-law) but a weak UV bump. The exact meaning of this is not yet understood.
(0) P G 0 0 4 9 +171 PG 1416 -129
-10
-12
13 >4 15 16 17 18
( b)
( d)
PGI202 + 281
( c )
13 14
PG 1 2 4 4 + 0 2 6
PG I30 7 + 0 8 5 -10 \-CO U J CE 15
13 14 16 17 18
-10 I-to UJ IE 4 o> o
- 1 2
13 14 15 16 17 18
-10 I— CO UJ <E O' o -12
13 14 15 16 17
( f )
(g)
( h )
PG14 2 6 + 1 0 5
PGI50I+ 106
PG I54 5 + 210 -10 to UJ CE & o> o
- 1 2
15 17 18
13 14 16
t— CO UJ CE -10 17 15 13 16 -10 O' o
- 1 2
17
15 16
13 14
log v (REST) log v (REST)
1 keV 1000 A
10 M
46 45 44 47 46 45
<afl
O 46
45 44
46 45 44
12 14 16 18
log(u) (Hz)
Figure 1.7: Some weak bump quasars from McDowell et al. (1989).
in the soft X-ray region (0.02 - 2.5 keV). Observations by the E X O S A T satellite have shown the presence of a soft X-ray excess lying above the medium energy power-law. In a survey of nearby bright AGN, Turner and Pounds (1989) found th a t up to 50% of AGN may exhibit such excesses. Objects such as Mkn 841 (Arnaud et al. 1985) and Mkn 335 (Turner and Pounds 1988) show correlated variability at medium and soft X-ray energies which indicates th a t the soft X-rays originate from the central regions. In these cases it is usual to ascribe the excess to the high energy tail from the optically thick emission of an accretion disk. Such disks provide a plausible explanation for b o th the UV bump and the soft X-ray excess, w ith the UV emission coming from the cooler outer regions and the soft X-ray emission from close to the centre (ie. the model of Czerny and Elvis (1987)). This view is supported from the variability studies, w ith the UV bump being ~ constant and the soft excess varying. Pounds et al. (1987) have fitted the soft X-ray excess of Mkn335 with accretion disk models and find good agreement with the observations. They infer a black hole mass of < 107M®. However, in some objects the soft X-ray excess may not be due to an accretion disk at all. Hot intercloud gas can also provide soft X -ray emission. The best example of this is NGC4151, where a constant soft excess was interpreted as emission from a hot inter-cloud medium (Holt et al. 1980, Pounds et al. 1986, Perola et al. 1986). Einstein observations have shown extended soft X-ray emission which would be consistent w ith emission from th e ICM (Elvis et al.
1983).
served EUV. Most line intensities are determined by the ionization param eter U =
Q(H)/4:Trr2cN e (where Q (E ) is the number of ionising photons) and are only weakly
dependent on the shape of the continuum. However, since the opacity of a gas is a strong function of photon energy, different lines will be sensitive in different ways to the shape of the ionising continuum. Binette et al. (1988) showed th a t the (narrow) HeIIA4686/H/? line ratio implied th a t the flux at lOOeV was significantly less than th a t at 912A(13.6 eV) in most objects they studied. O ther studies have looked at broad line ratios, but unfortunately, most line strengths are dominated more by the physical con ditions under which they are em itted than the shape of the continuum . The problem is further confused by the possibility of having multi-component models, w ith different line species being em itted in different regions w ith different physical param eters. In a study of the effects of an accretion disk spectrum on theoretical models, Krolik and Kallman (1987) showed th a t overall line ratios were marginally consistent w ith a 10 eV bump (ie. a simplistic disk spectrum with kTfe=10 eV) but other continua only gave marginally worse fits. The only useful pair of line ratios found by Krolik and K allm an (1987) to distinguish between strengths of bumps is O VIA1034/C IV A1549 and FeII(opt)/Lyo:. However, 0 IV A1034 is blended with Ly/3, and the strength of the F ell(opt) lines is notoriously hard to estim ate due to the blending of many m ultiplets.
An interesting development on this issue are the observations of the spectrum of the quasar HS1700-1-6416 (Reimers et al. 1989). Because of its high redshift (z=2.72), HS1700+6416 has been observed down to 330A(rest frame). U nfortunately it is difficult to interpret the d a ta below the Lyman limit (A < 912A) due to the effects of absorption along the line of sight (ie. from the Lyman forest). Reimers et al. attem p ted to remove the effect of the absorbers and they found th a t the spectrum could be fitted w ith a single power-law of slope = —0.55 from the UV into the EUV (see Figure 1.8). As they point out, if H17004-6416 is similar to other quasars then the spectrum m ust break to be consistent w ith the X-ray data. From their spectrum of H1700+6416 this break m ust occur below 300A. A similar study by Clavel and Santos-Lleos (1990) of the Seyfert 1 Fairall-9 showed th a t in F-9 the break point m ust lie above 912A. They interpreted the difference between the objects as due to quasars (ie. H1700+6416) having hotter disks than Seyferts.
1 .4 .5 O t h e r c o n t in u u m c o m p o n e n t s
HS 1 7 0 0 + 6 4 1 6
4
3
2
1
0
1800 1 6 0 0
1 4 0 0 1200
1000
8 0 0 6 0 0
4 0 0
R e s t W a v e le n g t h (A.)
emission has been studied by a num ber of authors (ie. Edelson and M alkan 1986, W ard
et al. 1987, Carleton et al. 1987, M cAlary and Reike 1988). The exact deconvolution of
these components depends on some assumptions regarding the underlying emission from the central engine. In particular the derived slope for the non-therm al power-law can differ strongly depending on w hether dust is assumed to strongly affect the continuum. Carleton et al. 1987 showed th a t a single continuum shape modified by the effect of dust could explain all the observations. Indeed, W ard et al. (1987) and Carleton et al.
(1987) have classified AGN into three categories - relatively dust free which show the nuclear continuum, reddened objects which show the effect of dust, and those objects dominated by starlight.
A further component often seen in AGN is a small bump which starts to rise into the blue at about 4000A. Current theory assumes this to be made up of both Balmer continuum, and F ell blends (Wills, Netzer and Wills 1985). The Balm er continuum arises from electrons th a t are captured and fall directly to the n = 2 level of hydrogen. As such it can only exist below 3646A but here it can make up a significant fraction of the flux (see chapter 3).
1 .4 .6 Q la z a r s
BL Lac objects, optically violently variable objects (OVV’s) and highly polarized quasars (HPQs) are often grouped together under the denomination of blazars. Such a classifi cation concentrates on the variability and polarisation properties of these objects. The distinguishing feature between BL Lacs and other blazars is th a t BL Lacs generally show no evidence of optical emission lines while O W ’s and HPQs do.
The continuum distribution of Blazars has been studied by m any people over many decades of frequency. The broad band radio-through-X-ray spectra of Blazars are smooth and generally convex with the emission flat in the radio steepening down to the UV/X- ray region. Unlike the situation found for other AGN there is no evidence for a UV bump. However, the exception to this may be 3C446 where some evidence was found for a blue bump when the source was weak (Bregman et al. 1988). The X-ray spectra of these objects, and in particular those of the BL Lacs, are quite complex. In some objects there is evidence of a steep soft X -ray spectrum with a flat high energy tail (eg. Urry 1986). Such high energy tails have been ascribed to synchrotron-self-Compton emission. However, Barr et al. (1989) showed th a t for objects taken from the EXOSAT database, BL Lac spectra can be represented by a broken power-law w ith the spectrum steepening at higher energies.
are not uncommon. Even faster variability has been seen in several objects where half m agnitude changes on a timescale of hours have occurred (eg. P ica et al. 1980a). In one case the timescale was even shorter when OJ287 varied in the J band by a factor of ~ 2 in 50 seconds (W olstencroft et al. 1982). As would be expected, the fastest variability is observed in X-rays. Most BL Lacs th a t have been m onitored vary by a factor of 2 on timescales shorter than 1 year and m any also vary on timescales of a few hours to days. The very rapid variability sometimes seen is difficult to explain w ithout invoking relativistic bulk motion in these objects which lends support to the theory th a t the continuum emission could arise in relativistic jets.
There has also been a suggestion of periodicity in some BL Lacs. Several optical and radio periods have been reported for OJ287, all of the order of 20 minutes (ie. Carrasco
et al. 1985). Much longer periods P £5 years have been reported in the light curve of
3C446 (Barbieri et al. 1985). Such periodicities are probably easiest explained in the context of an accretion disk rather than in a relativistic jet. However, the absence of any strong therm al emission from an accretion disk, similar to th a t seen in quasars remains a mystery.
The simplest jet model involves Synchrotron Self Compton emission (SSC), where a relativistic electron population radiates synchrotron photons and the same population of electrons Compton scatters the synchrotron photons to higher energies. The basic model comprises a stationary volume filled with a uniform density of relativistic particles radiating isotropically. If the particle distribution is a power-law in energy n ( E) oc E ~ p
then the em itted flux will be a power-law in energy Fu oc z/- ^ - 1 ) / 2 w ith a steepening
above a so-called break frequency z/& due to energy dependent losses. The simplest assumption for the emission is th a t of optically thin synchrotron emission. However, the very flat radio through IR spectrum observed is more likely to be due to opacity effects than to an intrinsically flat electron distribution with a low self-absorption frequency. W ith the superposition of different radio components, each w ith its own optically thin synchrotron slope and a different turnover frequency, a flat spectrum can be obtained. This model is supported by the finding th a t when multifrequency VLBI maps of spatially resolved flat spectrum sources axe made, they reveal a num ber of separate clumps each with different synchrotron characteristics. The next stage is to generalize this into a continuous inhomogeneous SSC model ie. a simple jet model. Such models seem to be able to represent the overall characteristics of Blazars quite well.
our line of sight, but a radio survey would be.
One final point needs to be addressed. There axe strong sim ilarities between the continuum emission of the OVV’s and the continuum of the BL Lacs (ie. M araschi et al.
1986). However, O W ’s show emission lines whereas the BL Lacs do not. There are two possible explanations of this. The BL Lacs could be preferentially orientated towards our line of sight so we are looking down a jet, and the boosted jet emission would then dominate other spectral features such as the lines. The alternative view is th a t the BL Lacs do not have any line em itting gas around them. G uilbert, Fabian and M cCray (1983) showed th a t because of the steeper X-ray spectra found in BL Lacs compared to other AGN, a broad line region would not be expected to form. This view may be supported by the work of M araschi et al. (1986), where the continuum of OVV’s and BL Lacs were shown to be of the same strength. If the lack of line emission was due to our preferential line of sight down a je t, then we would expect the continuum emission in BL Lacs to be far brighter th an th a t for a corresponding OVV.
1.5
T h e e m is s io n lin e s
Over the years, a very large am ount of work has been devoted to the study of emission lines in AGN. Observationally, the emission lines show a large range of ionization states, line widths and line fluxes. Quasars and Seyfert I galaxies show very broad perm itted lines, with velocity widths typically of about 5000 km s-1 (FW H M ), and narrower forbidden lines with widths up to about 500 km s- 1 . The lines are generally assumed to arise in photoionised gas clouds confined by a hot intercloud medium (ie. Krolik et al.
1981). The most reasonable interpretation of the line widths is th a t they are Doppler broadened by mass motions, the derived cloud tem peratures (a few 104K) being too small for therm al velocities to account for the broadening. The clear separation in line widths suggests th a t the broad perm itted lines and the narrow forbidden lines arise in physically distinct regions. These two regions are generally referred to as the Broad Line Region (BLR), which lies close to the centre, and the Narrow Line Region (NLR), which lies further out. More recently, evidence has been found for line emission from an intermediate zone between the BLR and NLR, where the inferred density of the clouds is of the order of 106 — 107 atom s cm -3 (vanGroningen and deBruyn 1989).
1 .5 .1 T h e B r o a d L in e s
1.5.1.1 T h e E m ission L ine clou d s
clouds or filaments. T hat gas exists near to the central engine has been dem onstrated for NGC4151 where Clavel et al. (1987) showed th a t the gravitational potential felt by the NLR gas is larger than th a t for the BLR.
BLR clouds are often represented by cool clouds (T ~ 104K), confined by a hot intercloud medium (T ~ 108K). Observations have shown th a t in m any objects U ~ 0.01 for the high ionization clouds. The uniform ity of the value of U has been used to argue for a two phase model for the BLR. Krolik et al. (1981) have shown th a t owing to a therm al instability the two phase model can only exist for a small range of the radiation- to-gas pressure ratio which corresponds to the ‘m easured’ value of U. It may not be as simple as this, however. Fabian et al. (1986b) showed th a t for the Seyfert Mkn841 (which displays a strong soft excess) the soft X-ray photons would destroy any two phase equilibrium state thereby destroying the clouds. Since Mkn841 is not particularly remarkable at optical wavelengths, Fabian et al. suggest th a t the BLR is shielded in some way from the source of the soft excess w ith perhaps a toroidal BLR shielded by an accretion disk.
There is another possibility. Strong similarities between the emission line spectra of AGN and various types of stellar sources have been noticed, and the similarity extends to the UV (eg. Penston and Allen 1985). Indeed, Penston and Allen (1985) suggested th a t BLR clouds are irradiated stellar chromospheres. P u etter (1989) showed th a t conditions identical to those inferred in a BLR cloud could arise in the bloated atmosphere of a star irradiated by UV radiation. Such a model removes any dependence of the BLR from the continuum emission, since there is no need for a two phase model. Bradley and P u etter (1986) dem onstrated th a t if the BLR cloud motions are Keplerian, the cloud orbits must have a eccentricity near to 1 and the clouds m ust have a roughly constant cross-section. As Penston (1988) notes this is consistent w ith stars in parabolic orbits, but th a t ‘stan d ard ’ BLR clouds constrained by the external medium would change their sizes and cross sections and suffer drag which could cause the m otion to deviate from Keplerian. A potential problem w ith this model, however, is th a t the required num ber of stars (up to 106) implies much more mass in the BLR than is observed. However, this may be got around by the stars being bloated dwarfs.