January-February 2017 16
Research
Paper
Statistical Optimization of Extraction Process for the
Quantification of Valsartan in Rabbit Plasma by a HPLC
Method
M. SREENIVASA REDDY, L. KUMAR*, Z. ATTARI AND R. VERMA1
Department of Pharmaceutics, 1Department of Pharmaceutical Chemistry, Manipal College of Pharmaceutical Sciences, Manipal University, Madhav Nagar, Manipal-576 104, India
Sreenivasa, et al.: A Statistical Approach to HPLC Bioanalytical Method Development of Valsartan This article describes a high performance liquid chromatography method for determination of valsartan in rabbit plasma. The method was statistically optimized, developed and validated as per United States of Food and Drug Administration guidelines. The solvent deproteination technique was opted for the extraction of valsartan from rabbit plasma. Full factorial design was used for the optimization of an extraction method. The main effect of deproteinating agent, volume of deproteinating agent, speed of centrifugation and time of centrifugation was found to be significant at P<0.0001 on all the responses. After deproteinization, the drug was analysed on a C18 column using 20 mM ammonium formate:acetonitrile (58:42 v/v) as the mobile phase with a flow rate of 0.9 ml/min. The standard calibration curve was constructed in the concentration range of 75 ng/ml to 4.0 µg/ml and linearity was found to be 0.9989. Losartan was used as the internal standard. The retention time of valsartan and the internal standard was found to be 11.394 and 6.343 min, respectively. No interference peak was perceived. From the accuracy results, the relative error was found between 0.99 and 13.01% and relative standard deviation was between 1.43 and 12.19%. The percent relative standard deviation of intra-day and inter-day precision was found to be less than 15%. Limit of detection and limit of quantitation were found to be 22.00 and 66.67 ng/ml, respectively. From pharmacokinetic applications, the peak plasma concentration (Cmax) of valsartan oral suspension was found to be 1092.67±39.62 ng/ml at 0.67±1.24 h. The half-life and area under the curve were found to be 19.92±10.28 h and 8393.35±131.14 ng/ml, respectively. The high performance liquid chromatography method was successfully demonstrated as rapid and sensitive method which can be used as an alternative for the analysis of valsartan in plasma samples.
Key words: Statistical optimization, valsartan, HPLC method, rabbit plasma, extraction, deproteination, pharmacokinetic study
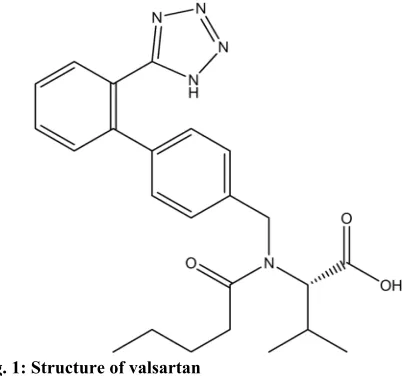
Valsartan, N-(1-oxopentyl)-N-[[2-(1H-tetrazol-5-yl) [1,1-bi-phenyl]-4-yl]methyl]-L-valine (fig. 1) has
an empirical formula of C24H29N5O3 and molecular
weight of 435.5[1]. Valsartan is an orally active, highly selective angiotensin II receptor blocker, which is widely used for the treatment of hypertension. But, the low oral bioavailability (approx. 23%) of valsartan restricts its use as an antihypertensive agent. This
low oral bioavailability is due to poor absorption and
permeability of this drug in the gastrointestinal tract, minimal metabolism and large excretion (approx. 80%) as unchanged drug[1-4].
Several bioanalytical methods have been reported
for the estimation of valsartan in plasma samples. Numerous high performance liquid chromatography (HPLC) methods attached with fluorimetric detector
have been reported for the estimation of valsartan
in human plasma[5-8]. Similarly, several HPLC
methods using tandem mass spectroscopy (LC/MS/ MS) have also been reported for analysis of drug in plasma with their high sensitivity[9-11]. The two liquid chromatography-electrospray ionization-tandem mass spectrometry (LC-ESI-MS/MS) has been described for the estimation of drugs (from fixed-dose combination)
in rat and human plasma[12,13]. HPLC methods attached with photodiode array-fluorescence and
ultraviolet-*Address for correspondence
E-mail: [email protected]
This is an open access article distributed under the terms of the Creative Commons Attribution-NonCommercial-ShareAlike 3.0 License, which allows others to remix, tweak, and build upon the work non-commercially, as long as the author is credited and the new creations are licensed under the identical terms
Accepted 26 December 2016 Revised 26 October 2016
17
fluorescence detectors for the analysis of drugs in human
plasma have also been reported[14-17]. But, the LC/MS/ MS, LC-ESI-MS/MS, HPLC with photodiode array-fluorescence, HPLC with ultraviolet-fluorescence and HPLC with fluorimetric detections are very expensive
in comparison of HPLC with ultraviolet (UV)
detection. HPLC with UV detectors are easy to handle. The HPLC methods with photodiode array (PDA) and
UV detectors have also been reported for the extraction of valsartan from the human plasma[1,18,19].
In an HPLC bioanalytical method, valsartan from human plasma was first isolated by a solid-phase extraction on a Bond-Elut CH cartridge. After evaporating the solvent, the residue was reconstituted in the 0.1% trifluoroacetic acid (TFA) in acetonitrile (ACN)/H2O (45/55 v/v) and the drug was analysed using HPLC with UV detector at 215 nm wavelength with the flow rate of 1.0 ml/min[18].
Similarly, in another HPLC bioanalytical method,
valsartan was first isolated with organic solvent and then the organic solvent was evaporated under a gentle stream of nitrogen at 40°. Then the residue was dissolved in 0.1 ml mobile phase (ACN and 15 mM potassium dihydrogen phosphate with pH 2.0 in a ratio 42:58 v/v) and the samples were analysed using UV detector at 215 nm wavelength with the flow rate of 1.2 ml/min using Luna C18 (150×4.6 mm I.D., particle size
5 µm) column (Phenomenex®, Torrance, CA, USA)[1]. An HPLC bioanalytical method with PDA detector has also been stated. In this method the triple drug combination of valsartan, amlodipine and
hydrochlorothiazide was analysed in human plasma by
using a mixture of methanol (MTH) /ACN (50:50 v/v) as a protein precipitating solvent. In this method, after isolation the supernatant was collected and filtered in
a glass tube. Then the solvent was evaporated under nitrogen and the residue was reconstituted with 0.5 ml mobile phase, filtered and analysed at 254 nm using PDA detector. The mobile phase used in the present method was the combination of ACN and ammonium formate buffer (pH 3.5±0.2) with a gradient mode. The flow rate and stationary phase used were 1.0 ml/min
and Gemini C18 (250×4.6 mm i.d., particle size 5 µm)
column (Phenomenex®, USA) protected with C
18 (4×2 mm i.d.) guard column, respectively[19]. However, these existing HPLC-UV and HPLC-PDA methods involved multiple steps of extraction and use of expensive gases (such as nitrogen) for evaporation of organic solvents.
Hence, there is a need to develop and validate a simpler, easier, faster yet economical new bioanalytical method for the extraction and estimation of valsartan
in plasma samples using HPLC with a UV detector. It is also necessary that the extraction process be simpler as rapid as possible. Although, the extraction
process has been well established, it is affected by the
choice of deproteinizing agent used, volume of the extracting solvent, simplicity of the extraction and the protein separating process[1,7,8,17]. Furthermore, in the
estimation process, short analysis time, sensitivity,
robustness, precision, accuracy, sharpness of the peak and other economic aspects should be considered. These factors can be achieved with appropriate
extraction conditions, appropriate buffer selection, pH,
UV detector wavelength and flow rate, stationary and mobile phase. A slightly volatile buffer with a suitable
pH should be used with respect to the pKa value of
drug for appropriate elution, while composition of the mobile phase and flow rate should be adjusted to
reduce the retention time[20].
The aim of the present study was to develop and
validate a sensitive, simple, easy, fast, reproducible, precise and economical bioanalytical HPLC method
for the estimation of valsartan in rabbit plasma. To achieve the aim of the present study, design of experiment (DoE) approach has been embraced for the statistical optimization of deproteinizing agent, volume of deproteinizing agent, centrifugation speed and time as a part of the extraction process. Further, the extracted drug samples were analysed with the newly developed and validated HPLC bioanalytical method.
MATERIALS AND METHODS
January-February 2017 18
for preparation of buffer. Formic acid was purchased from RFCL Limited (New Delhi, India) for adjustment of buffer pH. HPLC grade ACN was purchased from Finar Limited (Ahmadabad, India) as organic solvent for mobile phase. HPLC grade MTH was purchased from Labort Fine Chem Pvt. Ltd. (Surat, India) as a deproteinizing agent for extraction of drug from plasma samples.
Estimation of valsartan in rabbit plasma was carried
out using a HPLC (model no. LC-2010 CHT,
Shimadzu Corporation, Kyoto, Japan) connected to a
dual wavelength UV detector, column oven and auto sampler (Shimadzu Corporation, Kyoto, Japan). LC solution 5.57 release was used for recording of HPLC chromatograms. A Phenomenex® HyperClone C
18 column (250×4.6 mm id, 5 µm, BDS 130 Å) was used
to accomplish the separation, with a C18 Phenomenex®, 4×3.0 mm i.d. security guard column. A Millipore glass filter (Millipore filter cellulose nitrate gridded with 0.22
µ size and 47 mm diameter) assembly attached with
vacuum pump was used to filter mobile phase. Samples were sonicated for 15 min using ultrasonic cleaner–15 l (Equitron-Medica Instrument Mfg. Co., Mumbai, India) to remove dissolved gases from the mobile phase. A Genie-2 Spinix model vortex mixer, a cooling centrifuge (Sigma, Germany) was used for extraction of the drug from rabbit plasma. Eutech Instruments pH
510 using a glass electrode Van London Co., USA was used to adjust the pH of buffer.
Chromatographic conditions:
In the mobile phase, 58 parts of 20 mM ammonium formate buffer and 42 parts of ACN was used. The pH of ammonium formate buffer was adjusted to 3.0±0.02 with formic acid. The mobile phase was delivered isocratically at 0.9 ml/min flow rate. Phenomenex®
Hyper Clone C18 column connected with C18
Phenomenex® security guard column was used as the
stationary phase. The column temperature was adjusted to 25° with thermo-statistically controlled column oven. The drug was quantified at 250 nm wavelength with UV detector while keeping the 15 min run time for each chromatographic analysis.
Preparation of stock solutions:
Accurately weighed 10 mg amount of valsartan was taken in a 100-ml glass volumetric flask and was dissolved in 2 ml MTH. The volume was made up to 100 ml with the mobile phase to get 100 µg/ml concentrations. Further, the working solutions were
prepared with appropriate dilutions of the above
prepared stock solution using mobile phase. Losartan was used as an internal standard (IS) in this study. Accurately weighed amount of losartan (10 mg) was taken in a 100-ml glass volumetric flask and was dissolved in 2 ml MTH. The volume was made up to the mark with mobile phase to produce 100 µg/ml concentrations. Further, appropriate dilution was made to produce a working concentration of losartan.
Calibration standard plot from 75 to 4000 ng/ml was prepared in rabbit plasma by spiking 10 µl drug solution of working stock solutions and 10 µl IS (with 2500 ng/ml final plasma concentration). The four quality control solutions such as the lower limit of quantification (LLQC) 75 ng/ml, lower quality control (LQC) 100 ng/ml, medium quality control (MQC) 1000 ng/ml and higher quality control (HQC) 4000 ng/ml were prepared by spiking 10 µl of each concentration and 10 µl of the internal standard.
Technique for extraction of valsartan from rabbit plasma:
A solvent deproteinization technique was used for extraction of valsartan from rabbit plasma. Two
hundred microliters of rabbit plasma, 10 µl standard
drug solutions and 10 µl IS were taken in a micro centrifuge tube and shaken for 30 s to mix it properly. Then the pre-optimized deproteinizing agent and volume was added to the tubes and vortexed for 5 min. The sample-containing micro centrifuge tubes were centrifuged at pre-optimized speed for an optimized time at 4°.
Optimization of extraction process:
In the present study, C18 silica packed HPLC column with the security guard column was used for better
separation. The deproteinizing agent, volume of deproteinizing agent, speed of centrifugation and time of centrifugation may play an important role in the extraction of drug. Hence, in this research work, these four factors were optimized using DoE (Design
Expert® v.9.0.5.1 software).
In the present study, ACN and MTH were used as deproteinizing agents. Each deproteinizing agent was used at two different levels, such as 380 ml and 580 ml. Two different centrifugation speeds such as 7500 and
19
Optimization of independent variables with their interactions became easier with the applications of
design of experiments[21-23]. With the help of design of
experiment, it is possible to study the effect of abundant
variables at a time. This research work involves the use of full factorial design for optimization of independent variables. In this study, four independent variables with two levels were used, which suggested total 16 runs to execute the experiment. The deproteinizing agent (A), volume of deproteinizing agent (B), speed of centrifugation (C) and time of centrifugation (D) were used as independent variables. These independent variables were projected at two different levels, such as minimum (−1) and maximum (+1)[14,21,24-27]. Total 16 experimental runs were executed and the obtained response like drug/IS peak area ratio (RS1), the number of theoretical plates (USP) (RS2), drug tailing factor (5%) (RS3), drug resolution (RS4) and drug capacity
factor (RS5) was fed into the software to study the interaction between the independent variables and for
optimization.
Factors and levels used in 24 full factorial design for
extraction of valsartan from rabbit plasma are shown
in Table 1 and the composition of experimental runs
are shown in Table 2. The significance of independent variables was estimated using analysis of the variance (ANOVA) and the polynomial Eqn., RS = β0 +β1A+β2B +β3C+β4D+β12AB+β13AC+β14AD+β23BC+β24BD+β34C
D+β123ABC+β134ACD+β124ABD+β234BCD, where, RS
is the response, β represents as regression coefficients and A, B, C and D are deproteinizing agent, volume of deproteinizing agent, speed of centrifugation and time of centrifugation, respectively.
Validation of HPLC method:
Optimized and developed method was validated as
per the USFDA guidelines. The method was validated with the following steps such as selectivity, linearity,
accuracy, precision, recovery and stability[28].
Selectivity:
Selectivity is related to the absence of interference on
the retention time of drug peak by the proteins and/or other impurities. The rabbit blank plasma samples and plasma with drugs (for LLQC, LQC, MQC and HQC samples) were extracted with the same above given procedure for drug extraction and were analysed by HPLC with six replicate injections of each.
Independent factors Levels
-1 +1
Deproteinating agent ACN MTH
Volume of deproteinating agent (ml) 380 580
Speed of centrifugation (rpm) 7500 15000
Time of centrifugation (min) 8 15
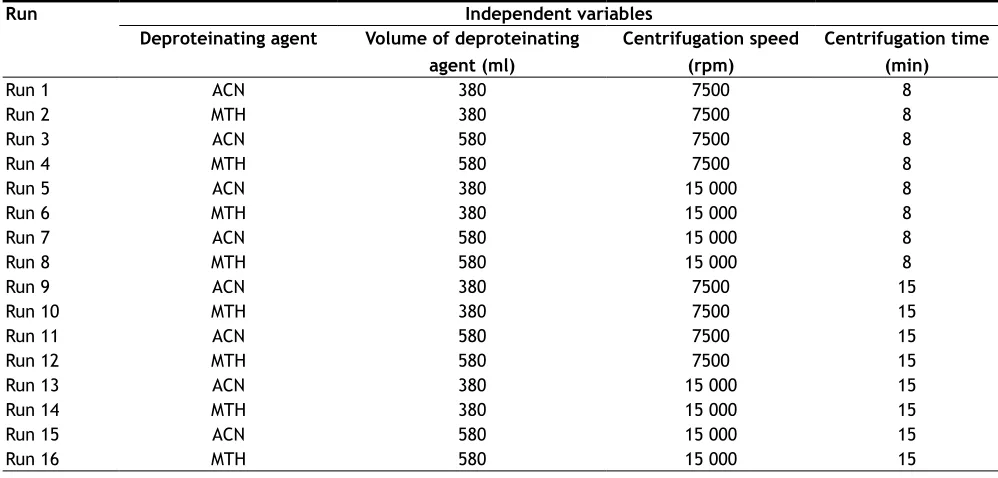
TABLE 1: 24 FULL FACTORIAL DESIGNS FOR EXTRACTION OF VALSARTANFROM RABBIT PLASMA
Run Independent variables
Deproteinating agent Volume of deproteinating agent (ml)
Centrifugation speed (rpm)
Centrifugation time (min)
Run 1 ACN 380 7500 8
Run 2 MTH 380 7500 8
Run 3 ACN 580 7500 8
Run 4 MTH 580 7500 8
Run 5 ACN 380 15 000 8
Run 6 MTH 380 15 000 8
Run 7 ACN 580 15 000 8
Run 8 MTH 580 15 000 8
Run 9 ACN 380 7500 15
Run 10 MTH 380 7500 15
Run 11 ACN 580 7500 15
Run 12 MTH 580 7500 15
Run 13 ACN 380 15 000 15
Run 14 MTH 380 15 000 15
Run 15 ACN 580 15 000 15
Run 16 MTH 580 15 000 15
January-February 2017 20 Linearity:
Calibration plot was constructed with blank samples (plasma without drug) and eight different concentrations from 75 ng/ml to 4.0 µg/ml. Each concentration was repeated in triplicates. Drug concentration was plotted against drug/IS peak area ratio to find the linear regression and correlation coefficient.
Accuracy:
Accuracy was determined at three different quality control concentrations such as LQC, MQC and HQC. Percent accuracy was calculated using nominal concentrations and average back calculated concentrations using the formula given in Eqn. Average back calculated concentration was determined, from six replicate injections of each quality control concentration. Percent accuracy= BC/NC×100, where, BC represents the average back calculated concentration and NC represents the nominal concentration of drug.
Precision:
Study was conducted as intra-day precision and
inter-day precision. In this study three quality control levels, such as LQC, MQC and HQC were considered.
Intra-day precision of the developed method was performed
for these three quality controls by means of six replicates of each two times in a day (i.e., morning and evening). Similarly, inter-day precision study was performed for these three quality controls by means
of six replicates of each, two times on two different
days (i.e., 1 and 2d). The drug/IS peak area ratio was
measured and percent relative standard deviation
(%RSD) was calculated[21,29].
Recovery:
Absolute recovery of valsartan from spiked rabbit
plasma samples (extracted samples) was compared with analytical standards of the same concentration
(un-extracted samples). In the present study, the mean
percent recovery was calculated at three different
levels of concentration, such as LQC, MQC and HQC. For each concentration level, the extracted and
un-extracted samples were analysed in triplicate and the
mean was calculated. The value of recovery towards 100% indicates that the selected solvent has very high extraction efficiency and it also indicates that the method is robust. The formula used to calculate the percent recovery is given in Eqn. Percent recovery = AE/AU×100, where, AE is the peak area of extracted samples and AU is the peak area of un-extracted samples.
Limit of detection and limit of quantitation:
Limit of detection and limit of quantitation for valsartan was determined at a signal-to-noise ratio of 3:3 and 10:1, respectively, by using serial dilutions of known
concentrations[30,31].
Stability studies:
Stability of valsartan in rabbit plasma was evaluated
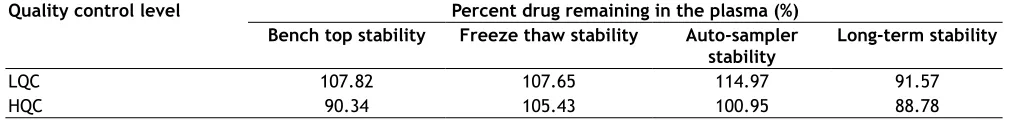
using LQC and HQC samples under different stress conditions. The percent drug remaining in the plasma was calculated using the formula given in Eqn. Percent drug remaining = final concentration/initial concentration×100.
Bench top stability study:
Bench top stability study of valsartan in rabbit plasma was performed by keeping three replicates of each low and high plasma quality control concentrations for 24 h at room temperature. After 24 h, the samples were processed and the drug was extracted. The extracted
samples were analysed by HPLC system and the
concentration was calculated.
Freeze thaw stability study:
Freeze thaw stability of valsartan in rabbit plasma was
assessed by analysing three replicates of each low and high quality control concentrations after three freeze and thaw cycles. For each cycle, the samples were kept at −70° for 12 h for frozen and thaw at room temperature for 2 to 3 h. After third cycle, the samples were extracted and were analysed using HPLC. The concentration was calculated using linear equation obtained from calibration plot.
Auto-sampler stability:
Auto-sampler stability of drug in rabbit plasma
was accessed by analysing three replicates of each processed low and high quality control concentrations. The processed and reconstituted samples were stored in an auto-sampler tray for 24 h. After specified time, the samples were analysed using HPLC and the
concentration was calculated.
Long-term stability study:
This is the study which gives the information about the
21
Application of method in pharmacokinetics:
To find out the application of this HPLC method, it was used to assess the pharmacokinetics of valsartan in white male New Zealand rabbits as the animal model. This species of animals was selected, because of their ease of availability, handling and mild-tempered. These species of animals are also less susceptible to infections. The average weight of the rabbits used in the present research was 2.5 kg. The study was performed after obtaining consent from Institutional Animal Ethical Committee (IAEC), Manipal University, Manipal (IAEC/KMC/24/2014). The guidelines were obeyed to execute the study. A 12 h dark/light cycle was maintained throughout the study. The animals had
free access to the food and water ad libitum. Oral drug suspension (containing 2.8 mg/2 ml) was given to the rabbits (n=3). The 0.5 ml of blood was withdrawn from the ear marginal vein of each rabbit at predetermined time intervals such as 0, 0.5, 1, 2, 4, 6, 8, 10, 12, 24 and 48 h. Immediately after collection, the blood samples were transferred into the micro centrifuge tubes containing 10 µl EDTA solutions (2.5% w/v). Then, the plasma was separated from the blood using a cooling centrifuge (Sigma, Germany) at 4° using 15 000 rpm for 15 min. The separated plasma samples were stored at −70° until analysis[32,33].
Present samples were processed for extraction using the above optimized procedure for extraction of drug from the rabbit plasma. Then the spiked samples were run into the HPLC by following the above validated method. The obtained peak area was used to calculate the drug/IS peak area ratio. Then the ratio was converted into the concentration of drug. The obtained concentration was fit into the WinNonlin standard edition v.5.2 (Pharsight, Mountain View, CA, USA) to estimate the pharmacokinetic parameters of valsartan.
RESULTS AND DISCUSSION
Optimization of extraction process, the extraction
process was optimized using the Design Expert® v.9.0.5.1 (Stat-Ease, Inc., Mumbai) by employing the full factorial design. The main and complexed effects of independent factors on responses were analysed. The effect of independent variables on responses was assessed with the help of polynomial equation and
perturbation plots constructed with the software as
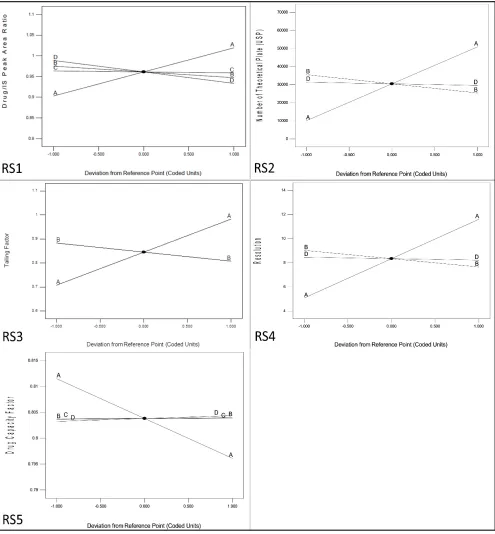
shown in fig. 2.
Effect of independent factors on drug/IS peak area
ratio (RS1) has been reported in fig. 2 (RS1). Fig. 2 showed that the volume of deproteinizing agent (B)
and centrifugation time (D) slightly decreased the peak area ratio. Similarly, the centrifugation speed (C) had no effect on extraction of the drug from the plasma. Deproteinizing agent (A) showed a significant effect on drug/IS peak area ratio. It indicated that ACN has very low drug extraction property as compared to MTH. Effect of the deproteinizing agent (A), volume of deproteinizing agent (B) and centrifugation time (D)
on the number of theoretical plates (USP, RS2) was
demonstrated in fig. 2 (RS2). This perturbation plot indicated that there was no effect of centrifugation time (D) on the number of theoretical plates, whereas the volume of deproteinizing agent (B) slightly decreased the number of theoretical plates (USP). The deproteinizing agent (A) again indicated that MTH gave a high number of theoretical plates (USP) in comparison to ACN. High number of theoretical plates (USP) was desired requirement as per regulatory guidelines.
Effect of deproteinizing agent (A) and volume of the deproteinizing agent (B) on drug tailing factor (5%,
RS3) was reported in the fig. 2 (RS3). Effect of the deproteinizing agent (A) as shown in the fig. 2 (RS3),
MTH increased the drug tailing factor (5%) compared to ACN, but it showed that the maximum tailing factor value found with MTH was near to 1.051. Further, the volume of deproteinizing agent (B) slightly decreased the tailing factor (5%).
Fig. 2 (RS4) showed the effect of deproteinizing agent (A), volume of deproteinizing agent (B) and centrifugation time (D) on drug resolution (RS4). As the results yielded by the deproteinizing agent (A) MTH, indicated a very high drug resolution value in comparison to ACN. No effect of centrifugation time (D) on drug resolution was observed. As the volume of deproteinizing agent (B) increased the drug resolution slightly decreased.
Effect of the deproteinizing agent (A), volume of deproteinizing agent (B), centrifugation speed (C) and centrifugation time (D) on drug capacity factor (RS5) is
reported in fig. 2 (RS5). The volume of deproteinizing agent (B), centrifugation speed (C) and centrifugation time (D) did not have any effect on drug capacity factor. As per the results of deproteinizing agent (A), MTH showed less drug capacity factor value, compared to ACN.
January-February 2017 22
Fig. 2: Effect of various factors on drug/IS peak area ratio, drug tailing factor, drug resolution, and drug capacity factor
Effect of deproteinizing agent (A), volume of deproteinizing agent (B), centrifugation speed (C) and centrifugation time (D) on drug/IS peak area ratio (RS1); number of theoretical plates (USP) (RS2); drug tailing factor (RS3); drug resolution (RS4) and drug
capacity factor (RS5)
obtained from each injection were entered in the Design
Expert® software and were analysed using the ANOVA. For an experimental design with four independent factors, the suitable model fitting to the responses such as a drug/IS peak area ratio, number of theoretical plates (USP), drug tailing factor (5%), drug resolution and drug capacity factor were R2FI, R3FI, R2FI, R3FI
and R2FI models, respectively. Polynomial equations for the response factors are given below. Drug/IS peak
area ratio (RS1
)=+0.96+0.058A-0.014B-0.0024C-0.028D+0.021CD; number of theoretical plates (USP)
)=+0.85+0.14A-0.038B-23
0.016AB; drug resolution (RS4 )=+8.34+3.26A-0.69B-0.12D-0.31AB-0.054AD-0.19BD-0.19ABD; drug
capacity factor (RS5
)=+0.80-0.0077A+0.00019B- 0.00006C+0.00056D+0.00019AC-0.00044BC-0.0003BD-0.0003CD, where, RS1, RS2, RS3, RS4 and RS5 are representatives of response factors such as
a drug/IS peak area ratio, the number of theoretical plates (USP), drug tailing factor, drug resolution and drug capacity factor, respectively. The A, B, C and D are representatives of deproteinating agent, volume of deproteinating agent, centrifugation speed and centrifugation time, respectively. Main effect of deproteinating agent, volume of deproteinating agent, speed of centrifugation and time of centrifugation was found most significant, i.e., P<0.0001 on all the responses. MTH gives sharp and symmetrical peak, whereas ACN gives broad peak. Effect of
deproteinating agent has also been reported in fig. 3.
Validation of optimized factors, responses obtained from optimized independent factors such as
deproteinating agent, volume of deproteinating agent, speed of centrifugation and time of centrifugation were validated by comparing the observed responses and predicted responses. The difference between the
predicted responses and observed responses was
found to be within±20.71% as shown in the Table 3. The percent residual value is calculated using the formula given in bellow Eqn.[21]: percent residual= (predicted responses-observed responses/predicted
responses)×100, desirability value was found to be
0.752.
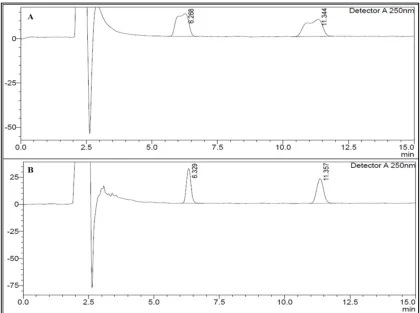
In the present study, retention time of losartan was found to be 6.343 min, whereas the retention time of valsartan was found to be 11.394 min. When the spiked blank plasma samples were run in the HPLC system no
Fig. 3: Effect of deproteinating agent, (A) Acetonitrile and (B) methanol
Response Predicted results Observed results Residual values (%)
Drug/IS peak area ratio (RS1) 1.011 1.030 -1.88
Number of theoretical plates (USP) (RS2) 32837 36765 -11.96
Drug tailing factor (5%) (RS3) 0.930 0.920 1.08
Drug resolution (RS4) 8.268 9.980 -20.71
Drug capacity factor (RS5) 0.806 0.800 0.74
January-February 2017 24
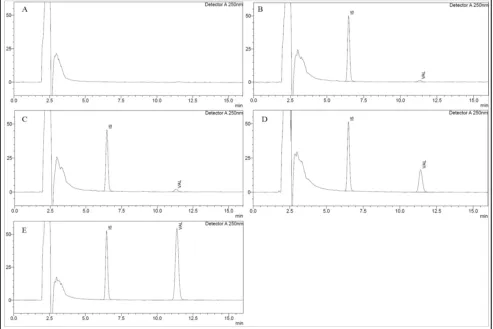
peak was found on or near to the drugs retention times. Chromatograms of drug free plasma and plasma with drugs (LLQC, LQC, MQC and HQC) have been shown in fig. 4.
Linearity value was found to be 0.9989. The linear regression obtained from a calibration plot was found as y=0.0003x+0.0169. Where, y is representative of drug/IS peak area ratio and x is representative of drug concentration. Accuracy results for the drug in rabbit plasma are shown in Table 4. The least percent relative error (%RE) and %RSD values were obtained for valsartan in rabbit plasma. Relative error was found from 0.99% to 13.01% and %RSD was from 1.43% to 12.19%. Percent accuracy was also found within the range such as from 100.99 to 113.01%. Intra- and
inter-day precision was determined for three quality controls and was expressed as %RSD. Intra-day and inter-day precision studies were performed using six replicates of LQC, MQC and HQC. The intra-day and inter-day precision results are reported in Table 4.
Absolute mean recovery of valsartan from spiked
rabbit plasma (extracted) samples was compared with un-extracted samples of same concentration and found
to be within 80.97 to 102.51% with percent RSD values between 6.18 and 12.39%. Recovery results are reported in Table 5.
Limits of detection and limit of quantitation were found to be 22.00 and 66.67 ng/ml, respectively. Stability
studies result is reported in the Table 6. Bench top
Fig. 4: Chromatogram of drug free plasma, rabbit plasma spiked at LLQC, LQC, MQC and HQC
(A) Drug free plasma; (B) rabbit plasma spiked at LLQC concentration; (C) rabbit plasma spiked at LQC concentration; (D) rabbit plasma spiked at MQC concentration and (E) rabbit plasma spiked at HQC concentration
Quality control level
Nominal concentration
(ng/ml)
Precision Accuracy
%RSD Percentage accuracy (%)
%RSD %RE Intra-day Inter-day
LQC 100 13.09 12.84 113.01 12.19 13.01
MQC 1000 7.13 6.39 100.99 3.57 0.99
HQC 4000 13.10 14.69 104.63 1.43 4.43
25
stability of valsartan in plasma was investigated at two levels, such as LQC and HQC and results revealed that
the valsartan was stable for 24 h at both the levels with
the drug remaining concentration in plasma 107.82 and 90.34%, respectively. Repeated three cycles of freeze and thaw for drugs containing rabbit plasma samples was performed at two levels. The results for LQC and HQC levels were found to be 107.65 and 105.43%, respectively. Freeze and thaw results were found near to 100%. Auto-sampler stability of valsartan was investigated at two levels, such as LQC and HQC. Auto-sampler stability results of LQC and HQC were found to be 114.97 and 100.95%, respectively. Long-term stability of valsartan in rabbit plasma was investigated for two levels, such as LQC and HQC. The long-term stability of valsartan in rabbit plasma for LQC and HQC levels was found to be 91.57 and 88.78%, respectively.
Present bioanalytical method has been used to estimate
the valsartan in rabbit plasma after a single dose of the oral suspension to the rabbits. The obtained peak area was used to calculate the drug/IS peak area ratio and ratio was converted into the concentration of drug. Peak plasma concentration (Cmax) of valsartan oral
suspension was found to be 1092.67±39.62 ng/ml at 0.67±1.24 h. The half-life and area under the curve were found to be 19.92±10.28 h and 8393.35±131.14 ng/ml, respectively. The plot for average plasma concentration versus time is given in fig. 5.
Process of extraction was optimized using design of experiments. A total of 16 runs were performed in the present study to find out drug/IS peak area ratio, number of theoretical plates (USP), tailing factor (5%), resolution and capacity factor. Effect of factors such as deproteinating agent, volume of deproteinating agent, speed of centrifugation and time of centrifugation on responses was optimized using Design Expert® version
Quality control level Nominal concentration (ng/ml) Percent mean recovery (%) %RSD
Mean SD
LQC 100 102.51 6.33 6.18
MQC 1000 100.94 7.17 7.10
HQC 4000 80.97 10.03 12.39
TABLE 5: RECOVERY OF VALSARTAN FROM RABBIT PLASMA (n=3)
Quality control level Percent drug remaining in the plasma (%) Bench top stability Freeze thaw stability Auto-sampler
stability Long-term stability
LQC 107.82 107.65 114.97 91.57
HQC 90.34 105.43 100.95 88.78
TABLE 6: RESULTS OF STABILITY STUDIES
9.0.5.1 software. Obtained results of RS1, RS2, RS3, RS4 and RS5 were fed into the software and desirability
was calculated. The desirability is an indicative for the
assessment of suitability of method and the value was
found towards 1.0, which indicates that the process of extraction is strong[16].
MTH was optimized as a deproteinating agent and found to be good in comparison of ACN, due to its very sharp and symmetrical peak of drug. Extraction
of valsartan from rabbit plasma follows a very simple
procedure.
Further, the method was validated as per the USFDA guidelines. The validated method was simple,
economical and rapid due to its short run time of
6.343 and 11.394 min for losartan and valsartan, respectively. Specificity study confirmed that there was no interference by the protein and/or impurities with the drug retention time. Hence, the method appeared to be suitable for further analysis. Correlation coefficient value obtained from linearity indicated a strong correlation between the drug concentrations and drug/ IS peak area ratio. Accuracy results suggested that
the method was accurate and can be used for routine
January-February 2017 26
After three freeze-thaw cycles, stability results were found to be between 100 and 110%. This reflected that
valsartan is stable in rabbit plasma even after three
freeze thaw cycles. Autosampler stability results also
revealed that the valsartan was stable in rabbit plasma
in autosampler tray for 24 h. Stability of valsartan after 30 d was found to be more than 85%, which proved that the valsartan is stable in rabbit plasma at −70° for 30 d.
A method was developed and validated for the analysis of valsartan in rabbit plasma with good and practical sensitivity for the quantification of drug in rabbit plasma. Pharmacokinetic study of valsartan in rabbit
plasma indicated that this method could be used for
routine studies due of its robustness.
A HPLC method was developed and optimized successfully by implementing the DoE. The data has been analysed using Design Expert® version 9.0.5.1 software. High significant effect of independent variables has been noticed in the study. Effect of
variables on responses has also been reported in the
form of perturbation plots. This study concludes that the DoE is a highly efficient tool for the optimization
of independent variables for a bioanalytical method
development. The present study also indicated that MTH has the potential to be a very good deproteinizing
agent in comparison to ACN for extracting valsartan from rabbit plasma. Further, the method has been validated as per USFDA guidelines and the results
obtained indicated that the present method was a novel,
simple, accurate, precise, economical and robust. The
application of this method has also been studied by
giving a single dose of oral drug suspension to the rabbits. The results obtained from the pharmacokinetic study were quite reliable and indicated that the method was sensitive enough to be commercially viable. The
present method could be used for the estimation of valsartan in rat and human plasma too after partial
validation.
Acknowledgements:
The authors would like to recognize Lupin Ltd., Goa, India for providing drug as a gift sample. The authors would also like to thank Manipal University, Manipal, Karnataka, India for providing the research facilities to complete this research work.
Conflict of interest:
There are no conflicts of interest.
Financial support and sponsorship:
The authors thank the Vision Group on Science & Technology, Bangalore, Karnataka, India and All India Fig. 5: Area under the curve (AUC) of valsartan from oral drug suspension
27
Council of Technical Education, New Delhi, India for providing research grants to support this research work.
REFERENCES
1. Piao ZZ, Lee ES, Tran HTT, Lee BJ. Improved analytical validation and pharmacokinetics of valsartan using HPLC with UV detection. Arch Pharmacal Res 2008;31:1055-9. 2. Brookman LJ, Rolan PE, Benjamin IS, Palmer KR, Wyld PJ,
Lloyd P, et al. Pharmacokinetics of valsartan in patients with liver disease. Clin Pharmacol Ther 1997;62:272-8.
3. Iseaili ZH. Clinical pharmacokinetics of angiotensin II (AT 1) receptor blockers in hypertension. J Hum Hypertens 2000;14:S73-S86.
4. Waldmeier F, Flesch G, Müller P, Winkler HP, Buhlmayer P, De Gaspro M. Pharmacokinetics, disposition and
biotransformation of [14C]-radiolabelled valsartan in healthy
male volunteers after a single oral dose. Xenobiotica 1997;27:59-71.
5. Flesch G, Müller P, Lioyd P. Absolute bioavailability and pharmacokinetics of valsartan, an angiotensin II receptor antagonist, in man. Eur J Clin Pharmacol 1997;52:115-20. 6. Czendlik C, Sioufi A, Preiswerk G, Howald H. Pharmacokinetic
and pharmacodynamic interaction of single doses of valsartan and atenolol. Eur J Clin Pharmacol 1997;52:451-9.
7. González L, López JA, Alonso RM, Jiménez RM. Fast screening method for the determination of angiotensin II receptor antagonists in human plasma by high performance liquid chromatography with fluorimetric detection. J Chromatogr A 2002;949:49-60.
8. Macek J, Klima J, Ptáèek P. Rapid determination of valsartan in human plasma by protein precipitation and high-performance liquid chromatography. J Chromatogr B 2006;832:169-72. 9. Koseki N, Kawashita H, Hara H, Niina M, Tanaka M,
Kawai R, et al. Development and validation of a method for quantitative determination of valsartan in human plasma by liquid chromatography-tandem mass spectroscopy. J Pharm Biomed Anal 2007;43:1769-74.
10. Li H, Wang YG, Jiang Y, Tang YB, Wang J, Zhao L, et al. A liquid chromatography/tandem mass spectrometry method for the simultaneous quantification of valsartan and hydrochlorothiazide in human plasma. J Chromatogr B 2007;852:436-42.
11. Jangala H, Vats P, Khuroo AH, Monif T. Development and validation of a LC-MS/MS method for the simultaneous
estimation of amlodipine and valsartan in human plasma:
Application to a bioequivalence study. Sci Pharm 2014;82:585-600.
12. Gonzalez O, Iriarte G, Rico E, Ferreirós N, Maguregui MI, Alonso RM, et al. LC-MS/MS method for the determination of several drugs used in combined cardiovascular therapy in human plasma. J Chromatogr B Analyt Technol Biomed Life Sci 2010;878:2685-92.
13. Gadepalli SG, Deme P, Kuncha M, Sistla R. Simultaneous
determination of amlodipine, valsartan and hydrochlorothiazide
by LC-ESI-MS/MS and its application to pharmacokinetics in rats. J Pharm Anal 2014;4:399-406.
14. Gonzalez O, Iriarte G, Ferreirós N, Maguregui MI, Alonso RM, Jiménez RM. Optimization and validation of a SPE-HPLC-PDA-fluorescence method for the simultaneous determination of drugs used in combined cardiovascular therapy in human plasma. J Pharm Biomed Anal 2009;50:630-9.
15. Iriarte G, Ferreirós N, Ibarrondo I, Alonso RM, Maguregui MI,
Gonzalez O, et al. Optimization via experimental design of an SPE-HPLC-UV-fluorescence method for the determination of valsartan and its metabolite in human plasma samples. J Sep Sci 2006;29:2265-83.
16. Iriarte G, Ferreirós N, Ibarrondo I, Alonso RM, Maguregui IM, Jiménez RM. Biovalidation of an SPE-HPLC-UV-fluorescence method for the determination of valsartan and its metabolite valeryl-4-hydroxy-valsartan in human plasma. J Sep Sci 2007;30:2231-40.
17. Daneshtalab N, Lewanczuk RZ, Jamali F. High-performance liquid chromatographic analysis of angiotensin II receptor antagonist valsartan using a liquid extraction method. J Chromatogr B Analyt Technol Biomed Life Sci 2002;766:345-9. 18. Müller P, Flesch G, Gasparo MD, Gasparini M, Howald
H. Pharmacokinetics and pharmacodynamic effects of the angiotensin II antagonist valsartan at steady state in healthy, normotensive subjects. Eur J Clin Pharmacol 1997;52:441-9. 19. Sharma RN, Pancholi SS. Simple RP-HPLC method for
determination of triple drug combination of valsartan, amlodipine and hydrochlorothiazide in human plasma. Acta Pharm 2012;62:45-58.
20. Dolan J. A guide to HPLC and LC-MS buffer selection. ACE HPLC Columns-ultra inert base-deactivated HPLC columns. ACE HPLC Columns. p. 1-20.
21. Kumar L, Reddy MS, Managuli RS, Pai KG. Full factorial design for optimization, development and validation of HPLC method to determine valsartan in nanoparticles. Saudi Pharm J 2015;23:549-55.
22. Awotwe-Otoo D, Agarabi C, Faustin PJ, Habib MJ, Lee S, Khan MA, et al. Application of quality by design elements for
the development and optimization of an analytical method for
protamine sulfate. J Pharm Biomed Anal 2012;62:61-7. 23. Bozkir A, Saka OM. Formulation and investigation of 5-FU
nanoparticles with factorial design-based studies. II Farmaco 2005;60:840-6.
24. Singh J, Philip AK, Pathak K. Optimization studies on design and evaluation of orodispersible formulation of indomethacin. AAPS PharmSciTech 2008;9:60-6.
25. Singh KS, Dodge J, Durrani MJ, Khan MA. Optimization and
characterization of controlled release pellets coated with
experimental latex-I: anionic drug. Int J Pharm 1995;125: 243-55.
26. Nagarwal RC, Srinatha A, Pandit JK. In situ forming formulation: Development, evaluation and optimization using factorial design. AAPS PharmSciTech 2009;10:977-84. 27. Yahiaoui I, Aissani-Benissad F. Experimental design for
copper cementation process in fixed bed reactor using two-level factorial design. Arabian J Chem 2010;3:187-90. 28. USFDA Guidance for Industry. Bioanalytical Method
Validation. U.S. Development of Health and Human Services, Food and Drug Administration, Center for Drug Evaluation and Research (CDER), Center for Veterinary Medicine (CVM); 2001.
29. Rajput AP, Sonanis MC. Development and validation of a
rapid RP UPLC method for the determination of aspirin and
dipyridamole in combined capsule formulation. Int J Pharm Pharmaceut Sci 2011;3:156-60.
January-February 2017 28 31. Ramaswamy A, Dhas ASAG. Development and validation of
analytical method for quantitation of emtricitabine, tenofovir, efavirenz based on HPLC. Arabian J Chem 2014.
32. Chatterjee A, Kumar L, Bhowmik BB, Gupta A. Microparticulated antiHIV vaginal gel: In vitro-in vivo drug release and vaginal irritation study. Pharm Dev Technol 2011;16:466-73.