Page 246
EXPLORING ATTRIBUTES OF STUDENT SATISFACTION PERCEPTION OF E-LEARNING MEDICAL TERMINOLOGY COURSES
Miervaldis Karulis, Ināra Ābelīte
Language Center, Rīga Stradiņš University, 16 Dzirciema Street, Riga, LV 1007, Latvia
Abstract
Educators worldwide are searching for integrating e-learning systems into all study programmes, while fully respecting student’s interests and satisfaction. One of the solutions is blended learning, which includes both face-to-face and online learning, extending opportunities of exploiting various methods of learning/teaching, scheduling, modes of delivering and guidance. This study was dedicated to exploration of student perception of satisfaction of e-learning. The aim was to evaluate student satisfaction attributes (objective and subjective) in the blended learning setting of the study courses: Medical Terminology in Latin and English and to reveal homogenous groups of students of different study programmes Dentistry, Medicine, Nursing, Occupational Therapy, Physiotherapy and Public Health with respect to their satisfaction of e-learning at Rīga Stradiņš University. A cross-sectional study was carried out involving 418 students in December, 2018 and January, 2019. The survey comprised 6 domains: information quality, system quality, service quality, use, user satisfaction and net benefits. Satisfaction attributes (10) were evaluated according to students’ objective (fulfillment) and subjective (perception) aspects. For each attribute an index was created, which was used to reveal homogeneity of student groups. A two-step cluster analysis and non-parametric tests were performed using IBM SPSS Statistics 20. Generally, the results indicated a high rate of satisfaction of e-learning (46% - 67%), while the cluster analysis segregated 3 groups of students of different study programmes with respect to their responses. The obtained results can be taken into account when creating personalized e-learning courses for students of particular study programmes.
Keywords: e-learning, b-learning, satisfaction, perception, cluster analysis, medical terminology
1. INTRODUCTION
The 21st century has set new demands in the field of education. It calls for new teaching methods making the study process more advanced and more efficient. It requires a new style of teaching or instruction both at secondary and tertiary educational levels. It requires a new and progressive teacher in the classroom, taking into account competent, skillful, internet-”addicted” students. Learning Management Systems (LMS) have been extensively used in higher education institutions for the last two decades. LMS involve learning platforms that effectively use Information and Communication Technology, among which MOODLE is one of the most popular. These learning platforms are an integral part of distance learning. Besides they have been successfully incorporated in blended learning (b-learning) or partially online courses providing a choice of learning style. Online education or e-learning has led to significant changes in how students learn and how they are taught. Mahande and Jasruddin [1] define E-learning as a dynamic learning environment through the use of the Internet to improve the quality of learning.
Higher education policy makers worldwide are focusing on integrating e-learning systems into all study programs, while fully respecting student’s interests and satisfaction. Rīga Stradiņš University is the third leading university in Latvia, offering study programmes in the field of medicine and health care. The teaching staff of Language Center of Rīga Stradiņš University have been implementing b-learning in several courses of Medical Terminology in the e-b-learning environment (MOODLE) for the last three years, hence, an increased interest in achieving higher levels of student satisfaction with e-learning.
Page 247
and to reveal homogenous groups of students of different study programmes and courses. The findings of the study should be taken into consideration when improving e-learning courses for particular groups of students.
2. E-LEARNING MODELS AND SATISFACTION
In 1989, Davis [2] propounded the Technology Acceptance Model (TAM), which is based on 4 factors: perceived usefulness, ease of use, attitudes, and intention regarding user acceptance of technology. TAM has been widely accepted among researches.
Much research has been conducted on student satisfaction with e-learning in attempt to find its influencing factors. Satisfaction becomes key for its success. The Latin word ”satis” means sufficiently, well enough and adequately. According to Sary and Herlambang [3] ”satisfaction is a pleasant or unpleasant emotional state that is displayed in a positive attitude toward various activities and responses to the external environment”, or Zaheer, Babar, Gondal and Qadri [4] define satisfaction ”as a person’s attitude or feelings associated with various factors that are affecting a particular situation”. In the educational setting, Avgerinou [5] points out that satisfaction is ”the perceived value of the learner with educational experiences”, but the authors in [4] considers students’ satisfaction as ”perception developed from the perceived value of education and experience gained”. As a result, satisfaction can lead to students’ higher motivation, engagement, and success.
TAM and its modifications have been extensively used in measuring satisfaction of e-learning, for instance, Zaili, Moi, Yusof, Hanfi and Suhaimi [6] examine the influencing factors, Sunkara and Kurra [7] focus on the personalization factors of e-learning and Roach and Lemasters [8] deal with the level of satisfaction with e-learning in comparison to traditional one. For e-learning satisfaction research, the authors of [9, 10] describe the application of the Kano Model, which involves two aspects of the attribute: an objective (fulfillment) and subjective (perception of satisfaction). To identify critical elements of b-learning the researches of [9] use five attributes: system quality, service quality, information quality, use and net benefit.
3. MATERIALS AND METHODS
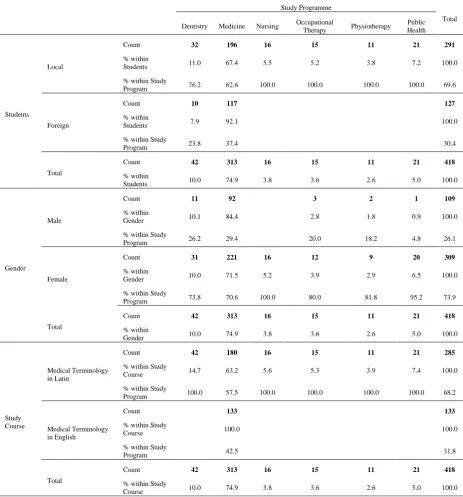
To evaluate student satisfaction and perception of e-learning, a cross-sectional study was carried out in December, 2018, and January, 2019 at Rīga Stradiņš University, when 418 local and foreign students of the first and second study year of the study programmes of Dentistry, Medicine, Nursing, Occupational Therapy, Physiotherapy and Public Health (Table 1) were interviewed using the questionnaire, comprising a list of 10 statements with 5 multiple categorical answers (a respondent had to choose only one of them) (Table 2) and an open-ended comment. The slightly modified statements were borrowed from the study in [9], but the survey procedure was simplified by abandoning the Kano two-dimensional model, which caused difficulties for respondents to be ”consistent” in giving answers resulting in a low response rate [9]. To find out homogeneity of student groups, a cluster analysis and statistical tests were performed. The descriptive and inferential assessment of students’ responses, two-step cluster procedure and tests were processed using IBM SPSS Statistics 20 (a significance level of 95%).
Page 248
Table 1. Demographic profile of the students. Study Programme
Total Dentistry Medicine Nursing Occupational
Therapy Physiotherapy
Public Health
Students
Local
Count 32 196 16 15 11 21 291
% within
Students 11.0 67.4 5.5 5.2 3.8 7.2 100.0
% within Study
Program 76.2 62.6 100.0 100.0 100.0 100.0 69.6
Foreign
Count 10 117 127
% within
Students 7.9 92.1 100.0
% within Study
Program 23.8 37.4 30.4
Total
Count 42 313 16 15 11 21 418
% within
Students 10.0 74.9 3.8 3.6 2.6 5.0 100.0
Gender
Male
Count 11 92 3 2 1 109
% within
Gender 10.1 84.4 2.8 1.8 0.9 100.0
% within Study
Program 26.2 29.4 20.0 18.2 4.8 26.1
Female
Count 31 221 16 12 9 20 309
% within
Gender 10.0 71.5 5.2 3.9 2.9 6.5 100.0
% within Study
Program 73.8 70.6 100.0 80.0 81.8 95.2 73.9
Total
Count 42 313 16 15 11 21 418
% within
Gender 10.0 74.9 3.8 3.6 2.6 5.0 100.0
Study Course
Medical Terminology in Latin
Count 42 180 16 15 11 21 285
% within Study
Course 14.7 63.2 5.6 5.3 3.9 7.4 100.0
% within Study
Program 100.0 57.5 100.0 100.0 100.0 100.0 68.2
Medical Terminology in English
Count 133 133
% within Study
Course 100.0 100.0
% within Study
Program 42.5 31.8
Total
Count 42 313 16 15 11 21 418
% within Study
Course 10.0 74.9 3.8 3.6 2.6 5.0 100.0
4. RESULTS
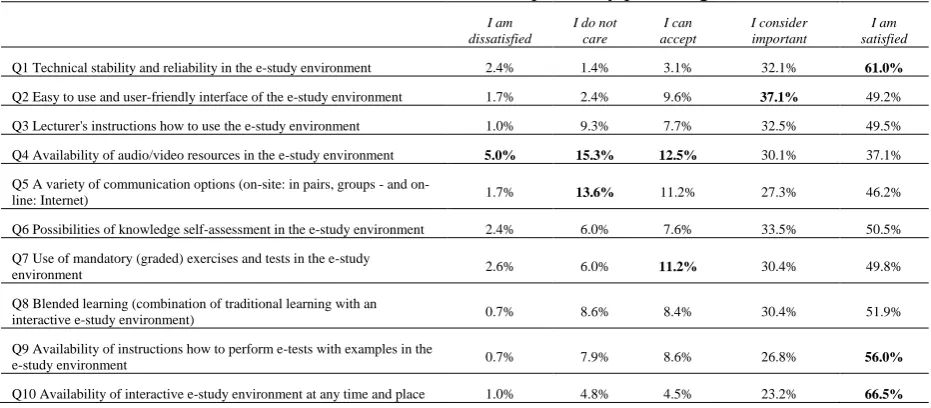
Most of the students (>50%) (Table 2) were satisfied with the availability of interactive e-study environment at any time and place, its technical stability and reliability as well as the availability of instructions how to perform e-assignments.
The response ”I consider important” received the highest frequency for the attribute of easy to use and
user-friendly interface of the e-study environment, but the least for availability of interactive e-study environment at any time and place. The students’ perception of availability of audio/video resources and use of mandatory (graded) exercises and tests in the e-study environment received ”I can accept”.
The response ”I do not care” was given more frequently to availability of audio/video resources in the
Page 249
environment, but least satisfied with availability of instructions how to perform e-tests with examples in the e-study environment and instructions how to perform e-tests with examples in the e-study environment.
Table 2. Distribution of students’ responses by percentage. I am
dissatisfied
I do not care
I can accept
I consider important
I am satisfied
Q1 Technical stability and reliability in the e-study environment 2.4% 1.4% 3.1% 32.1% 61.0%
Q2 Easy to use and user-friendly interface of the e-study environment 1.7% 2.4% 9.6% 37.1% 49.2%
Q3 Lecturer's instructions how to use the e-study environment 1.0% 9.3% 7.7% 32.5% 49.5%
Q4 Availability of audio/video resources in the e-study environment 5.0% 15.3% 12.5% 30.1% 37.1%
Q5 A variety of communication options (site: in pairs, groups - and
on-line: Internet) 1.7% 13.6% 11.2% 27.3% 46.2%
Q6 Possibilities of knowledge self-assessment in the e-study environment 2.4% 6.0% 7.6% 33.5% 50.5%
Q7 Use of mandatory (graded) exercises and tests in the e-study
environment 2.6% 6.0% 11.2% 30.4% 49.8%
Q8 Blended learning (combination of traditional learning with an
interactive e-study environment) 0.7% 8.6% 8.4% 30.4% 51.9%
Q9 Availability of instructions how to perform e-tests with examples in the
e-study environment 0.7% 7.9% 8.6% 26.8% 56.0%
Q10 Availability of interactive e-study environment at any time and place 1.0% 4.8% 4.5% 23.2% 66.5%
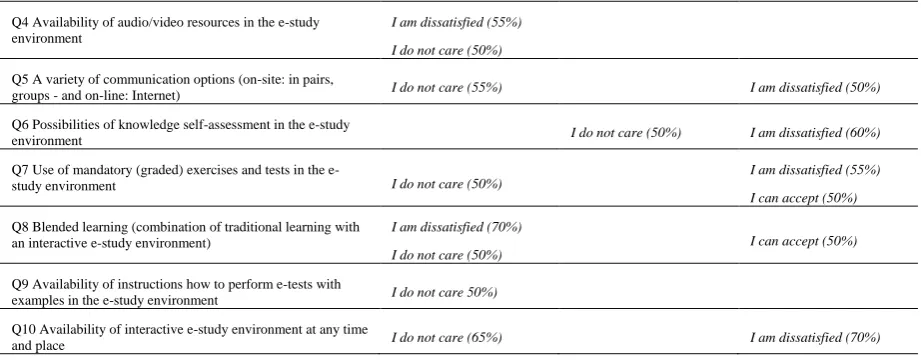
The two-step cluster analysis was conducted to find out whether there are different groups of students with similar satisfaction and perception. Three clusters (Table 3) were segregated using the attributes as evaluation fields. The segregation yielded in the silhouette coefficient (within the range of 0.5 – 1.0) measuring both a good cohesion and separation with the outlier treatment of 8%.
To better highlight the differences between clusters, Table 3 shows only the percentage above 50, which describes the distribution of responses among clusters. Most of the responses ”I am dissatisfied”
and ”I do not care” were given by the foreign students (cluster 1) who studied the course ”Medical
Terminology in Latin”. The exception was the attribute Q6, for which the highest response "I am satisfied" rate was given within this cluster and 30% among the clusters. The local students were segregated between two clusters according to the study courses. In cluster 3, the response “I am dissatisfied” dominated for the attributes Q5, Q6, Q7 and Q10. In cluster 2, the responses varied (for
each attribute less than 50%), except for the attribute Q2, for which the response "I am dissatisfied" was the most frequent (45%) among clusters.
Table 3. Distribution of students’ responses among clusters. Cluster 1
29.7%
Cluster 2 33.5%
Cluster 3 36.8%
Students Foreign 100% Local 50% Local 50%
Gender Male 50%, Female 25% Female 45% Male 50%, Female 30%
Study Programme Medicine 35% All Medicine 50%
Study Course Latin 50% Latin 50% English 100%
Q1 Technical stability and reliability in the e-study environment
I am dissatisfied (80%)
I do not care (50%)
I can accept (50%)
Q2 Easy to use and user-friendly interface of the e-study
environment I do not care (55%)
Page 250
Q4 Availability of audio/video resources in the e-study environment
I am dissatisfied (55%)
I do not care (50%)
Q5 A variety of communication options (on-site: in pairs,
groups - and on-line: Internet) I do not care (55%) I am dissatisfied (50%)
Q6 Possibilities of knowledge self-assessment in the e-study
environment I do not care (50%) I am dissatisfied (60%)
Q7 Use of mandatory (graded) exercises and tests in the
e-study environment I do not care (50%)
I am dissatisfied (55%)
I can accept (50%)
Q8 Blended learning (combination of traditional learning with an interactive e-study environment)
I am dissatisfied (70%)
I do not care (50%)
I can accept (50%)
Q9 Availability of instructions how to perform e-tests with
examples in the e-study environment I do not care 50%)
Q10 Availability of interactive e-study environment at any time
and place I do not care (65%) I am dissatisfied (70%)
Table 4. Mann-Whitney U test results on differences in responses between students groups, gender and study courses (p-values, asymp. sig., 2-tailed).
I am dissatisfied I do not care I can accept I consider important I am satisfied
Students (local, foreign) 0.012 0.000 0.157 0.008 0.000
Gender 0.179 0.034 0.332 0.392 0.015
Study Course 0.327 0.003 0.513 0.542 0.222
Table 5. Mann-Whitney U test results on differences between two study programmes (p-values, asymp. sig., 2-tailed).
I am satisfied Dentistry Medicine Nursing Occupational Therapy Physiotherapy
Medicine 0.015
Nursing 0.446 0.394
Occupational Therapy 0.460 0.387 0.968
Physiotherapy 0.791 0.382 0.765 0.917
Public Health 0.002 0.088 0.033 0.037 0.128
Table 6. Mann-Whitney U test results on differences between two study programmes (p-values, asymp. sig., 2-tailed).
I can accept Dentistry Medicine Nursing Occupational Therapy Physiotherapy
Medicine 0.195
Nursing 0.496 0.953
Occupational Therapy 0.178 0.557 0.711
Physiotherapy 0.105 0.029 0.078 0.019
Public Health 0.006 0.020 0.140 0.232 0.004
In order to assess whether there were differences between student groups, study programs and courses on the one hand and the frequency of the respective response on the other hand, the index for each attribute was introduced, which was expressed as a percentage of one-type given response on all attributes by each respondent. Table 4. summarizes the Mann-Whitney U test results of p-values, which indicates a statistically significant (p<0.05) difference in almost all responses, except ”I can accept”, between local and foreign students. Statistically significant differences also exist between
student groups, genders and study courses with respect to the response ” I do not care”. In Table 5,
Page 251
programmes: Dentistry – Medicine, Dentistry – Public Health, Public Health – Nursing and Public Health – Occupational Therapy with respect to the response ” I am satisfied ”. In Table 6, p-values
indicate statistically significant differences between the students of the following study programmes: Dentistry – Public Health, Medicine – Physiotherapy, Medicine – Public Health, Occupational Therapy – Physiotherapy and Physiotherapy – Public Health with respect to the response ” I can accept ”. No statistically significant differences were confirmed among the students with respect to the
rest of responses.
5. DISCUSSION
The student satisfaction rate was around 50% and above (Table 2) for almost all the attributes; the students were more satisfied with the delivery aspects of those courses than the content aspects, which was stated by Roach and Lemasters [8]. Each attribute contributed differently to satisfaction, which is in line with several other studies [1, 3, 4, 6, 8, 11, 12, 13, 14]. For instance, Strong, Irby, Wynn and McClure [11] and Cole, Shelley and Swartz [13] found that the most cited reason for satisfaction – convenience; for dissatisfaction – lack of interaction. The findings of the authors in [4]showed that students (more than 21,000 respondents in the study) were highly satisfied by the e-learning education; highest score – instructor support, lowest score – tutorial support. Sary and Herlambang [3] noticed a positive correlation between student satisfaction and the effectiveness (target achievement, adaptability, satisfaction and responsibility) of the implementation of the e-learning, which corresponds to the results of the present study (mostly related to the response “I consider important”).
The attribute of availability of audio/video resources in the e-study environment is contradictory for it received the highest response rates of “I do not care” and ” I am dissatisfied”. This coincides with the results of the study [8] and can be attributed as content weakness. However, the response “I do not care” may imply that these resources are abundantly available in other sources. The same can be addressed to communication options.
Considering that the differences between the response frequencies for ”I am satisfied”-”I consider
important” and ”I consider important”-”I can accept” are practically the same and fall within the range of 18% - 22% for such attributes as Q1, Q8 and Q7, it can be concluded that these attributes are evaluated by students as the key factors of b-learning. For the same reason of similar response frequencies for “I do not care”-” I am dissatisfied” (0.7% - 7.2%), one can assume that both the attributes Q2 and Q9 are treated negatively by those students who do not succeed in b-learning.
The authors of the present study did not find any research performed on satisfaction of e-learning, using the cluster analysis, however, Bauk, Šćepanović and Kopp [9] hinted that different analytical methods in assessing the level of satisfaction should be recommended. This method can be easily used to identify groups of individuals that are similar to each other but different from others in other groups. The cluster analysis carried out in this study identified three clusters that were almost equally distributed. Surprisingly, all the foreign students in Cluster 1 were the most critical and indifferent to almost all the attributes. This fact can be consistent with Sunkara and Kurra’s [7] findings, which revealed the need for personalized and more adaptive and customized e-learning systems with possible support to satisfy the needs of learners including learning styles. Cluster 2 included local students who chose all the responses almost equally to all the attributes, but for the attribute Q6 the response ”I do not care” dominated in this cluster. Possibly, each of those students could have different experience in b-learning, therefore not paying so much attention to self-assessment resources provided in e-study environment. The students of Cluster 3 seem to be more dissatisfied with the crucial aspects of e-learning, but they could accept the attributes Q1, Q7 and Q8, which may give the impression that they were forced to accept b-learning.
The satisfaction difference among the students of different study programmes is in line with the results of cluster analysis. These statistically significant differences existed between local and foreign students, genders and study courses with respect to the response ”I do not care”, possibly suggesting
Page 252
In addition, Pham L., Limbu, Bui, Nguyen and Pham H. T. [15] found the relationship between student satisfaction and student loyalty. Besides, phychological predispositions studied by Dziuban et al. [16] played an important role suggesting that other latent factors may exist.
Students expressed their e-learning perception of the attributes proposed in the survey, mainly based on their subjective judgments, which could be expressed as both an assessment of the learning experience they acquired and their willingness to expect something useful in this type of learning process. Therefore, such a student satisfaction should be seen in two ways: positive assessments and critical reviews.
According to the University requirements, at the end of each semester, students have to give their feedback of the course. In the teaching process the feedback given by students has to be treated seriously and not to be ignored. It helps to specify the problems of the study course design, communication problems, different perception levels of students, language barriers, workload, likes and dislikes of the course studied, etc.
It is clear that students’ requirements not always agree with those of the teaching staff. Nevertheless, even if the comments are negative, they have to be critically studied.
6. CONCLUSIONS
Statistical analysis of students’ answers showed a wide spectre of different opinions and proved that student satisfaction has become an important component of quality assurance of the course taught and knowledge acquired. Higher education sector is also becoming a competitive part of market and satisfied students are the future “customers” in business, medicine, social field, etc. Student satisfaction is also important for academic success, therefore the task of the universities is to look for ways how to improve the satisfaction of students and satisfy their needs in future.
1. Students considered the following attributes as the most satisfying: availability of the e-learning environment at any time and place, its technical stability and reliability and instructions of its usage, but as the least satisfying – a variety of communication options and availability of audio/video resources since they are available in internet applications and forums.
2. Most of the students of the study course “Medical Terminology in Latin” (Cluster 1) considered the attributes in the following decreasing order: Q3-Q9-Q6-Q5-Q7-Q1-Q2-Q4-Q8-Q10, which indicates their greater demand (must-be) for these attributes of this order.
3. Most of the students of Cluster 2 and Cluster 3considered the attributes in the same order, which indicates their greater satisfaction (attraction) with these attributes.
4. The study had some limitations: the Kano two-dimensional model was not used due to a complex understanding to provide answers and the number of satisfaction attributes was reduced to 10 for the same reason. Hence, some attractive satisfaction attributes were lost.
5. Statistically significant differences between local and foreign students, genders and study courses with respect to several responses on satisfaction of e-learning were proved.
6. Statistically significant differences between students of several study programmes with respect to several responses on satisfaction of e-learning were proved.
7. It is necessary to explore continuously the stability of student satisfaction attributes of e-learning for they have an increasing impact on competitiveness in higher education.
Analyzing students’ comments more in detail, there were highlighted some of their expectations/suggestions, such as:
- to improve the study course structure
- to change/paraphrase some examination questions
Page 253
- to include the language course in senior study years
- the course should be reduced from 3 to 2 semesters
- to introduce more listening tasks on medical issues
- to read and analyze medical texts.
In fact, it has been a good thing to have this survey/questionnaire carried out because it had served two purposes: how to monitor teaching quality and how to help the teaching staff improve on their teaching. Student satisfaction is an indicator for their academic performance and success, while for the teaching staff it is an indicator that the course designed is appropriate for professional needs of students.
REFERENCES
1. Mahande, RD & Jasruddin 2018, ‘The Conceptual Model of User Satisfaction for E-Learning Edmodo on Undergraduate Students: A Preliminary Study’, Proceedings of the 1st International Conference on Computer Science and Engineering Technology Universitas Muria Kudus
(ICCSET), Kudus, Indonesia, pp. 658-667, viewed 29 May 2019,
<https://eudl.eu/doi/10.4108/eai.24-10-2018.2280533>.
2. Davis, FD 1989, ‘Perceived Usefulness, Perceived Ease of Use, and User Acceptance of Information Technology’, MIS Quarterly, vol. 13, no. 3, pp. 319-340, viewed 29 May 2019, <https://www.academia.edu/2036076/Perceived_usefulness_perceived_ease_of_use_and_user_ac ceptance_of_information_technology>.
3. Sary, FP & Herlambang, O 2019, ‘E-Learning Program Effectiveness on Students’ Learning Satisfaction at Telkom Unversity Bandung’, Proceedings of the 1st Economics, Law, Education and Humanities International Conference (The First ELEHIC), Padang, Indonesia, vol. 2019, pp. 271-280, viewed 29 May 2019, <https://www.researchgate.net/publication/332116951_E-learning_Program_Effectiveness_on_Students'_Learning_Satisfaction_at_Telkom_University_Ba ndung>.
4. Zaheer, M, Babar, ME, Gondal, UH & Qadri, MM 2015, ‘E-Learning and Student Satisfaction’,
Proceedings of the 9th Annual conference of Asian Association of Open Universities (AAOU),
Kuala Lumpur, Malysia, viewed 29 May 2019,
<https://www.researchgate.net/publication/295400881_E-Learning_and_Student_Satisfaction>.
5. Avgerinou, MD 2010, ‘Teacher vs. Student Satisfaction with Online Learning Experiences Based on Personality Type’, Proceedings of the 7th Pan-Hellenic Conference with International Participation, ICT in Education, University of Peloponnese, Korinthos, Greece, vol. I, pp.
223-231, viewed 29 May 2019,
<https://www.researchgate.net/publication/228812388_Teacher_vs_student_satisfaction_with_onl ine_learning_experiences_based_on_personality_type>.
6. Zaili, N, Moi, LY, Yusof, NA, Hanfi, MN & Suhaimi, MH 2019, ‘The Factors of Satisfaction on E-Learning Usage Among Universiti Malaysia Kelantan Students’, Journal of Information System
and Technology Management, vol. 4, issue 11, pp. 73-83, viewed 29 May 2019,
<http://www.jistm.com/PDF/JISTM-2019-11-03-06.pdf>.
7. Sunkara, VM & Kurra, RR 2017, ‘An Analysis of Learner Satisfaction and Needs on E-Learning Systems’, International Journal of Computational Intelligence Research, vol. 13, no. 3, pp. 433-444, viewed 29 May 2019, <https://www.ripublication.com/ijcir17/ijcirv13n3_09.pdf>.
Page 254
9. Bauk, S, Šćepanović, S & Kopp, M 2014, ‘Estimating Students’ Satisfaction with Web Based Learning System in Blended Learning Environment’, Education Research International, vol.
2014, pp. 1-11, viewed 29 May 2019,
<https://www.researchgate.net/publication/261996039_Estimating_Students'_Satisfaction_with_ Web_Based_Learning_System_in_Blended_Learning_Environment>.
10. Dominici, G & Palumbo, F 2013, ‘How to Build an E-learning Product: Factors for Student/customer Satisfaction’, Business Horizons, vol. 56, no. 1, pp. 87-96, viewed 29 May 2019,
<https://www.researchgate.net/publication/222088309_How_to_Build_an_E-Learning_Product_Factors_for_StudentCustomer_Satisfaction>.
11. Strong, R, Irby, TL, Wynn, JT & McClure, MM 2012, ‘Investigating Students’ Satisfaction with eLearning Courses: The Effect of Learning Environment and Social Presence’, Journal of Agricultural Education, vol. 53, no. 3, pp. 98-110, viewed 29 May 2019, <http://www.jae-online.org/attachments/article/1687/53.3.98%20Strong.pdf>.
12. Chandrasiri, GDTD & Jayasinghe, JN 2018, ‘Factors Affecting the User Satisfaction for E-Learning Systems’, Proceedings of the 15th International Conference on Business Management
(ICBM 2018), Colombo, Sri Lanka, pp. 1018-1031, viewed 29 May 2019,
<http://dr.lib.sjp.ac.lk/bitstream/handle/123456789/8164/Factors%20affecting%20the%20User%2 0Satisfaction%20for%20e-Learning%20Systems.pdf?sequence=1&isAllowed=y>.
13. Cole, MT, Shelley, DJ & Swartz, LB 2014, ‘Online Instruction, E-Learning, and Student Satisfaction: A Three Year Study’, International Review of Research in Open and Distance
Learning, vol. 15, no. 6, pp. 111-131, viewed 29 May 2019,
<https://www.researchgate.net/publication/279320409_Online_Instruction_E-Learning_and_Student_Satisfaction_A_Three_Year_Study>.
14. Ghazal, S, Al-Samarraie, H & Aldowah, H 2018, ‘”I am still learning”: Modeling LMS Critical Success Factors for Promoting Students’ Experience and Satisfaction in a Blended Learning Environment’, IEEE Access, vol. 6, pp. 77179-77201, viewed 29 May 2019, <https://www.researchgate.net/publication/328751422_I_am_still_learning_Modeling_LMS_Criti cal_Success_Factors_for_Promoting_Students'_Experience_and_Satisfaction_in_a_Blended_Lear ning_Environment>.
15. Pham, L, Limbu, YB, Bui, TK, Nguyen, HT & Pham, HT 2019, ‘Does E-Learning Service Quality Influence E-Learning Student Satisfaction and Loyalty? Evidence from Vietnam’, International Journal of Educational Technology in Higher Education, vol. 16, no. 7, pp. 1-26, viewed 29 May 2019, <https://www.researchgate.net/publication/331021518_Does_e-
learning_service_quality_influence_e-learning_student_satisfaction_and_loyalty_Evidence_from_Vietnam>.
16. Dziuban, C, Moskal, P, Thompson, J, Kramer, L, DeCantis, G & Hermsdorfer, A 2015, ‘Student Satisfaction with Online Learning: Is it a Psychological Contract?’, Journal of Asynchronous
Learning Network, vol. 19, no. 2, viewed 29 May 2019,