Abstract: Studies in the US, the UK and Europe found children born close to the cut-off date for the start of school year face disadvantage in terms of educational attainment. This is attributed to the fact that pupils born shortly before the cut-off date are almost a year younger than many of their classmates. They are in an earlier stage of their intellectual, emotional and physical development and are thus
relativelydisadvantaged. Differences in growth and health outcomes by birth month have been found in other studies. This paper tests whether long-term educational and health disadvantages of individuals born just before the start of school year cut-off date of July 1st exist in Northern Ireland. The analysis is based on a c.28 per cent representative population sub-sample of young people aged 12-18 in 2001 in the Northern Ireland Longitudinal Study (NILS) with linked 2001 and 2011 Census records. Findings indicate no educational or health disadvantages over a decade for individuals born in May and June.
I INTRODUCTION
B
irth month has been identified as influencing many outcomes in later life ranging from sporting prowess, through health, to educational outcomes (see below). In education, especially in the British context, the problems of lower attainment for the ‘summer-born’ with July and August birthdays have often beenDoes the Month of Birth Affect Educational and
Health Outcomes? A Population-Based Analysis
Using the Northern Ireland Longitudinal Study
Stefanie Doebler*
University of Liverpool
Ian Shuttleworth Queen’s University Belfast
Myles Gould University of Leeds
Acknowledgements: The help provided by the staff of the Northern Ireland Longitudinal Study and the NILS Research Support Unit is acknowledged. The NILS is funded by the Health and Social Care Research and Development Division of the Public Health Agency (HSC R&D Division) and NISRA. The NILS-RSU is funded by the ESRC and the Northern Ireland Government. The authors alone are responsible for the interpretation of the data and any views or opinions presented are solely those of the author and do not necessarily represent those of NISRA/NILS.
* Corresponding author: [email protected]
highlighted (DFE, 2010), with poor educational outcomes in school across a variety of social indicators. In this case, the date in England that divides the school year is September 1st. Birth month has also been associated with particular types of illness and poorer health outcomes in later life in the United States although this has been observed for people born in the winter months (Buckles and Hungerman, 2013). The existence of these differentials, usually observed in the United Kingdom in studies based on large administrative datasets such as those produced by school reporting systems or social surveys, raises questions about whether health and educational differentials can be observed across entire populations, and the relative size of these effects in comparison with other social determinants of health and educational outcomes.
This paper attempts to investigate this theme using the Northern Ireland Longitudinal Study (NILS). This is interesting for two reasons. Firstly, the NILS is a c.28 per cent sample of the Northern Ireland population and is therefore of sufficient size to permit generalisations for the entire population. It is also longitudinal – this means that it is possible to follow the fortunes of groups of people through time (here between 2001 and 2011). Unlike longitudinal cohort surveys it has low attrition rates because it is based on linking data from the successive censuses of the population rather than survey follow up at subsequent waves. Secondly, Northern Ireland is different to other parts of the United Kingdom, more particularly England and Wales. Because the Northern Ireland school year divides on July 1st rather than September 1st, the study of birth-month effects on later educational success is to some extent a natural experiment.
The school starting age is four years in Northern Ireland. Every child who reaches the age of four by the 1st July of every year should begin compulsory education at the beginning of September of the same year (Department of Education, 1989, sec. F73; Department of Education, 2016). Children who turn four after 1st July are enrolled in the following year. The text of the legislation and the parental guidance information supplied by the Department for Education do not state exceptions to this rule.1 Starting school at a later age than four is very
uncommon in Northern Ireland. Everything being equal it might be expected that birth-month disadvantage might be concentrated for those with May and June births unlike July and August births (in England). Northern Ireland therefore stands as an
1The text of the Education and Libraries (Northern Ireland) Order 1986 is the legal basis for the school
interesting case study because of this difference. The paper begins by discussing the literature on birth-month effects on health and education outcomes in the next section. It then describes and discusses the NILS dataset and the variables that are included in the analysis. After this, the results are presented and discussed, before drawing conclusions.
II LITERATURE REVIEW
There is a substantial international literature on whether (and how, and how much) the month of birth influences later life outcomes in education, health, morbidity, mortality, employment and general wellbeing. There is evidence that the month of birth shapes later life chances across a variety of domains, although the evidence is not unanimous and there remain questions as to how birth month is important; whether it is the age of starting school, age at testing, relative age of children in the year cohort, exposure to environmental factors, or socio-economic differentials in the timing of planned births through the year that matter. Outside the direct focus of this paper, but worthwhile noting nevertheless, is the pervasive influence of birth month on sporting success (Bell and Daniels, 1990; Ponzo and Scoppa, 2014; Wattie
et al., 2007; Helsenet al., 2005) across a variety of countries and a diverse range of sports.
Hyperactivity Disorder (ADHD) was noted in another study (Bolandet al., 2015) to be diagnosed for children born at the end of the academic year with higher rates for November and December births in Sweden and also New York State (which also has an academic year that ends on the last day of December).
There is less consensus about the long-term influence of birth month and, in particular, relative within-year age effects. Wright (2015) found that birth month had little influence on entrance to higher education and the type of university entered and, as was seen above, birth-month effects appeared to diminish with increasing age. Crawfordet al. (2013; 2014) also note little evidence of significant effects on labour market outcomes; these authors did question, however, whether they would find statistically significant differentials if they had data for the whole population or a substantial portion of it, although they argue that the diminution of birth-month effects with increasing age is not implausible. On the other hand, Bell and Daniel (2010) note that a persistent disadvantage is associated with the month of birth; and there have been other findings that children born at the end of the school year tend to earn less (Kawaguchi, 2011) and are less likely to occupy high-level occupations such as Chief Executive Officers (CEOs) (Duet al., 2012).
It has been observed (Montez and Friedman, 2015) that the relationship between educational attainment and health and longevity is one of the most robust seen in the social sciences. Individuals with poorer educational outcomes tend to have poorer health and live shorter lives. This statement would be enough, in itself, to focus attention on birth month and later health outcomes given the strong possibility that the educational performance of those born later in the academic year is worse than for individuals born earlier. Everything else being equal it might be expected that the summer-born in the UK context could have poorer general
health outcomes as might those born in May and June in Northern Ireland. The international literature thus far is inconclusive. This is at least partly caused by the fact that the school starting age varies between five and seven years across countries, and also the school year cut-offs vary. Mortensenet al. (1999) found in Denmark, where the school years starts in August, that February and March births had higher rates of schizophrenia than those born in other months, whilst Doblhammer and Vaupel (2001) found that birth month influences mortality. In the United States, where the school year cut-off varies by state, Buckles and Hungerman (2013) found multiple health disadvantages for the winter-born in comparison with those who plan births for the spring and the summer, which they attribute in part to the socio-economic status, age, and partnership status of mothers. Bolandet al. (2015) again in the US, point to the increased chance of ADHD for the winter-born, but also suggest that other months are associated with other types of illness, with March births, for example, having a statistically higher incidence of cardiac illness.
There is a substantial body of evidence that the summer-born in England and Wales experience educational disadvantage, and there is some support from other countries with different academic year dates that late born experience similar differentials. Secondly, are the summer-born in Northern Ireland more likely to experience poorer health outcomes than individuals born at other times of year? Given the link between educational outcomes and health noted above, there is a plausible mechanism which might indicate that the summer-born could also have poorer health. In the Northern Ireland context, where the academic year runs July 1st-June 30th, it is expected that the main disadvantage will be felt by those born in May and June – unlike in England and Wales where the birth-month disadvantage is considered to be for those born in July and August. An important caveat to these first two questions, however, concerns the likelihood that birth-month educational differentials diminish with increasing age, falling from primary school to less than one percentage point (Crawfordet al., 2013) at entry to higher education. A third question, therefore, seeks to examine whether educational and health differentials are apparent for the adult population at ages where the respondents could have completed A-Levels and university-level education. The analysis presented below sets out to explore these questions using cohorts of NILS members aged 12-18 in 2001 and 22-28 in 2011, although analysis was also undertaken for those aged 24-28 in 2011 as a robustness check.
III DATA
The analysis is based on a subset of data drawn from the Northern Ireland Longitudinal Study (NILS). The NILS is a representative sample of c.28 per cent of the population of Northern Ireland and was drawn from records from the Northern Ireland Health Card Registration system (NIHCR), based on 104 random birthdates out of the 365 possible which are then linked to census and other administrative data sources. These birth dates are confidential and so NILS members are anonymous. The NILS members in our study were subsequently linked to the 2001 and 2011 Census returns in a secure environment by a trusted third party(Johnston et al., 2010).2Data on the birth months of all NILS members, as
captured by birth registration data, were made available together with their self-reported educational qualifications and health status from the census. We concentrate the analysis on a subset of the NILS which included all members (N=36,087), who were born between 1983 and 1989. The respondents were thus 12 to 18 years old at the time of the 2001 Census and subsequently 22 to 28 years
old in 2011. The 2011 NILS-Census linkage provided self-reported data on educational qualification and health, whereas data from the 2001 Census-link provided contextual information on their household circumstances ten years earlier. Access to these microdata was provided in the ‘safe-setting’ of a secure data laboratory located within the Northern Ireland Statistics and Research Agency (NISRA), subject to stringent confidentiality undertakings and under close supervision.
The analysis only uses the variables that are available from the census. In practice, this means that there are relevant data available on individual characteristics such as age, gender, educational qualifications, economic activity, occupation, and health conditions. There are also household-level data available including housing tenure and measures of household employment, health, and educational deprivation calculated by NISRA and we use these as summaries of household conditions as of 2001, and thus appropriate measures of the social and economic conditions of the young people in the sample for whom many census variables (e.g. education and economic activity) were not collected because of their age.
It is also possible to allow for the level of socio-economic and housing-deprivation of individuals’ areas of residence because the Northern Ireland Index of Multiple Deprivation can be attached to the Super Output Area (SOA) of residence. SOAs in Northern Ireland typically have average populations of 2,000 and are aggregations of smaller Output Areas (OAs), which themselves are aggregations of postcode units that are combined in such a way as to maximise spatial compactness and social homogeneity (Martin, 2002). Crucially, for the analysis of the cohorts of young people, it is possible to know from the 2001 Census characteristics of other household members including marital status, economic activity and health.
that were unlikely to be confused or misremembered given the range of categories and the self-reported nature of the question.
To measure health status, the response to the question on general health was used and again this was self-reported. Respondents had a choice of five categories (very good, good, fair, bad and very bad which were coded respectively from one to five) and are combined together for some of the analysis presented (see below).
An obvious weakness is that the census is based on self-reported responses and not on data captured via an administrative system nor elicited as part of an interview process where responses can be probed or verified by the interviewer. In defence of the data, however, the information reported in the census is the only information available across a whole population and the responses do appear to have some objective reality. For example, answers to the self-rated general health questions (Mackenbachet al., 2002; Mossey and Shapiro, 1982), are closely related to later mortality with those stating they were in poor health having greater odds of dying subsequent to the census. Furthermore, in concentrating on younger people who have only recently gained qualifications there should be a far smaller chance of recall bias compared with, say a 65-year-old, who gained a qualification 40 years ago. Another strength of the analysis is that it makes use of population-level data. As such, there is information on a large number of people, and it looks at outcomes over a decade rather than the shorter periods and smaller samples which are commonly considered in the literature.
IV METHODS
The models control for sex and age in years in addition to birth month. In order to assess whether age effects occur based on the school year, we included birth year cohort dummies, which are aligned with the Northern Ireland school year cut-off date, leaving the youngest birth year out as the reference category. The birth year dummies run from 1st July until 30th June. Because the vast majority of respondents lived in the parental household in 2001, the design permitted controls for parental background using data from the 2001 Census. These include parental divorce, household tenure, and three measures of household deprivation (education, employment and health).3 The models also control for the socio-economic
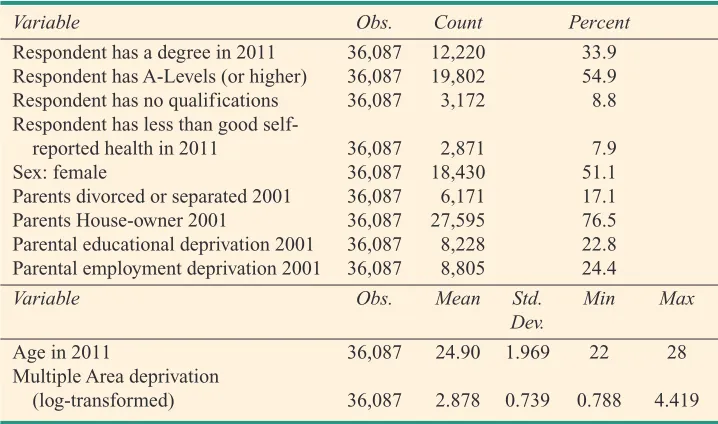
deprivation of the area in which the sample members lived in 2001, using a multiple deprivation score provided by the Northern Ireland Statistics Agency (NISRA 2010). Area deprivation is known to influence educational and other social outcomes later in life. Area of residence is defined using Super Output Areas (SOAs) which are used by census agencies for data dissemination, and are designed to be generally socially homogeneous, comparable in terms of population size and over time (Martin, 2002). Tables 1 and 2 contain the summary statistics for the independent variables included in the analysis. These are discussed in the following results section.
IV RESULTS
Table 1 contains the frequency distributions of respondents born in each month of the year. The table shows that the sample is evenly distributed by the month of birth and confirms that statistical comparisons are appropriate and that there is no systematic bias in this respect. The highest proportion of births were in June at 9.2 per cent, the lowest at 7.4 per cent in December. Table 2 shows summary statistics for the 2011 response variables and covariates (including the 2011 household variables). About 34 per cent (N=12,220) of the study sample had a degree by 2011, 21 per cent (N=7,578) have achieved A-Levels, but not a degree, and only 9 per cent (N= 3,172) had no educational qualification in 2011. Only 8 per cent (N=2,871) of the respondents were in less than good health. In 2011 the sample mean age was 24.9, and by implication was 14.9 in 2001. In 2001, 17 per cent of the sample (N= 6,171) were in households with parents divorced or separated, 23 per cent (N= 8,228) were in educationally deprived households, and just over 24 per cent (N=8,805) were in households where neither parent was in work.
3Household deprivation are 2001 Census-based NILS variables measured for two domains: education and
Table 1: Frequency Distribution of the Analytical Sample Across Month Of Birth
Month of Birth N Percent
January 3,117 8.6
February 2,754 7.6
March 3,249 9.0
April 2,810 7.8
May 3,221 8.9
June 3,306 9.2
July 2,875 7.9
August 3,250 9.0
September 3,170 8.8
October 2,999 8.3
November 2,679 7.4
December 2,657 7.4
Total 36,087 100
Table 2: Summary Statistics for Response Variables and Covariates Used in the Analysis
Variable Obs. Count Percent
Respondent has a degree in 2011 36,087 12,220 33.9 Respondent has A-Levels (or higher) 36,087 19,802 54.9 Respondent has no qualifications 36,087 3,172 8.8 Respondent has less than good
self-reported health in 2011 36,087 2,871 7.9
Sex: female 36,087 18,430 51.1
Parents divorced or separated 2001 36,087 6,171 17.1 Parents House-owner 2001 36,087 27,595 76.5 Parental educational deprivation 2001 36,087 8,228 22.8 Parental employment deprivation 2001 36,087 8,805 24.4
Variable Obs. Mean Std. Min Max
Dev.
Age in 2011 36,087 24.90 1.969 22 28
Multiple Area deprivation
Table 3: Percentages of Respondents With a Degree and With Bad Health in 2011 By the Month of Birth
Month of Birth Respondent has a Less than good
degree in 2011 health in 2011
Percent N Percent N
January 32.15 1,002 7.80 243
February 33.08 911 7.70 214
March 33.06 1,074 7.48 243
April 35.02 984 8.08 227
May 36.11 1,163 8.26 266
June 35.69 1,180 7.92 262
July 32.97 948 8.14 234
August 33.48 1,088 7.69 250
September 33.82 1,072 8.90 282
October 33.74 1,012 7.80 234
November 32.85 880 7.80 209
December 34.10 906 7.79 207
Total (all months combined) 33.86 12,220 7.96 2,871
Chi-Squared test (11d.f.) 22.21 6.26
Cramer’s V 0.025 0.013
p-value 0.023 0.856
Table 3 shows the percentages of respondents by birth month who by the time of the 2011 Census had obtained a university degree, and also the proportions reporting bad or very bad general health. As the two months before and after the cut-off (July) can effectively be seen as being treatment and control groups, we would expect especially those born in June to be strongly significantly more disadvantaged than those born in July, who are one year older.
very small differences as statistically significant when assessed by the chi-squared test. Moreover, a Cramer’s V statistic confirms that the effect size is very weak (Table 3). With regard to self-reported bad health in 2011 for those aged 22 to 28, there are no substantially or statistically significant differences by the month of birth (as confirmed by Chi-squared and Cramer’s V statistics).
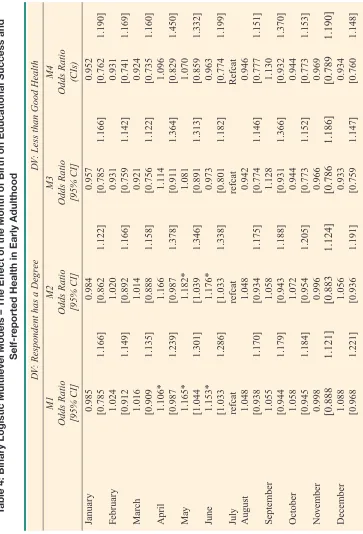
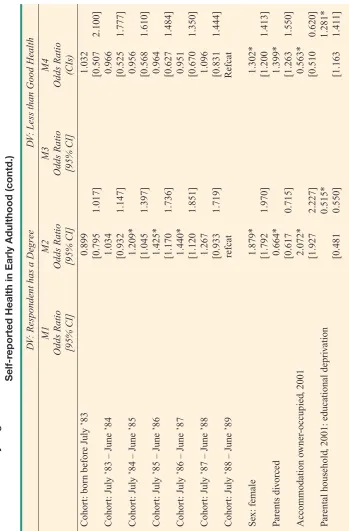
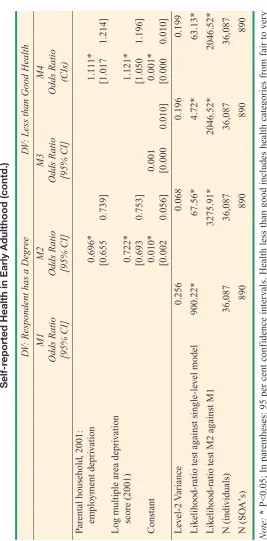
Table 4 contains four binary logistic multilevel regression models that were carried out to facilitate comparison with other studies in the literature. The left hand side of the table shows binary logistic regression multilevel models for reporting having a university degree in 2011. Model 1 includes birth month as the sole predictor and July as the reference category, whilst Model 2 includes the full set of covariates. The right hand side of Table 2 shows multilevel models for less than good (fair to bad) self-reported health using the same approach with Models 3 and 4 respectively including just birth month, and finally the full set of covariates. For each of the two outcomes, the second ‘full’ models (Models 2 and 4) control for: respondents’ sex (male is the reference category), age (in years), parental divorce/separation, and for households: 2001 tenure, as well as educational, employment and health deprivation. The coefficients for the binary logistic multilevel models are presented as odds ratios with their 95 per cent confidence intervals in parentheses.
Model 1 shows that there are some monthly variations. Contrary to expectation, sample members born in April, May and June (the youngest in the Northern Ireland academic year) are a few percentage points more– not less – likely than those born in other months to have a degree in 2011. For example, the odds of having gained a degree by 2011 of those born in May are 16 per cent higher than for those born in July, and the odds of those born in June are 15 per cent higher. However, these monthly variations are barely statistically significant. The statistical significant, but weak effect sizes for birth months April to June may well be an artefact of the exceptionally large sample size of the NILS. When looking at age effects in years, we find that the middle year cohorts tend to have a higher likelihood than the youngest and older cohorts to have a degree. However, older respondents are not more likely than the youngest ones to have obtained a degree by 2011. Once the covariates are added in Model 2, the situation with regard to birth month does not change. However, the signs and statistical significance of the control variables are very much as might be expected from other literature (see, for example, Breen and Jonsson, 2005). In particular, educational and employment deprivation of the parental household decrease the odds of having a degree, whereas home ownership of the household (relative to social and private renting households) and female sex of the respondent increase the odds of getting a degree.
T
able 4: Binary Logistic Multilevel Models – The Ef
fect of the Month of Birth on Educational Success and
Self-r
eported Health in Early Adulthood
D
V
: Respondent has a De
g
ree
D
V
: Less than Good Health
T
able 4: Binary Logistic Multilevel Models – The Ef
fect of the Month of Birth on Educational Success and
Self-r
eported Health in Early Adulthood (contd.) D
V
: Respondent has a De
g
ree
D
V
: Less than Good Health
M1 M2 M3 M4 Odds Ratio Odds Ratio Odds Ratio Odds Ratio [95% CI] [95% CI] [95% CI] (CIs) Cohor t: bor
n before Jul
y ’83 0.899 1.032 [0.795 1.017] [0.507 2.100] Cohor t: Jul
y ’83 – June ’84
1.034 0.966 [0.932 1.147] [0.525 1.777] Cohor t: Jul
y ’84 – June ’85
1.209* 0.956 [1.045 1.397] [0.568 1.610] Cohor t: Jul
y ’85 – June ’86
1.425* 0.964 [1.170 1.736] [0.627 1.484] Cohor t: Jul
y ’86 – June ’87
1.440* 0.951 [1.120 1.851] [0.670 1.350] Cohor t: Jul
y ’87 – June ’88
1.267 1.096 [0.933 1.719] [0.831 1.444] Cohor t: Jul
y ’88 – June ’89
refcat Refcat Se x: female 1.879* 1.302* [1.792 1.970] [1.200 1.413] P arents di v orced 0.664* 1.399* [0.617 0.715] [1.263 1.550] Accommodation o wner -occupied , 2001 2.072* 0.563* [1.927 2.227] [0.510 0.620] P arental household
, 2001: educational depri
T
able 4: Binary Logistic Multilevel Models – The Ef
fect of the Month of Birth on Educational Success and
Self-r
eported Health in Early Adulthood (contd.) D
V
: Respondent has a De
g
ree
D
V
: Less than Good Health
M1 M2 M3 M4 Odds Ratio Odds Ratio Odds Ratio Odds Ratio [95% CI] [95% CI] [95% CI] (CIs) P arental household , 2001: emplo yment depri v ation 0.696* 1.111* [0.655 0.739] [1.017 1.214] Lo
g multiple area depri
v ation score (2001) 0.722* 1.121* [0.693 0.753] [1.050 1.196] Constant 0.010* 0.001 0.001* [0.002 0.056] [0.000 0.010] [0.000 0.010] Le v el-2 V ariance 0.256 0.068 0.196 0.199 Lik
elihood-ratio test against single-le
v el model 900.22* 67.56* 4.72* 63.13* Lik
elihood-ratio test M2 against M1
3275.91* 2046.52* 2046.52* N (indi viduals) 36,087 36,087 36,087 36,087 N (SO A’s) 890 890 890 890 Note: *
P<0.05; In parentheses: 95 per cent conf
idence inter
v
als. Health less than good includes health cate
gories from f
air to v
er
y
are no substantially or statistically significant month of birth effects in either the uncontrolled model (M3) or the controlled model (M4). Also, age in school year cohorts has no effect on the respondents’ self-reported health in later life. The effects of the control variables are, as expected, statistically significantly related to poor self-reported health later in life: being female, having been exposed to educational, employment and health deprivation in the parental household earlier in life, and area-deprivation, are all positively related to self-reported less than good health ten years later as an adult.
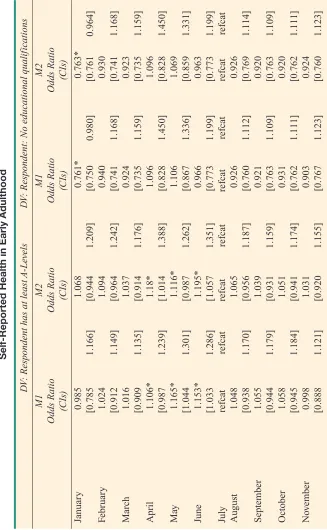
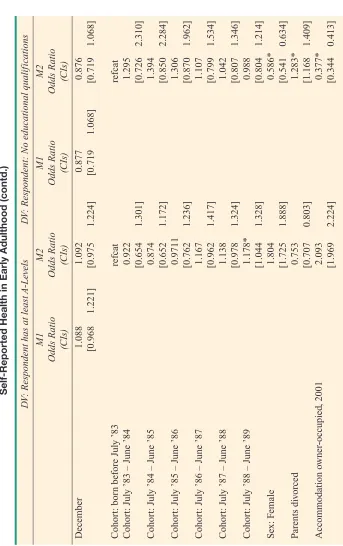
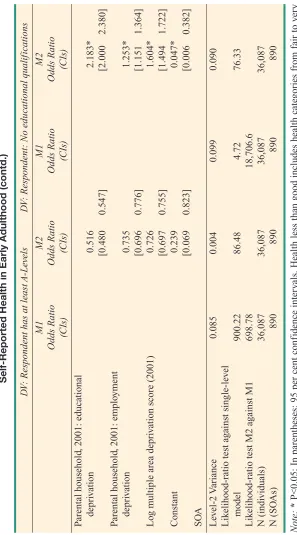
We undertook the same models for having obtained at least A-Levels and for having no qualifications at all in 2011. These models showed no systematic birth-month effects in the expected direction and corroborated the findings for degree-level qualifications and self-reported health in general. The model with having at least A-Levels as the dependent variable mirrors the results for having a degree, and for having no qualification, only the January-born are slightly less likely to have no qualification than the other birth months. We do not present these findings here for reasons of space. These models are supplied in Table 5 in the Appendix to this paper.
V DISCUSSION AND CONCLUSION
This paper sought to test whether relative age, an individual’s month of birth within school year cohorts, influenced later educational success and health. There is evidence in the literature that relative age within school year has an influence on later educational outcomes (Crawfordet al., 2013) albeit with a diminishing effect with increasing age. There is also evidence for a birth-month effect that goes beyond this with specific medical conditions being related to certain months of birth and sporting prowess and income amongst other themes all being related to seasonal birth factors (see, for example, Buckles and Hungerman, 2013). It should be noted that education is also known to have an influence on health with poorer health being associated with poorer education. This suggests that there are potentially at least two separate processes in play with relative age within school year having an impact on educational outcomes, but other factors associated with birth month and season influencing other aspects such as health.
decreased the chances of having a degree by 2011, for instance. However, no expected birth-month effect was detected despite the large numbers in the study increasing the likelihood of finding even a small effect. Similarly, Wright (2015), finds no significant relationship between term of birth (i.e. season) and probability of attending university in a multilevel analysis of Universities and Colleges Admissions Service (UCAS) data. Other factors, such as parental divorce and socio-economic deprivation were far more influential. Similarly, no birth-month effects were observed for general health in 2011 although socio-economic effects of the expected sign were seen. Some studies from other contexts (Buckles and Hungerman, 2013) found a tendency among parents of higher socio-economic status to plan when to give birth. This would allow parents to thereby avoid the summer months. Theoretically, this could bias study results. However, the fact that the distributions of birth months in the NILS data is very balanced and unrelated to parental educational advantage, as Table 1 and Table 6 (Appendix) demonstrate, gives us confidence that this is not a noticeable phenomenon in Northern Ireland and has not biased our results.
The results with regard to attainment in higher education are perhaps not so surprising, given findings by other authors (Campbellet al., 2013) that the effect of relative age within year decreases as individuals progress to higher education. It might be that by the time higher education is ended, as in this analysis, and individuals are in their twenties, the earlier patterns of disadvantage have been washed out or swamped by broader social and economic drivers of educational attainment. Many studies that have detected birth-month effects in education are based on survey or administrative data collected as part of schooling. They use test scores and panel data with shorter intervals between time-points, measured during secondary schooling. The waves are aligned with the national regime of student testing and more frequent monitoring in contrast to the ten-year age band used by the NILS. These studies have been designed to detect different shorter-term effects on educational attainment within school contexts. These differences might well exist within Northern Ireland schools too, but cannot be picked up with the NILS data and are a limitation of this analysis.
qualification by other routes, for example through the further education sector and distance learning (including the Open University), mean that by the time adulthood is reached small earlier differences in attainment have been equalised.
The null result with regard to health is noted but is harder to explain given some of the effects noted in large epidemiological studies such as those undertaken in the US (eg Buckles and Hungerman, 2013), but might be attributed to some of the limitations of our analysis. Nevertheless, the NILS is an exceptionally large dataset, allowing for the analysis of a cohort representative of the population of Northern Ireland aged 12 to 18 in 2001 and subsequently 22 to 28 in 2011. Given its large sample size, even very small differences by the month of birth of individuals should have been picked up by our data. The conclusion must be either that these differences do not exist at an observable level for young people, or that the census general health question is a relatively blunt instrument. It cannot, for instance, provide detailed information on the specific health conditions discussed in the Danish and United States studies reviewed earlier. Despite this, the general health question is able to provide reliable information, since it was found to be strongly related to objective health conditions and mortality outcomes (Mackenbachet al., 2002; Mossey and Shapiro, 1982). Furthermore, in line with other studies (Woods
et al., 2005; Doebler and Glasgow, 2016), we found socio-economic and area-level deprivation indicators to be strongly related to less than good reported health. The findings therefore cannot be discounted and the observation that there is no long-term health disadvantage for the summer-born, or indeed those born at other times of the year, is therefore interesting and noteworthy.
The analysis does not rule out earlier educational effects during schooling but the NILS cannot address these issues. Instead, administrative data from primary, secondary and grammar schools on educational attainment, birth month and the other economic and social covariates of performance are required using other microdata linkage approaches to consider fully the potential importance of birth month in Northern Ireland. Further analysis might also detect similar patterns with regard to health in Northern Ireland to those noted in other jurisdictions but this again will require further linkage of other data from health administrative data systems from which more finely grained information may be available in the future.
REFERENCES
Ashworth, John and Bruno Heyndels, 2007. “Selection Bias and Peer Effects in Team Sports – The Effect of Age Grouping on Earnings of German Soccer Players”, Journal of Sports Economics Vol. 8, No. 4, pp. 355-377. doi:10.1177/1527002506287695.
Breen, Richard and Jan O. Jonsson, 2005. “Inequality of Opportunity in Comparative Perspective: Recent Research on Educational Attainment and Social Mobility”, Annual Review of Sociology (2005), pp. 223-243.
Buckles, K. and D. Hungerman, 2013. “Season of Birth and Later Outcomes: Old Questions, New Answers”, The Review of Economics and Statistics, Vol. 95, No. 3, pp.711-724
Boland M. R., Z. Shahn, D. Madigan, G. Hripcsak and N.P. Tatonetti, 2015. “Birth Month Affects Lifetime Disease Risk: A Phenome-Wide Method”, Journal of the American Medical Informatics Association, 2015; 0:1-15. doi:10.1093/jamia/ocv046
Campbell, Tammy, 2013. “School Ability Grouping and the Month of Birth Effect. Preliminary Evidence from the Millennium Cohort Study”, Working paper 2013/1, London: Institute for Education.
Campbell, Tammy, 2014. “Stratified at Seven: In-Class Ability Grouping and the Relative Age Effect”, British Educational Research Journal, Vol. 40, No. 5, pp. 749-771. doi:10.1002/berj.3127. Crawford, Claire, Lorraine Dearden and Costas Meghir, 2007. When You Are Born Matters. The Impact
of Date of Birth on Child Cognitive Outcomes in England, London: Centre for the Economics of Education, London School of Economics.
Crawford, Claire, Lorraine Dearden and Costas Meghir, 2010. “When You Are Born Matters: The Impact of Date of Birth on Educational Outcomes in England”, IFS working papers, 10,06. http://www.econstor.eu/handle/10419/47462, pp. 1-30.
Crawford, Claire, Lorraine Dearden and Ellen Greaves, 2013. “When You Are Born Matters: The Impact of Date of Birth on Educational Outcomes in England”, IFS report R80, London: Institute for Fiscal Studies, pp. 1-80.
Crawford, Claire, Lorraine Dearden, and Ellen Greaves, 2014. “The Drivers of Month-of-Birth Differences in Children’s Cognitive and Non-Cognitive Skills”, Journal of the Royal Statistical Society: Series A (Statistics in Society), Vol. 177, No. 4, pp. 829-860. doi:10.1111/rssa.12071. Daniels, Sandra, Diane Shorrocks-Taylor and Edwin Redfern, 2000. “Can Starting Summer-Born
Children Earlier at Infant School Improve Their National Curriculum Results?”, Oxford Review of Education, Vol. 26, No. 2), pp. 207-220. doi:10.1080/713688530.
Department of Education, 1989. The Education and Libraries (Northern Ireland) Order 1986. http://www.legislation.gov.uk/nisi/1986/594.
Department of Education, 2016. “Compulsory School Age. Details of When a Child Must Start and May Leave Compulsory Education”, https://www.education-ni.gov.uk/articles/compulsory-school-age.
Department for Education (DFE), 2010. Month of Birth and Education, Research Report DFE-RR017, Schools Analysis and Research Division, Department for Education, London, https://www.gov.uk/government/uploads/system/uploads/attachment_data/file/182664/DFE-RR017.pdf (accessed June 21st 2016).
Dhuey, Elizabeth and Stephen Lipscomb, 2008. “What Makes a Leader? Relative Age and High School Leadership”, Economics of Education Review, 27 (2): 173–83. doi:10.1016/j.econedurev. 2006.08.005.
Dhuey, Elizabeth and Stephen Lipscomb, 2010. “Disabled or Young? Relative Age and Special Education Diagnoses in Schools”, Economics of Education Review,Vol. 29, No. 5, pp. 857-872. doi:10.1016/j.econedurev.2010.03.006.
Doblhammer, Gabriele and James W. Vaupel, 2001. “Lifespan Depends on Month of Birth”,
Proceedings of the National Academy of Sciences, Vol. 98, No. 5, pp. 2934-2939.
doi:10.1073/pnas.041431898.
Du, Qianqian, Huasheng Gao and Maurice D. Levi, 2012. “The Relative-Age Effect and Career Success: Evidence from Corporate CEO”, Economics Letters,Vol. 117, No. 3, pp. 660-662. doi:10.1016/j.econlet.2012.08.017.
Fredriksson, Peter and Bjorn Ockert, 2005. “Is Early Learning Really More Productive? The Effect of School Starting Age on School and Labor Market Performance”, SSRN Scholarly Paper ID 760728. Rochester, NY: Social Science Research Network. http://papers.ssrn.com/abstract= 760728.
Helsen, Werner F., Jan van Winckel and A. Mark Williams, 2005. “The Relative Age Effect in Youth Soccer across Europe”, Journal of Sports Sciences, Vol. 23, No. 6, pp. 629-636. doi:10.1080/02640410400021310.
Johnston, Fiona, Michael Rosato and Gemma Catney, 2010. “The Northern Ireland Longitudinal Study – An Introduction”, NILS Working Paper 1.0, Belfast: NILS Research Support Unit.
Kawaguchi, Daiji, 2011. “Actual Age at School Entry, Educational Outcomes, and Earnings”,
Journal of the Japanese and International Economies, Vol. 25, No. 3, pp. 64-80.
doi:10.1016/j.jjie.2009.02.002.
Mackenbach J. P., J. G. Simon, C. W. N. Looman and I. M. A. Joung, 2002. “Self-assessed Health and Mortality: Could Psychosocial Factors Explain the Association?”, International Journal of
Epidemiology,Vol. 31, No. 6, pp. 1162-1168
Martin, D., 2002. “Output areas for 2001” in P. Rees, D. Martin and P. Williamson (eds.) The Census Data System, Chichester: Wiley, pp. 37-46.
Montez, J. and E. Friedman, 2015. “Educational Attainment and Adult Health: Under What Conditions is the Association Causal?”, Social Science and Medicine, Vol. 127, pp. 1-7.
Mortensen, Preben Bo, Carsten Bøcker Pedersen, Tine Westergaard, Jan Wohlfahrt, Henrik Ewald, Ole Mors, Per Kragh Andersen and Mads Melbye, 1999. “Effects of Family History and Place and Season of Birth on the Risk of Schizophrenia”, New England Journal of Medicine, Vol. 340, No. 8, pp. 603-608. doi:10.1056/NEJM199902253400803.
Mossey J. M. and E. Shapiro, 1982. “Self-rated Health: A Predictor of Mortality Among the Elderly”, American Journal of Public Health, Vol. 72, No. 8, pp. 800-808.
Mujika, Iñigo, Roel Vaeyens, Stijn P. J. Matthys, Juanma Santisteban, Juan Goiriena and Renaat Philippaerts, 2009. “The Relative Age Effect in a Professional Football Club Setting”, Journal
of Sports Sciences,Vol. 27, No. 11, pp. 1153-1158. doi:10.1080/02640410903220328.
Nakata, Hiroki and Kiwako Sakamoto, 2013. “Relative Age Effects in Japanese Baseball: An Historical Analysis”, Perceptual and Motor Skills,Vol. 117, No. 1, pp. 1318-1331.
NISRA, 2010. Northern Ireland Multiple Deprivation Measure 2010.Belfast: Northern Ireland Statistics and Research Agency (NISRA).
Ólafsdóttir, Thorhildur and Tinna Laufey Ásgeirsdóttir, 2014. “Does Month of Birth Affect Individual Health and Educational Attainment in Iceland?” Eastern Economic Journal,Vol. 41, No. 3, pp. 329-345. doi:10.1057/eej.2014.20.
Ponzo, Michela and Vincenzo Scoppa, 2014. “The Long-Lasting Effects of School Entry Age: Evidence from Italian Students”, Journal of Policy Modeling,Vol. 36, No. 3, pp. 578-599. doi:10.1016/j.jpolmod.2014.04.001.
Robertson, Erin, 2011. “The Effects of Quarter of Birth on Academic Outcomes at the Elementary School Level”, Economics of Education Review, Vol. 30, No. 2, pp. 300-311. doi:10.1016/j.econedurev.2010.10.005.
Roberts, Simon J. and Stuart J. Fairclough, 2012. “The Influence of Relative Age Effect in the Assessment of High School Students in Physical Education in the United Kingdom”, Journal of
Snijers, T. and R. Bosker, 2011. Multilevel Analysis: An Introduction to Basic and Advanced Multilevel Modeling, London: Sage.
Sullivan, A., 2001. “Cultural Capital and Educational Attainment”, Sociology, Vol. 35, No. 4, pp. 893-912.
Taylor C., H. Joshi and C. Wright, 2015. “Evaluating the Impact of Early Years Educational Reform in Wales to Age Seven: The Potential Use of the UK Millennium Cohort Study”, Journal of
Education Policy,Vol. 30, No. 5, pp. 688-712.
Verachtert, Pieter, Bieke De Fraine, Patrick Onghena and Pol Ghesquière, 2010. “Season of Birth and School Success in the Early Years of Primary Education”, Oxford Review of Education,Vol. 36, No. 3, pp. 285-306.
Wattie, Nick, Joseph Baker, Stephen Cobley and William J. Montelpare, 2007. “A Historical Examination of Relative Age Effects in Canadian Hockey Players”, International Journal of
Sport Psychology,Vol. 38, No. 2, pp. 178-186.
Woods, Laura M., Bernard Rachet, Michael Riga, Noell Stone, Anjali Shah and Michel P. Coleman, 2005. “Geographical Variation in Life Expectancy at Birth in England and Wales Is Largely Explained by Deprivation”, Journal of Epidemiology and Community Health,Vol. 59, No. 2, pp. 115-120. doi:10.1136/jech.2003.013003.
APPENDIX:
T
able 5: Binary Logistic Multilevel Models – The Ef
fect of the Month of Birth on Educational Success and
Self-Reported Health in Early Adulthood
D
V
: Respondent has at least
A-Le
vels
D
V
: Respondent: No educational qualif
T
able 5: Binary Logistic Multilevel Models – The Ef
fect of the Month of Birth on Educational Success and
Self-Reported Health in Early Adulthood (contd.)
D
V
: Respondent has at least
A-Le
vels
D
V
: Respondent: No educational qualif
ications M1 M2 M1 M2 Odds Ratio Odds Ratio Odds Ratio Odds Ratio (CIs) (CIs) (CIs) (CIs) December 1.088 1.092 0.877 0.876 [0.968 1.221] [0.975 1.224] [0.719 1.068] [0.719 1.068] Cohor t: bor
n before Jul
y ’83
refcat
refcat
Cohor
t: Jul
y ’83 – June ’84
0.922 1.295 [0.654 1.301] [0.726 2.310] Cohor t: Jul
y ’84 – June ’85
0.874 1.394 [0.652 1.172] [0.850 2.284] Cohor t: Jul
y ’85 – June ’86
0.9711 1.306 [0.762 1.236] [0.870 1.962] Cohor t: Jul
y ’86 – June ’87
1.167 1.107 [0.962 1.417] [0.799 1.534] Cohor t: Jul
y ’87 – June ’88
1.138 1.042 [0.978 1.324] [0.807 1.346] Cohor t: Jul
y ’88 – June ’89
T
able 5: Binary Logistic Multilevel Models – The Ef
fect of the Month of Birth on Educational Success and
Self-Reported Health in Early Adulthood (contd.)
D
V
: Respondent has at least
A-Le
vels
D
V
: Respondent: No educational qualif
ications M1 M2 M1 M2 Odds Ratio Odds Ratio Odds Ratio Odds Ratio (CIs) (CIs) (CIs) (CIs) P arental household
, 2001: educational
depri v ation 0.516 2.183* [0.480 0.547] [2.000 2.380] P arental household
, 2001: emplo
yment depri v ation 0.735 1.253* [0.696 0.776] [1.151 1.364] Lo
g multiple area depri
v
ation score (2001)
0.726 1.604* [0.697 0.755] [1.494 1.722] Constant 0.239 0.047* [0.069 0.823] [0.006 0.382] SO A Le v el-2 V ariance 0.085 0.004 0.099 0.090 Lik
elihood-ratio test against single-le
v el model 900.22 86.48 4.72 76.33 Lik
elihood-ratio test M2 against M1
698.78 18,706.6 N (indi viduals) 36,087 36,087 36,087 36,087 N (SO As) 890 890 890 890 Note: *
P<0.05; In parentheses: 95 per cent conf
idence inter
v
als. Health less than good includes health cate
gories from f
air to v
er
y
Table 6: Respondents’ Months of Birth by Educational Advantage of the Parental Household in 2001, Frequencies and Percentages
Household-Level Educational Whether Head of Household Deprivation (2001) Has a Degree (2001) Birth Month Household Not Household Has a Has No Total
Educationally Educationally Degree Degree Deprived Deprived (2001)
(2001) (2001)
January N 1,873 1,244 447 2,670 3,117
% 8.6 8.8 8.9 8.6 8.6
February N 1,661 1,093 375 2,379 2,754
% 7.6 7.7 7.5 7.6 7.6
March N 1,990 1,259 440 2,809 3,249
% 9.1 8.9 8.8 9.0 9.0
April N 1,749 1,061 422 2,388 2,810
% 7.9 7.5 8.4 7.7 7.8
May N 1,963 1,258 471 2,750 3,221
% 8.9 8.9 9.4 8.8 8.9
June N 2,012 1,294 456 2,850 3,306
% 9.2 9.1 9.1 9.2 9.2
July N 1,741 1,134 386 2,489 2,875
% 7.9 7.9 7.7 8.0 7.9
August N 1,953 1,297 455 2,795 3,250
% 8.9 9.1 9.1 8.9 9.0
September N 2,002 1,168 434 2,736 3,170
% 9.2 8.2 8.7 8.8 8.8
October N 1,778 1,221 406 2,593 2,999
% 8.1 8.6 8.1 8.3 8.3
November N 1,597 1,082 347 2,332 2,679
% 7.3 7.6 6.9 7.5 7.4
December N 1,572 1,085 362 2,295 2,657
% 7.2 7.6 7.2 7.4 7.4
Total N 21,891 14,196 5,001 31,086 36,087