EPJ Web of Conferences 47, 06004 (2013) DOI: 10.1051/epjconf/20134706004 C
Owned by the authors, published by EDP Sciences, 2013
Sub-stellar objects with habitable-zone temperatures:
A new search for Y dwarfs in WISE
David Pinfield
1,a, Joana Gomes
1,band Avril Day-Jones
2,c1Centre for Astrophysics Research, University of Hertfordshire, College Lane, Hatfield
AL10 9AB, UK
2Departamento de Astronomia, Universidad de Chile, Casilla 36-D, Santiago, Chile
Abstract. A method is defined for using the maximum sensitivity of WISE to find late T and Y dwarfs. This requires a WISE detection only in theW2-band and uses the statistical properties of the WISE multi-frame measurements and profile fit photometry to reject contamination resulting from non-point-like objects, variables and moving sources. To trace our desired parameter space we use a control sample of isolated non-moving non-variable point sources from the SDSS, and identify a sample of 158 WISEW2-only candidates down to a signal-to-noise limit of 8. For signal-to-noise ranges >10 and 8-10 respectively, ∼45% and ∼90% of our sample fall outside the criteria published by the WISE team (Kirkpatrick et al. 2012), due mainly to the type of constraints placed on the number of individualW2 detections. We present some early follow-up of our sample and identify two new very late objects with high proper motion (∼1.3 and∼1.8 arcsec yr−1). Based on colour, brightness and proper motion, these object are either∼T9 dwarfs with
thick-disk/halo kinematics, or Y dwarfs with more disk-like kinematics. Reduced proper motion diagrams are also presented which suggest that late T and Y dwarfs may have a much higher thick-disk/halo population fraction than earlier objects.
1. INTRODUCTION
WISE sources have generally been measured in 8-30 frames, and the∼10-W2 limit is thus usually found in the range W2=15.0-15.7. Our focus is to make a thorough search for Y dwarfs in this magnitude range. WISE Y dwarf colours are W1−W2>3.9, W2−W3=1.7-2.6, and W2−W4 5. With a WISE 5- limit of W1=17.1-17.8 (for 8-30 frames) we expect Y dwarfs withW2= 15.0-15.7 to beW1 non-detections in general (as indeed all previously identified WISE Y dwarfs have been). And in the other bands the WISE 5- limits areW3=11.2-11.9 andW4=8.0-8.7 (for 8-30 frames), leading to Y dwarfs (in theW2=15.0-15.7 range) beingW3 andW4 non detections, or at most detections of very low significance. We therefore taylored our search to identifyW2-only sources.
1.1 The new sample
These rejection methods were conceived to test for (i) resolved (or partially resolved) sources such as galaxies and sources associated with nebulosity or artefacts, (ii) variable sources, and (iii) sources that move significantly overthe time-scale of the multi-frame images (i.e. solar system objects). However we only have a single band (W2) to work with, and wish to avoid rejecting good sources down to the
ae-mail: [email protected] be-mail: [email protected] ce-mail: [email protected]
Hot Planets and Cool Stars
Figure 2. WISE W1-W2 against W2 colour magnitude diagrams. Our new sample is shown with red symbols (triangle point away from the lower limit colours). Objects from the K12 census are also shown, with W2-only sources green and Y dwarfs cyan.
faint limits of the survey. To achieve this we took the approach of assessing the statistical properties associated with the full range ofW2 measurements (integrated and individual).
Firstly we assessed how close each source was to being point-like by studying the profile fit photometry. Next we compared two measures of the photometric uncertainty, one determined directly from the scatter in the multi-frameW2 measurements, and the other from the uncertainty in the overall flux measurements. This comparison was conceived to provide sensitivity to sources where the measured photometric scatter is different to the statistical scatter (e.g. as a result of variability, or a source moving between frames). Finally we assessed the number of source detections (above 3-) in individual frames, as a function of signal-to-noise. This was also designed for sensitivity to sources that vary or move over the multiframe time-scale. And we note that all three types of assessment are sensitive, at some level, to field crowding and the effects of blending, which could distort point-spread functions and compromise source detectability and measurement repeatability. As a means to differentiate between the desired properties and those of the contamination that we wish to reject, we defined a control sample of isolated point-like non-variable non-moving sources, extending all the way down to the faint survey limits.
To define the control sample we combined the Sloan Digital Sky Survey with WISE. We selected sources spectroscopically classed by SDSS as stars, and to avoid field crowding (and thus prefer isolated sources) we limited our search to a galactic latitude|b|>70 deg. This will also remove giant (possibly variable) stars from our selection. We used photometric limits ofg <20.0 andg−r <0.3 to select stars with reasonably blue colour and WISE magnitudes down toW2=18. We selected point-like Sloan sources with proper motions>20 mas yr−1, which we cross-matched with the WISE All-Sky Source catalogue using a cross-match radius of 1 arcsecond to avoid mis-matches. This should also exclude non moving galaxies and very high proper motion objects. The control sample should thus consist of stars that are stationary across the WISE multi-frame measurements. We also required that sources be un-blended (nb=1) in WISE (which only decreased the size of the contro l sample by an additional 0.3%).
In Figure1the plots on the left hand side show the control sample (small black points), as well as sources from the All-Sky late T and Y dwarf census of K12. Y dwarfs are shown in cyan, with other sou rces in blue unless detected only inW2 when they are green. The plots on the right hand side of Figure show how contamination is rejected amongst the initial selection with SNR>10. The rejection criteria that we employed are indicated with solid lines on the plots.
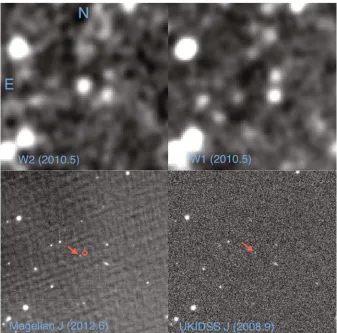
Figure 3. Multi-band images of WISE 0013+0634. The top two plots are WISE W2 and W1-band images on the left and right respectively, with the source in the centre. The bottom two plots show the Magellan Fourstar and UKIDSS LAS J-band images on the left and right respectively. The epoch difference between these two images is 3.7 years. The high proper motion J-band counterpart is indicated in each image by a red arrow, and the UKIDSS position is indicated in the Magellan image with a red open circle.
2 of theW2 profile fit photometry, and is a direct indicator of how well the source is represented by the optimised point-spread function fit. It can be seen from the control sample plot (top left) that in all but a small number of outlier cases (∼1%), w2rchi2 lies in a band between 0.7 and 1.2 for w2snr from 2−50. Seven from K12>1.2, and visual inspection showed that the majority were very close to or slightly overlapping with neighbouring sources in the WISE images (although they are listed as un-blended in the WISE. In these cases this effect has lead to an increased w2rchi2 value for the profile fit photometry.
Hot Planets and Cool Stars
Figure 4. Multi-band images of WISE 0833+0052. Each image is 1 arcminute on the side. The top two plots are WISE W2- and W1-band images on the left and right respectively, with WISE 0833+0052 in the centre. The middle two plots show the UKIDSS Y and J-band images from 2006.95. The bottom two plots show the VLT Hawk-I J- and H-band images from 2012.8 (near-infrared epoch difference of 5.85 years). The high proper motion near-infrared counterpart is indicated in each image by a red arrow, and has moved by 10.4 arcseconds between the near-infrared epochs.
1.3 Results
WISE 0013+0634 is one of the brightest (W2=15.04) sources in our sample (cf. the sample is predominantly W2=15-16). The Figure shows the WISE images (W2 andW1 upper left and right respectively; epoch 2010.5), as well as our near-infrared multi-epoch data. The bottom right plot shows a low signal-to-noise (sim5) counterpart in the UKIDSS LASJ-band image (indicated by a red arrow), taken∼1.6 years before t he WISE epoch (2008.9). This counterpart is offset by∼2 arcseconds from the WISE source centre, and no d etections were discernible in theY-,H- orK-band LAS images. We were able to confirm the near-infrared counterpart in a deeperJ-band image (using Fourstar on Magellan) obtained 2.1 years after the WISE epoch (bottom left of the Figure; epoch 2012.6). We measured a much stronger detection (signal-to-noisesim20) of theJ-band counterpart in this data, also indicated by a red arrow in the image with the UKIDSS p osition shown as a red open circle. This counterpart was located (as expected) on the other side of the WISE s ource centre, and we have verified that the 3 epoch positions (UKIDSS, WISE and Magellan) are self consistent to within astrometric uncertainties, though our final proper motion measurement for WISE 0013+0052 (totaling 1 .3 arcsec yr−1) was derived using the UKIDSS and Magellan data (with a 3.7 yr baseline). The WISE colour limit ofW1−W2>3.27 suggests a spectral type later than T7, and the J–H colour is consistent with a late T or ∼Y0. The measuredJ−W2=4.89±0.15 places an additional constraint, leading to an estimated spectral type of T9 or later.
We measured the proper motion of WISE 0833+0052 using the UKIDSS and Hawk-I J-band images. We also verified that the proper motions derived using UKIDSS and WISE or WISE and Hawk-I were consistent with this to within their uncertainty. Our centroiding on the WHawk-ISE source was not affected by the modest level of blending evident in theW2 image, so our consistency check was able to verify the relative location of the object in the thre e epochs. WISE 0833+0052 has a very high proper motion of 1.89±0.04 arcsecs/yr.
References
[1] D. J. Pinfield, MNRAS, in press (2012)