Sparse dissimilarity constraint coding for glaucoma
screening
1Aarti .B Shere,2Pornima M. Birajdar 1Student,2Assistant Professor
M. S. Bidve Engineering College, Latur, Maharashtra, India,
_____________________________________________________________________________________________________ Abstract -Eye disease which harms the optic nerve that conveys data from the eye to the brain is Glaucoma. It is the second reason of visual deficiency, recognizing the disease in time is critical on the grounds that it can't be restored. Numerous methodologies are done in distinguishing Glaucoma; those are insufficient for population based glaucoma screening. Optic nerve head evaluation in retinal fundus image is both all the more encouraging and unrivaled. This paper proposes image preparing strategy for the early identification of glaucoma. Glaucoma is one of the significant causes which cause blindness yet it was difficult to analyze it in beginning times.
Keyword - cup to disc ratio, glaucoma screening, sparse dissimilarity-constrained coding.
_____________________________________________________________________________________________________ INTRODUCTION
Glaucoma is a complex eye disease where it leads to vision loss. Nearly 79 million peoples are going to affect up to coming year of 2020.As the symptoms only occur when the disease is quite advanced and very difficult to identify. Early detection and treatment by your ophthalmologist are the keys to preventing optic nerve damage and vision loss from
Glaucoma. Many of the people are unaware about the disease, so screening the glaucoma is important for everyone. Generally glaucoma assessment by Intra Ocular Pressure (IOP) measurement, visual field test and optic nerve head assessment, these are all promising ones, but these are all high cost, where screening glaucoma based on Cup Disc Ratio (CDR) is the low cost method.
In[1],inappropriate for low-cost large-scale screening, and selection features and classification stage. In [2], the threshold based on intensity is used. In [3], challenges are there to finding the vessel bend,
Yin et al. developed an active shape model (ASM)-based approach by combining prior knowledge with contour deformation Gopal Joshi et al. proposed a method which make use of anatomical evidences such as vessel bends and local image parameters [5]. Jun Cheng et al. developed method based on super pixel classification by the use of histogram and center surround statistics [4]. Currently, the air-puff intraocular pressure (IOP) measurement, visual field test and optic nerve head (ONH) assessment are often used in glaucoma assessment.
Figure.1. Structure of an optic disc: optic disc boundary (blue), optic cup (white), neuroretinal rim (cyan), CDR is computed as VCD/VDD
In this proposed method Cup to Disc Ratio (CDR) can be estimated, based on the CDR the glaucoma stage is found. Usually the normal cup-to-disc ratio is 0.3. A larger CDR generally indicates a higher risk of glaucoma. The CDR is computed as the ratio of the vertical cup diameter to the vertical disc diameter. Overcome the limitations in [4] .that is overestimates very small cups and underestimates very large cups. Here the Fig 1. Show structure of an optic disc. It shows the optic disc boundary, optic cup, neuroretinal rim and CDR computation.
Here, CDR= VCD/VDD
Where , CDR is the Cup to Disc Ratio VCD is the vertical cup diameter
In this section, we present some of the most suitable techniques that are used for the detection of glaucoma. There are manual and automatic detection methods available. The survey is conducted on different glaucoma detection methods in image processing.
1) Sparse Dissimilarity Constrained Coding for Glaucoma Screening
In this paper regarding survey they presents about compute the CDR using the method of Sparse Dissimilarity-Constrained Coding (SDC) to locate and segment the disc from the image [1]. The location of disc is finding approximately and sometimes very often to the disc which is based on their anatomical structures and brightness among the macula, blood vessels of retina and those anatomical structures. In this paper, they proposed the self assessment disc segmentation method of state-of-the art is used [3]. It gives more accurate result of screening the glaucoma in retinal fundus image [4].
2) Superpixel classification based segmentation of optic disc and optic cup
The superpixel classification is a technique to classify the image based on their category as well as segment they don’t have proper blood vessel (BV) bends in there retina thus it can unable to process with abnormal retina. Most of the glaucomatous optic disc
(OD) Cup will have anomalous blood vessels. This paper mainly proposed the technique of segmentation which is used to segment the optic disc and optic cup in the given retinal image by using the superpixel classification technique [5], [6].
Figure 2. Superpixel based optic disc segmentation 3) Segmentation of optic disc and cup from monocular color retinal images
Regarding survey this paper presents about the assessment of glaucoma from monocular color retinal images done by Optic Disk and Cup Segmentation [3].Contour model method which is used to segment the OD cup based on anatomical evidence like vessel bends at the boundary of cup [4].
.
the optical disc is extracted by morphological operators. It gives more efficient segmentation process which is compared by others.
Figure 5. Results of segmented optical disc after the thresholding a) left column are input image, b) right column is threshold image.
5) Glaucoma detection using Deep Convolution Neural Network
Glaucoma is a chronic and irreversible eye disease, which leads to deterioration in vision and quality of life [1]. In this paper, we develop a deep learning (DL) architecture with convolutional neural network for automated glaucoma diagnosis. Deep learning systems, such as convolutional neural networks (CNNs), can infer a hierarchical representation of images to discriminate between glaucoma and non glaucoma patterns for diagnostic decisions [7]. The proposed DL architecture contains six learned layers: four convolutional layers and two fully-connected layers. Dropout and data augmentation strategies are adopted to further boost the performance of glaucoma diagnosis. Extensive experiments are performed on the ORIGA and SCES datasets. The results show area under curve (AUC) of the receiver operating characteristic curve in glaucoma detection at 0.831 and 0.887 in the two databases [1] [9].
PROPOSED SYSTEM
Disc Localization, Segmentation, and Normalization
The proposed system detects whether the given input image is glaucoma affected or normal based on the CDR and blood vessel orientation. In order to compute the CDR using the proposed SDC, it is important to locate and segment the disc. The disc localization focuses on finding an approximate location of the disc, very often the disc center. The disc localization is often achieved based on brightness, anatomical structures among the disc, macula, and retinal BVs or the relative locations of these anatomical structures.
In this paper, we segment the disc using the state-of-the art self-assessed disc segmentation method
Self-Assessed Disc Segmentation -Optic disc segmentation from retinal fundus image is a fundamental but important step in many applications such as automated glaucoma detection. The self-assessed disc segmentation proposed in selects one result based on the outputs from three individual disc segmentation methods. The self-assessed method determines the disc by applying the three disc detection methods one by one until a confident output is obtained.
Disc Normalization -Earlier experience shows that the green channel of the retinal color image is the most suitable one for CDR computation.
1) BV Removal
Figure 6. Illustration of unbalance correction: a linear mapping based on the average intensities on the left and right side where ˜x=morph(x) denotes the image after applying a morphological closing process onx. Then, the vessel removed image ˆxis obtained by replacing the vessel pixels inxwith the pixels in ˜x, i.e.,
2) Within Disc Uneven Illumination Correction:
Uneven illumination across the optic disc is another factor that affects the dissimilarity computation and the disc
reconstruction. Very often, the temporal side of the disc is brighter than the nasal side while the unbalance varies from one disc image to another. we apply a linear mapping to correct the
unbalance. we first compute the average intensity ¯xland ¯xrfrom the first and lastpcolumns of the disc ˆx. Then the balance corrected discxbis computed as:
Where is the center column of the disc,and th is the maximum number of columns. In this paper, we set pas 10% of thi.e.,p= 5 for our disc resized to be 50×50. The performance of the method is not sensitive to the value ofp.
and comparing it with the standard threshold value will decide the affected area and also result will be based on the CDR ratio and threshold value [1].
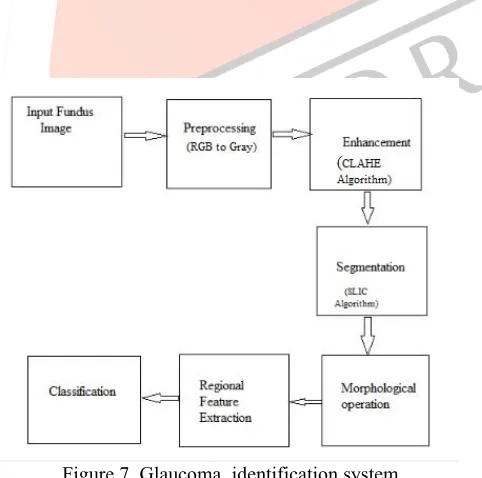
1. Preprocessing:
Firstly we have to consider retinal image of an patient as input image, this image is subjected to pre-processing in that retinal image is converted into gray scale image and for image enhancement will make use of CLAHE pre-processing algorithm [7] from the enhanced image we are going for optic disc detection and optic disc normalization by calculating the blood vessel content and will remove those vessels for better image quality.
2. Enhancement:
Image enhancement is the process of adjusting digital images so that the results are more suitable for display or furtherimage analysis.For example, you can remove noise, sharpen, or brighten an image, making it easier toidentify key features [1].
3. Segmentation:
In segmentation use the simple linear iterative clustering algorithm (SLIC) to aggregate nearby pixels into super pixels in retinal fundus images.[3][6] Compared with other super pixel methods, SLIC is fast, memory efficient and has excellent boundary adherence. The number of desired super pixels is the main parameter why we used SLIC and it is simple also only because of this parameter. They adopted a new super pixel algorithm, simple linear iterative clustering (SLIC), which uses a k-means clustering approach for proper generation of super pixels. This algorithm is best when compared to other conventional methods [9]. Along that, it is faster and more memory efficient, improves segmentation performance, and is straight forward to extend to super pixel generation. SLIC is simple to use and understand.
4.Morphological Operation:
Actual shape of the disc and cup will not represent the disc and cup boundaries which are detected from the segmentation methods, because the boundaries can be affected by a large number of blood vessels entering the disc [1]. So the morphological operations are implemented to reshape the obtained disc and cup boundary. Then CDR is calculated by taking the ratio of the area of cup to area of disc [1]. For accurate measurement of optic disc and the cup areas we are removing blood vessels from the image. Morphological operation such as erosion, dilation, opening and closing are implemented on the image. The regions of foreground pixels and for dilation was to gradually enlarge the regions of the foreground pixel, therefore this techniques help to remove unwanted bright spots or boundaries present in the image. A disc shaped structuring element of size 15 was created and a closing and opening operation was performed on both the red and green component images. A value of 1 (white The Morphological erosion operation erodes away) was obtain for the region that contains the optic disc and cup, whereas a value of 0 (black) for the background.
In mathematical morphology, the closing of a set (binary image) A by a structuring element B is the erosion of the dilation of that set,
AB = (AB)B
Where,anddenote the dilation and erosion ,respectively. 5. Regional Feature Extraction and Classification
A mask is drawn over the cup and disc. The orientation of the blood vessels around the circle is identified. Blood vessel orientation is analysed by the distribution of blood vessel into four quadrants of the image. If majority of the blood vessels belong to one or two quadrants then it is classified as advanced stage glaucoma image and if they spread in all the three or four quadrants then it is identified as early glaucoma or normal image. To strengthen the accuracy, the CDR is computed [1]. If the ratio is greater than 0.3, it is identified as glaucoma affected image, otherwise a normal eye image.
Other feature Extraction Technique-Glaucoma is a chronic and irreversible eye disease, which leads to deterioration in vision and quality of life. In this paper, we develop a deep learning (DL) architecture with convolutional neural network for automated glaucoma diagnosis [9].Deep learning systems, such as convolutional neural networks (CNN) can infer a hierarchical representation of images to discriminate between glaucoma and non glaucoma patterns for diagnostic decisions [9].
Here, we use
CONTRAST LIMITED ADAPTIVE HISTOGRAM EQUALIZATION (CLAHE)
-CLAHE is an adaptive contrast enhancement method. It is based on AHE, where the histogram is calculated for the contextual region of a pixel. CLAHE, proposed by Zuierveld et al [2] has two key parameters: block size (N) and clip limit (CL).These parameters are mainly used to control image quality.
Algorithm-Step 1: Divide the each input image into a number of non-overlapping contextual regions of equal size of the 8x8 blocks, each of which corresponds to the neighborhood of 64 pixels.
Step 3: Set the clip limits for clipping the histograms, (for example c=0.002). The clip limit is a threshold parameter for effectively altering the contrast of the image. Higher clip limits increases the contrast of local image regions thus it must be set to minimum optimal value.
Step 4: Modified the each histogram by the selecting a transformation functions.
Step 5: Each histogram is transformed in such a way that its height did not exceed the selected clip limit.
The mathematical expression for transformed gray levels for standard CLAHE method with Uniform Distribution can be given as;
Where is the clip parameter? CLAHE method operates on small regions in the image, called “tiles”, rather than the entire image. Each tile's contrast is enhanced, so that the histogram of the output region approximately matches the histogram specified by the Distribution type. The CDF of Rayleigh distribution is given as;
Step 6: The neighboring tiles were combined using bilinear interpolation and the image gray scale values were altered according to the modified histograms.
Canny Edge Detection-The purpose of edge detection in general is to significantly reduce the amount of data in an image, while preserving the structural properties to be used for further image processing.
Algorithm-1. Smoothing: Blurring of the image to remove noise.
2. Finding gradients: The edges should be marked where the gradients of the image has clarge magnitudes. 3. Non-maximum suppression: Only local maxima should be marked as edges.
4.Double thresholding: Potential edges are determined by thresholding.
5. Edge tracking by hysteresis: Final edges are determined by suppressing all edges that are not connected to a very certain (strong) edge.
SLIC Superpixels (simple linear iterative clustering)
8. The distance D depends on pixel’s color (color proximity) and pixel position (spatial proximity), whose values is known. The value of D is given by,
The maximum spatial distance expected within a given cluster should correspond to the sampling interval, Ns = S. Determining the maximum color distance Ncis not so straightforward, as color distances can vary significantly from cluster to cluster and image to image. The value of Ncin the range from [1, 40].
9. If D <d(i) then setd(i) = D and (i) =kgot to 6. 10. Go to 5, the same process for each cluster 11. Compute new cluster centers.
12.The clustering and updating processes are repeated until a predefined number of iteration is achieved.
The SLIC algorithm can generate compact and nearly uniform super pixels with a low computational overhead RESULTS AND DISCUSSIONS
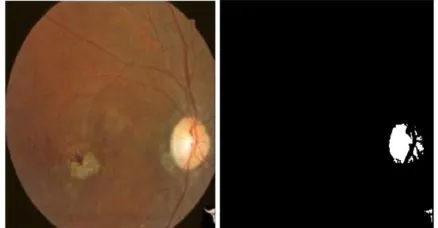
So above fundus image going through all the technique we get our output of optic disc ratio. Optic Disc-We find Area of the image.
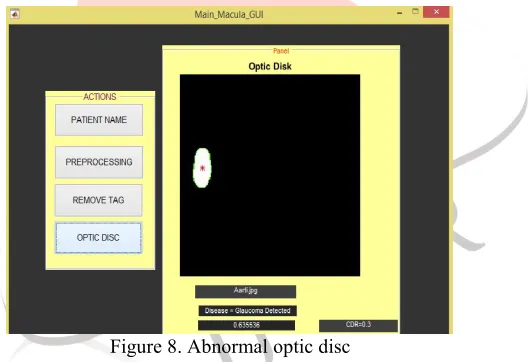
OD detection in retinal fundus image is discussed for glaucoma diagnosis based on image processing techniques.Optic disc gives abnormal image which means this retinal image is affected by glaucoma disease.
Figure 8. Abnormal optic disc
Next, we can show normal optic disc. which means it does not affected glaucoma diseases because ratio is less than 0.3.
From the sparse dissimilarity constraint, the cup to disc ratio is calculated by identifying the cup and the disc in the eye image. If the ratio is beyond the threshold level, then glaucoma is present. By this type detection, the glaucoma can be detected in the earlier stage, which can controlled.
EXPERIMENTAL RESULTS
In this paper we implement various methods to analysis which gives less amount of time. so we implement Median filter, Stationary wavelet transform and Active contour model. In this Wiener image elapsed time is 0.7160sec.
Then Median image elapsed time is 0.6565sec.
Stationery wavelet transform takes elapsed time 0.2311sec and Active contour segmentation takes elapsed time 7.688sec. So we can get Median filter gives less time and Stationery wavelet transform gives less time. Active
Contour method gives more time so, it did not worthy.
Figure.9 Cup to Disc Ratio Accuracy between various method detection techniques
We elaborate graph between Wiener filter and Median filter. From this graph we can shows which filter gives more accuracy. If CDR is less then median filter gives less amount of time. Otherwise CDR is more then wiener filter gives less amount of time.
Figure.10 Accuracy between Wiener filter and Median filter CONCLUSION
[5] Padmasinh.M Deshmukh et al., "Segmentation of Retinal Images for Glaucoma Detection" International Journal of Engineering Research & Technology(IJERT) Vol. 4 Issue 06, June-2015.
[6] Subi. P .P “Glaucoma screening based on superpixel classification and detection of macula in human retinal imagery,” IJCAT International Journal of Computing and Technology, Vol 1, Issue 5, June 2014.
[7] Issac A, Partha Sarathi M, Dutta MK. “An adaptive threshold based image processing technique for improved glaucoma detection and classification”, Computer. Methods Programs Biomed, 2015 Aug 10.International Journal of Engineering Research & Technology (IJERT)ISSN: 2278-0181 IJERTV4IS090657www.ijert.org(This work is licensed under a Creative Commons Attribution 4.0 International License.)Vol. 4 Issue 09, September-2015 532.
[8] Sujitkumar S B, Vipula Singh,”Automatic detection of diabetic retinopathy in Non-dilated RGB Retinal fundus images”.International journal of computer applications(0975-888),vol.47,no.19, 2012.
[9] Andrea Frome, Greg S. Corrado, Jon Shlens, Samy Bengio, Je_ Dean, Tomas Mikolov.” A deep visual-semantic embedding model’. In NIPS.29.2013
[10] John Canny,”A computational approach to edge detection”.IEEE Transactions on Analysis and Machine Intelligence, vol PAMI-8NO 6, pp 679–698, Nov. 1986.
[10] T. Chanwimaluang and G. Fan, “An efficient blood vessel detection algorithm for retinal images using local entropy thresholding,” inProc. Int.