Modeling the long-term durability of concrete barriers in the
context of low-activity waste storage
Y. Protière1,*, E. Samson1 and P. Henocq1
1SIMCO Technologies Inc.
1400 Boul. du Parc-Technologique, Suite 203 Quebec (QC) Canada
Abstract. The paper investigates the long-term durability of concrete barriers in contact with a cementitious wasteform designed to immobilize low-activity nuclear waste. The high-pH pore solution of the wasteform contains high concentration level of sulfate, nitrate, nitrite and alkalis. The multilayer concrete/wasteform system was modeled using a multiionic reactive transport model accounting for coupling between species, dissolution/ precipitation reactions, and feedback effect. One of the primary objectives was to investigate the risk associated with the presence of sulfate in the wasteform on the durability of concrete. Simulation results showed that formation of expansive phases, such as gypsum and ettringite, into the concrete barrier was not extensive. Based on those results, it was not possible to conclude that concrete would be severely damaged, even after 5,000 years. Lab work was performed to provide data to validate the modeling results. Paste samples were immersed in sulfate contact solutions and analyzed to measure the impact of the aggressive environment on the material. The results obtained so far tend to confirm the numerical simulations.
1 Introduction
Concrete barriers are viewed as a potential solution to store contaminated wasteform resulting from nuclear energy production processes. In this context, concrete is expected to act as a contaminant barrier for extended period of time. Wasteform in direct contact with concrete can compromise the integrity of the barrier due to the potentially high concentration of deleterious ionic species it contains.
The study presented in this paper focused on low-activity wasteform containing high level of sulfate. The purpose of the study was to improve understanding of the complex concrete/wasteform reactive transport problem. Simulations were first performed with a reactive transport model called STADIUM [1]. The multiionic transport model considers electrical coupling between the species, chemical activity effects due to high concentration levels, and the impact of temperature variations. The model also incorporates a chemical equilibrium module that simulates the formation or dissolution of minerals. A feedback function takes into account the local porosity variations as minerals are dissolved or precipitated. The model was used to simulate the transport of species from the pore solution of a wasteform material through a concrete barrier in order to estimate the
*e-mail: [email protected] C
Owned by the authors, published by EDP Sciences, 2013
term durability of storage structures. Particular attention was paid to the presence of sulfates in the wasteform, which can be a source of formation of expansive phases such as gypsum and ettringite [2-4]. Following the simulations, experiments were performed to verify the validity of results.
2 Demonstration case description
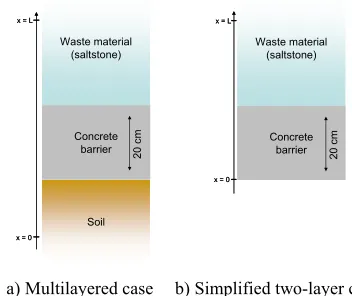
The test case considered in the paper is illustrated in Fig. 1, [5]. The objective of the simulations was to estimate the durability of a 20-cm concrete layer that acts as a barrier to prevent the leaching of contaminants to the soil from the wasteform slurry. The main concern is the presence of sulfate ions in the slurry. Due to concentration gradients, the ions may diffuse from the slurry into the concrete. Upon sulfate penetration, there is a risk that deleterious phases such as ettringite can precipitate and damage the barrier.
Fig. 1a illustrates the complete system. It consists in a layer of concrete in contact with wasteform on one side and soil on the other side. The thickness of the wasteform layer can reach six meters [5]. All simulations were carried out with a 3-m layer of wasteform. For the simulations considered in the study, it was assumed that the flow field in the soil is large. In that case, it is possible to neglect the soil layer and assume nil concentrations for the main species at the soil/concrete interface. This corresponds to the case illustrated in Fig. 1b.
a) Multilayered case b) Simplified two-layer case
Fig. 1.Schematic representation of demonstration cases
The simulations were performed at 15°Cto take account a lower temperature in the soil. Also, the calculations were performed in saturated conditions, which correspond to the portion of a storage structure below the water table. Finally, all simulations were performed in one dimension (1D) over 5,000 years. An adaptive time-stepping function in STADIUM was used for all the simulations presented in this paper.
3 Material properties
Two concrete mixtures that were designed as potential candidates for storage structures [
5
] were prepared and tested to measure their transport properties, such as porosity and tortuosity (diffusion coefficients). Similarly, a wasteform formulation was batched and tested to measure its transport properties.Testing included a gravimetric method (similar to ASTM C642) to measure total pore volume. Migration tests, based on a method developed by Samson et al. [6] provided the tortuosity (diffusion coefficients). Compressive strength was measured in accordance with ASTM C39 to assess the quality of the mixtures. Finally, pore solution extraction was carried out after 28 days of curing, in accordance with the triaxial compression method proposed by Barneyback and Diamond [7].
Concrete barrier Waste material
(saltstone)
Soil
x = L
x = 0
20 cm Concrete barrier Waste material (saltstone) Soil
x = L
x = 0
20 cm
Concrete barrier
x = L
x = 0
Waste material (saltstone) 20 c m Concrete barrier
x = L
x = 0
Waste material (saltstone)
20
c
3.1 Concrete Mixtures
Two different concrete mixtures were used for the simulations. Mix 1 was made with Type I/II cement (60%) and slag (40%) at a water-to-binder ratio of 0.38. Mix 2 material is a quaternary mixture incorporating Type V cement (30%), slag (40%), Type F fly ash (23%) and silica fume (7%) prepared at a 0.38 water-to-binder ratio. The materials were cured in limewater before being tested at different ages. The chemical composition of the cementitious materials is provided in Table 1. The mix proportions and properties are summarized in Table 3.
Table 1. Chemical and physical characteristics of binders.
Oxides Type I/II cement Type V cement Slag Silica Fume Class F Fly Ash
CaO 64.3 63.0 35.8 0.50 1.41
SiO2 21.0 20.8 39.1 96.6 53.1
Al2O3 4.91 4.11 10.1 0.21 28.4
Fe2O3 3.50 4.32 0.36 0.18 7.99
SO3 2.64 2.36 1.99 <0.1 <0.10
MgO 0.95 2.40 12.6 0.28 1.00
K2O 0.37 0.57 0.27 0.50 2.99
Na2O 0.09 0.07 0.22 0.07 0.44
LOI 1.32 1.73 0 1.21 2.39
Specific gravity 3.27 3.29 2.99 2.32 2.36
3.2 Wasteform mixture
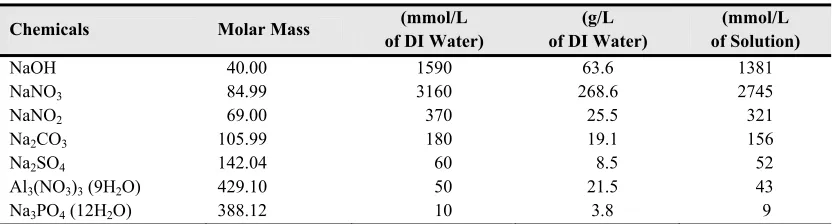
The wasteform was prepared at a water-to-binder ratio of 0.60 with Type I/II cement (10%), slag (45%) and fly ash (45%), and a high pH mixing solution detailed in Table 2.
Table 2. Wasteform mixing solution.
Chemicals Molar Mass (mmol/L
of DI Water)
(g/L of DI Water)
(mmol/L of Solution)
NaOH 40.00 1590 63.6 1381
NaNO3 84.99 3160 268.6 2745
NaNO2 69.00 370 25.5 321
Na2CO3 105.99 180 19.1 156
Na2SO4 142.04 60 8.5 52
Al3(NO3)3 (9H2O) 429.10 50 21.5 43
Na3PO4 (12H2O) 388.12 10 3.8 9
Samples were cast in cylinders (Ø100x100mm) for transport properties measurements and in cubic molds (40x40x40mm) for compressive strength measurements. For the initial curing phase, the samples were kept in molds and placed under a plastic sheet in the laboratory to maintain high relative humidity (RH) conditions. After three days, cubes and cylinders were carefully demolded and cured in the salt solution presented in Table 2. The proportions of the wasteform mixture are summarized in Table 3, chemical composition of the cementitious materials is provided in Table 1.
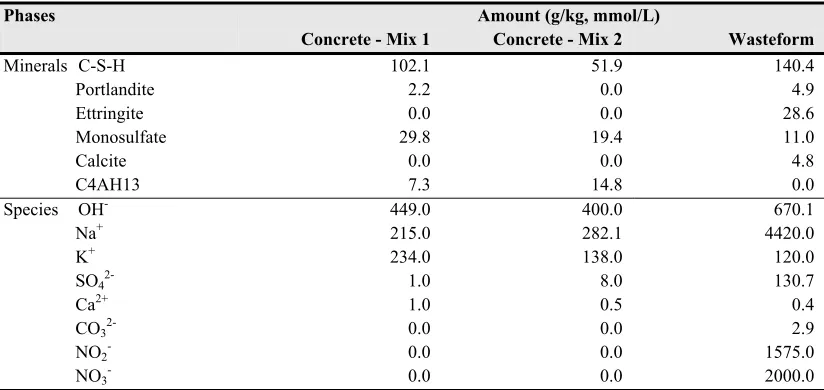
The properties of the wasteform given in Table 3 reflect the particular composition of this material. Similar to a hydrated cement paste prepared a high water to cement ratio (w/c) [
8
], the wasteform paste exhibits a high porosity. But the presence of slag, silica fume and fly ash lowers the tortuosity, so that the slurry has characteristics that a similar to those of a low w/c material.from the highly concentrated mixing solution. To estimate the initial set of hydration products, it was assumed that the species in the mixing solution are available for hydration. The results are given in Table 4, along with the pore extraction results.
Table 3. Properties of concretes and wasteform mixtures.
The chemical equilibrium of C-S-H is modeled on the basis of Berner’s approach [10] that assigns separate C/S-dependent equilibrium relationships to the Ca(OH)2 and CaH2SiO4 fractions of
this hydration product. The calculations thus start with a total amount of portlandite that is the sum of “real” portlandite (mentioned in Table 4) and a fraction of the C-S-H corresponding to 26.4% of their mass for calcium to silica ratio of 1.65.
Table 4. Initial mineral assemblage and pore solution.
Phases Amount (g/kg, mmol/L)
Concrete - Mix 1 Concrete - Mix 2 Wasteform
Minerals C-S-H 102.1 51.9 140.4
Portlandite 2.2 0.0 4.9
Ettringite 0.0 0.0 28.6
Monosulfate 29.8 19.4 11.0
Calcite 0.0 0.0 4.8
C4AH13 7.3 14.8 0.0
Species OH- 449.0 400.0 670.1
Na+ 215.0 282.1 4420.0
K+ 234.0 138.0 120.0
SO42- 1.0 8.0 130.7
Ca2+ 1.0 0.5 0.4
CO32- 0.0 0.0 2.9
NO2- 0.0 0.0 1575.0
NO3- 0.0 0.0 2000.0
*Batching solution detailed in Table 2.
Properties Units Concrete mixtures Mix 1 Mix 2 Wasteform WS
Water/binder ratio 0.38 0.38 0.60
Cement type ( - ) I/II V I/II
Cement (kg/m3) 255 121 94
Mineral admixture (kg/m3)
GGBFS 169 162 423
Fly ash (F) - 95 423
Silica fume - 27 -
Water (kg/m3) 162 152 564*
Fine aggregate (kg/m3) 691 548 -
Coarse aggregate (kg/m3) 1096 1111 -
Compressive strength 28d (MPa) 54.0 56.7 3.2
Porosity 91d (% vol.) 12.0 13.5 63.1
Tortuosity 28d ( - ) 0.0069 0.0027 0.0142
4 Simulation Results
The two-layer concrete/wasteform system was simulated over a 5,000 year period to predict the durability of concrete in contact with a sulfate bearing wasteform mixture.
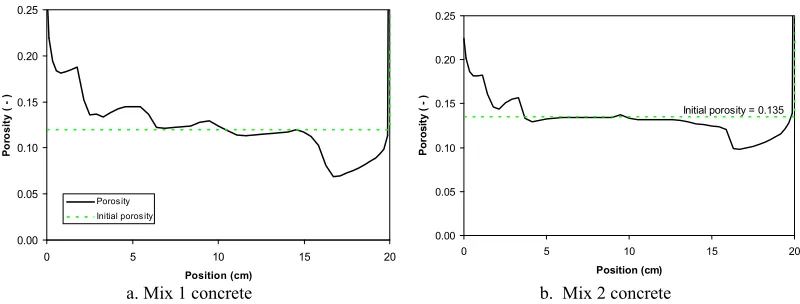
The solid phase distributions in mixes 1 and 2 concretes after 5,000 years of exposure to wasteform are shown on Fig. 2a&b. Overall, the mineral phase distribution predicted by the model for Mix 1 concrete is very similar to the phases predicted for Mix 2. In both cases, ettringite penetration due to the presence of sulfate in the wasteform is predicted by the model. This is accompanied by the dissolution of monosulfate. Also, the formation of monocarboaluminate is noted. The amount of ettringite formed is partly reduced because alumina is shared with monocarboaluminate. It should be noted that the dissolution of phases near the concrete/soil interface (x=0) due to leaching induced portlandite loss and decalcification of C-S-H. According to the model, complete decalcification (corresponding to the complete loss of portlandite) does not extend past 2-cm after 5,000 years.
Exposure to wasteform induced the penetration of an ettringite front but gypsum and thaumasite were not predicted even though they were included in the calculations as possible precipitates. The fact that no gypsum formation was predicted suggests a lower damage level in the material. Observations made on hydrated paste samples exposed to sodium sulfate solutions showed the presence of both ettringite and gypsum, and the later was intimately linked to the observed damage [8].
a. Mix 1 concrete b. Mix 2 concrete
Fig. 2. Solid phase distributions in both concrete mixes after 5 000 years
a. Mix 1 concrete b. Mix 2 concrete
Fig. 3. Porosity profile in concrete layers associated with the phase distributions of Fig. 2.
0 20 40 60 80 100 120
0 5 10 15 20 25 30
Position (cm) S o lid p h ase co n ten t ( g /kg ) Portlandite CaH2SiO4 Ettringite Monosulfate C4AH13 Calcite Monocarboal Concrete 0 20 40 60 80 100 120
0 5 10 15 20 25 30
Position (cm) S o lid p h ase co n ten t ( g /kg ) Portlandite CaH2SiO4 Ettringite Monosulfate C4AH13 Calcite Monocarboal Concrete Saltstone 0.00 0.05 0.10 0.15 0.20 0.25
0 5 10 15 20
Position (cm)
P
o
ro
s
ity ( - )
Porosity Initial porosity 0.00 0.05 0.10 0.15 0.20 0.25
0 5 10 15 20
Position (cm) P o ro si ty
The porosity profiles for both materials are also very similar (Fig. 3a and b). Since the total amount of sulfur and alumina is higher in the Mix 1 concrete, the extent of ettringite precipitation is greater, which translates into a more pronounced drop in porosity near the concrete/wasteform interface.
Near the soil interface, an increase of porosity was predicted, which is the result of dissolution of phases at this location.
5 Experimental investigations
An experimental program was devised to generate data that could help assess the validity of the results provided by the numerical simulations. Hydrated paste mixtures have been prepared and exposed to sulfate-bearing contact solutions.
5.1 Materials
Three hydrated cement pastes, identified as P1, P2, P3 having respectively a water-cement ratio of 0.50, 0.65 and 0.75, were prepared for the study. High w/c ratios were selected to limit the duration of the experiments by testing high-diffusivity materials.
Mixtures were prepared in a 2-liter mixer placed in a vacuum chamber in order to limit air bubble formation. Cylindrical specimens of 4 inches in diameter (Ø100×200mm or Ø4” ×8”) were cast from
each batch in accordance with the ASTM C305 procedure - Mechanical Mixing of Hydraulic Cement
Pastes and Mortars of Plastic Consistency. After casting, molds were sealed, placed horizontally in a
specially designed setup, and rotated on their axis during the first 24 hours after mixing in order to limit bleeding.
After rotation, the cylinders were demoulded and stored in a moist room (100% RH) during 4 years.
5.2 Contact solutions
The hydrated hardened cement pastes and mortars have been immersed for three and six months in two contact solutions presented in Table 5. The selected concentration level corresponds to a very severe exposure, according to the American Ccncrete Institute (ACI) [11], NaOH was used in one series to replicate the high pH conditions found in the wasteform pore solution.
Table 5. Contact solution compositions.
Concentrations (mmol/L)
Salts Series 1 Series 2
Na2SO4 150 150
NaOH 0 500
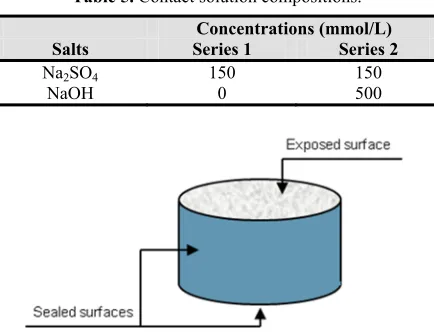
As presented on Fig. 4, 50-mm disks were cut from cylinders (Ø100x50mm) and sealed over all faces with wax except one flat surface. The samples were then immersed in the contact solutions. During the exposure period, the solution was renewed on a bi-weekly basis in order to maintain uniform conditions. Materials were removed from solutions after three and six months for analysis. P2 and P3 samples showed signs of spalling after three months in the Na2SO4-only solution. The
spalled material, around 2 mm in thickness, was brushed and set aside before analysis.
5.3 Sulfate content profiles
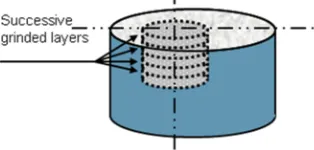
Samples removed from contact solution were milled over thin layers from the exposed surface, as schematized on Fig. 5. Each layer was 2-mm thick, and milling was performed over 10 layers. Spalled materials are included in this experimental analysis.
Powder from each layer was collected and dissolved in acid. The resulting solution was analyzed by ion chromatography to determine the sulfate content.
Fig. 5. Representation of successive milled layers from a test specimen
Sulfate profiles after three months in hardened cement pastes (P1, P2 and P3) exposed to solution 1 and 2 are presented in Fig. 6. Results are expressed in milligram of sulfate per gram of dried paste of the studied mixture. These measurements clearly showed that the presence of NaOH in solution 2 limits the formation of sulfate-bearing phases in the material, whereas the low-pH contact solution 1 profiles indicate that chemical reactions near the surface resulted in the formation of deleterious phases. This is in line with the presence of spalling on the surface of samples in solution 1, as mentioned previously. As expected, higher w/c ratios showed more sulfate ingress.
Fig. 6. Sulfate content in pastes immersed in solution 1 and 2 after three months
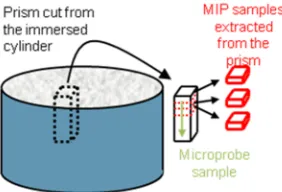
Microprobe measurements were performed on prisms extracted from samples, as schematized on Fig. 7. These sulfate profiles, presented in Fig. 8, also showed that the presence of NaOH in solution 2 limits the amount of sulfate in the material. Similar to the profiles showed in Fig. 6, a low amount of sulfur was measured in solution 2.
0 20000 40000 60000 80000 100000 120000 140000 160000 180000 200000
0.00 5.00 10.00 15.00 20.00 25.00 Position [mm] S u lf at e c o n ten t [ m g /kg ] P1_im1 P2_im1 P3_im1 0 20000 40000 60000 80000 100000 120000 140000 160000 180000 200000
5.4 Microstructure alterations
Mercury intrusion porosimetry (MIP) measurements have also been realized to quantity the pore structure evolution in the sample at different thickness. Samples used are extracted from cylinders presented on Fig. 4, which have been immersed in solutions presented in Table 5. As presented on Fig. 7, to analyze the evolution of the pore structure in the material, three layers of approximately two millimeters are extracted from a prism previously cut from the cylinder sample. The first layer corresponds to the initial first material millimeters, which have been exposed to the solution.
Fig. 7. Representation of Microprobe and MIP samples cut from an immersed cylinder
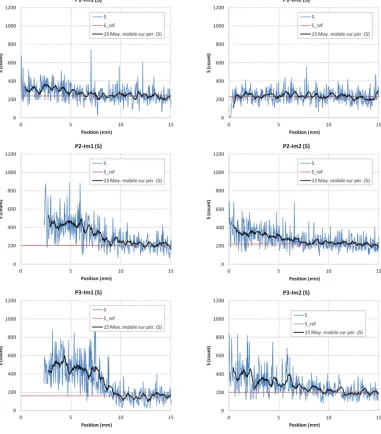
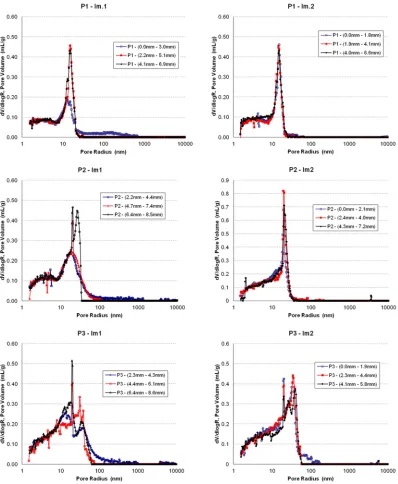
Fig. 9 presents Mercury Intrusion Porosity results for successive layers (detailed in Fig. 7) of hardened cement pastes (P1, P2, and P3) exposed to solution 1 (Im-1, left side) and solution 2 (Im-2, right side). The depth and thickness of each layer is mentioned in the legend on the associated figure.
As mentioned previously, the surface of P2 and P3 samples immersed in solution 1 was very degraded after more than 3 months of exposure. This layer was thus not available for MIP analysis. Fig. 9 shows that the first layer of the paste samples exposed to solution 1 had a different pore size distribution. The results indicate that larger pores were created in those layers closer to the surface. This pore volume may be associated with damage due to phase formation/dissolution and cracks generation. In addition, although a new pore volume appeared in larger pores [20nm-2μm], the MIP total pore volume measured from a layer to another remains almost unchanged. In fact, the porous volume associated to the pore range values [10nm-20nm] decreasedfor first thicknesses of materials exposed to the Na2SO4 solution. This observation seems to mean that a formation of phase(s) is
taking place there, leading to a deterioration of the material by opening a new porosity.
In the second contact solution (Na2SO4 + NaOH), no significant alteration to the pore structure
Fig. 9. MIP measurements for hardened cement pastes P1, P2, P2 immersed three months in solution 1 and 2, for three successive layers
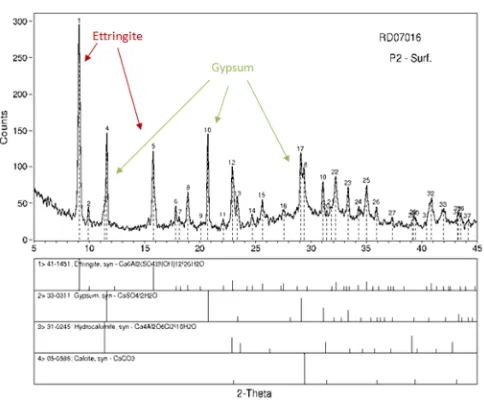
Fig. 10. XRD measurements on deteriorated surfaces for hardened cement pastes P2, immersed three months in solution 1
6 Conclusions
The paper presented the results of a study dedicated to the long-term performance of concrete barriers used in the context of nuclear waste storage. The work focused on the case of a cementitious wasteform immobilizing low-activity solutions and placed in direct contact with concrete. The high sulfate content of the wasteform pore solution was the main cause of concern for the durability of concrete barriers.
Simulations of the wasteform/concrete layered system were performed with a reactive transport model called STADIUM, using transport properties of concrete and wasteform mixtures prepared in laboratory conditions. The simulations predicted that despite the high sulfate concentration in the wasteform pore solution, the formation of deleterious minerals would likely not be very harmful to concrete. The high pH in the wasteform prevented the formation of gypsum in the concrete, [4,8,12]. No gypsum and limited formation of ettringite was also predicted by the model.
An experimental program was thus designed to validate the prediction of a lower quantity of expansive phase (such as gypsum and ettringite) in high pH. Hydrated paste samples prepared at different w/c ratios were immersed in highly concentrated sodium sulfate solutions. To mimic wasteform pore solution, one such sodium sulfate solution was also prepared with .5M NaOH, resulting in a high-pH contact solution.
The experimental results presented in the last section of the paper tend to confirm the numerical predictions. Profiles from two different techniques (layer-by-layer analysis of milled thin layer and microprobe) showed high sulfate content in cementitious materials exposed to pure Na2SO4 solution.
Exposure to the NaOH/Na2SO4 solution revealed much lower sulfate content. DRX and MIP
measurements showed that for samples immersed in pure Na2SO4 solution, expansive phases have been formed close to the exposure surfaces, leading to a pore structure modification. Surface scaling damage was observed in some lab samples. No such pore structure alteration was observed on materials immersed in high-pH Na2SO4 solution.
Acknowledgments
This paper was prepared with financial support by the U. S. Department of Energy, under Cooperative Agreement Number DE-FC01-06EW07053 entitled 'The Consortium for Risk Evaluation with Stakeholder Participation III' awarded to Vanderbilt University and support to the Savannah River National Laboratory, Savannah River Nuclear Solutions, LLC under Contract No. DE-AC09-08SR22470 with the U.S. Department of Energy. This research was carried out as part of the Cementitious Barriers Partnership supported by U.S. DOE Office of Environmental Management. The opinions, findings, conclusions, or recommendations expressed herein are those of the authors and do not necessarily represent the views of the Department of Energy or Vanderbilt University.
References
1. E. Samson, J. Marchand, Computers and Structures, 85:1740–1756 (2007).
2. M. Basista, W. Weglewski, Theoret. Appl. Mech. 35(1-3): 29-52 (2008). 3. J. Skalny, J. Marchand, Spon Press (2002).
4. R. Tixier, B. Mobasher, Journal of Materials in Civil Engineering, 15(4): 305-313 (2003).
5. C. A. Langton, D. S. Kosson, A. C. Garrabrants, K. G. Brown, SRNL-STI Waste Management,
Phoenix(USA) (2009).
6. E. Samson, J. Marchand, P. Henocq, and P. Beauséjour, Rilem Pro058, 65-78 (2008).
7. R.S. Barneyback, S. Diamond, Cement and Concrete Research, 11:279-285 (1981).
8. Y. Maltais, E. Samson, J. Marchand, Cement and Concrete Research, 34:1579-1589 (2004).
9. H. F. W Taylor, Cement Chemistry (1997).
10. U.R. Berner, Radiochimica Acta, 44/45, 387-393 (1988)
11. ACI Committee 318, Building Code Requirements for Structural Concrete, ACI 318-08 (2008).