University of Pennsylvania
ScholarlyCommons
Publicly Accessible Penn Dissertations
2017
Interfacial Assembly In Aqueous Two Phase
Systems
Sarah Danielle Hann
University of Pennsylvania, [email protected]
Follow this and additional works at:https://repository.upenn.edu/edissertations
Part of theChemical Engineering Commons, and theMechanics of Materials Commons
This paper is posted at ScholarlyCommons.https://repository.upenn.edu/edissertations/2324
For more information, please [email protected].
Recommended Citation
Interfacial Assembly In Aqueous Two Phase Systems
Abstract
Stabilizing bio-friendly and cyto-mimetic fluid structures has important implications for drug and gene delivery, micro bio-reactors, single cell and microniche studies, and as protocells. The majority of stabilization techniques have been developed for oil-in-water and water-in-oil emulsions, which have limitations in their application to biological systems due to the presence of the oil phase. The structures built in this thesis are therefore made within water-in-water dispersions. These all water dispersions are from aqueous mixtures of two polymers that demix to form two phases, termed aqueous two phase systems (ATPSs). ATPSs are comprised of two water-rich phases and are therefore excellent candidates for hosting or implantation within biological systems. In this thesis, challenges to stabilizing ATPSs are identified and discussed, including the ultra-low interfacial tension characteristic of these systems, and new strategies are developed to overcome such challenges. The first system studied is that of casein and xanthan (a protein and a polysaccharide) which undergoes spinodal decomposition, resulting in a transient bicontinuous structure. Colloids present in this phase-separating mixture attach at the water-water interface owing to capillarity, despite the low interfacial tension. This occurs for both living and passive colloids. The living colloids, Escherichia coli and
Pseudomonas aeruginosa bacteria, ultimately break down and restructure the bicontinuous matrix, indicating the bacteria can cooperate with the structure. The second system studied is the aqueous mixture of two polymers, poly ethylene glycol (PEG) and dextran. The PEG-dextran system is used to study emulsion stabilization techniques and understand the nuances of building materials at all water interfaces, specifically using polyelectrolyte complexation. In this study, oppositely charged polyelectrolytes are delivered from droplet and continuous phases to form a complex layer at the interface that stabilizes a water-in-water emulsion. Since the polyelectrolytes are soluble in both phases, successful interfacial complexation requires that polyanion and polycation fluxes be balanced such that they meet at, rather than around, the interface. Otherwise, non-stabilizing complexes are formed either inside or external to the droplet, far from the interface. This strategy is utilized to create microcapsules that can support a microbial community within the lumen. Interestingly, when one of the polyelectrolytes is replaced with a charged nanoparticle, the formation of stabilizing complexes is far less dependent on nanoparticle flux, as nanoparticles remain in the phase in which they are originally dispersed. Intriguingly, nanoparticle-polyelectrolyte complexation favors
spontaneous double emulsion formation; we name these structures AWE-somes as they are water emulsion bodies. The mechanism for their formation relies on the osmotic pressure imbalance between the droplet and continuous phases. The encapsulated double emulsion structure is reminiscent of membrane-less organelles within biological cells, which comprise internal membrane-less compartments enclosed by a permeable membrane. This motivates the study of transport within the AWE-some structures. Small and large molecules can diffuse into the lumen and selectively partition to the PEG or dextran phases inside the nanoparticle and polyelectrolyte membrane. One drawback of the nanoparticle-polyelectrolyte shell is less flexible than the membrane formed by the polyelectrolyte pair. To imbue the nanoparticle decorated capsules with both flexible membranes and spontaneous multiple compartments, compound capsules are fabricated in which the continuous phase initially includes both anionic polyelectrolyte and negatively charged nanoparticles. These compound capsules have tunable flexibility and stimulus responsive properties, which are important for fortifying the capsules for various biological environments. Future studies will include the incorporation of biological molecules including DNA and proteins to demonstrate further biological functionality.
Degree Type
Dissertation
Degree Name
Doctor of Philosophy (PhD)
Graduate Group
Chemical and Biomolecular Engineering
First Advisor
Kathleen J. Stebe
Second Advisor
Daeyeon Lee
Keywords
aqueous two phase system (ATPS), bio-friendly, colloidosome, interfacial complexation, microcapsule, polyelectrolyte
Subject Categories
Chemical Engineering | Mechanics of Materials
INTERFACIAL ASSEMBLY IN AQUEOUS TWO PHASE SYSTEMS
Sarah Danielle Hann
A DISSERTATION
in
Chemical and Biomolecular Engineering
Presented to the Faculties of the University of Pennsylvania
in
Partial Fulfillment of the Requirements for the
Degree of Doctor of Philosophy
2017
Co-Supervisor of Dissertation Co-Supervisor of Dissertation
__________________________________ __________________________________
Daeyeon Lee Kathleen J. Stebe
Professor of Chemical and Richer & Elizabeth Goodwin Professor of Biomolecular Engineering Chemical and Biomolecular Engineering
Graduate Group Chairperson
__________________________________
John C. Crocker
Professor of Chemical and Biomolecular Engineering
Dissertation Committee
Daniel A. Hammer, Alfred G. and Meta A. Ennis Professor of Bioengineering and Chemical and Biomolecular Engineering
INTERFACIAL ASSEMBLY IN AQUEOUS TWO PHASE SYSTEMS
COPYRIGHT
2017
iii
iv
ACKNOWLEDGEMENTS
The first people I must acknowledge are my fearless co-advisors, Kate Stebe and
Daeyeon Lee. Each time someone asks me who my “real” advisor is, I gratefully reflect
on the truly collaborative and inspired team we have become over my five years at Penn.
As the original “Stebe-Lee” group member, we didn’t know what to expect, but I am so
lucky to have been there for the start. Your availability and support have been
insurmountable to my development not only as a researcher, but as a person. I strive to be
the type of mentor you both have been to me and I will look back on my time as a
graduate student fondly due to your diligent leadership.
I would also like to thank my committee members, Dan Hammer and Rob Riggleman, for
spirited discussions, brainstorming, and helpful criticism along the way to writing this
thesis. I appreciate your openness to share your respective expertise that helped craft our
thinking and inspire our next steps in taking on this new project.
My time at Penn would not have been nearly as enjoyable, let alone successful, without
the support of the many colleagues and friends I have had the pleasure of interacting
with. Being a part of two labs meant I had twice the number of people to brainstorm with
and be inspired by, and each one has had an impact on my work. To the many Post-docs,
PhDs, Masters, and Bachelors students with whom I have crossed paths: thank you.
Thank you to the many people from the Lee and Stebe Labs including: Kwadwo, Lei,
Teresa, Sang-Wook, Zaki, Weifeng, Elio, Zach Y., Zach S., Alex, Rohini, Jacob,
v
Tagbo, Laura, Yuanchi, Katie P., Gang, Jyo Lyn, David, Wei-Han, Zhiwei, Neha,
Giuseppe, Syung Han, Renjing, Katie R., Sam, Nima, Francesca, Mohamed, Marcello,
Lu, Ningwei, Liana, Iris, Yimin, Lisa, Tianyi, Ali, and Arvind. Especially thanks to Nate
with whom I shared an office for five years, an apartment for two, and never turns away
from a brainstorming session.
To gain clarity in lab, sometimes one must leave it, and leaving lab to play (and win)
various sports leagues has been a particularly memorable opportunity. Thank you to the
many teammates in Softball, Kickball, and Frisbee, especially Melissa, Jason, Berger,
Cory, Nick, Ben, Mike, Chris, Brad, David, Ian, Julie, Lindsey, and Ellen.
Lastly, I would have never started nor lasted on this journey without the support of my
family, Jo Ann, Todd, Bradley and Chris, or fiancé, Brandon. Thank you all for being so
understanding of my sometimes difficult schedule and making sure that in between
writing papers and being in lab, I never lost sight of the end goal. I appreciate each of you
vi
ABSTRACT
INTERFACIAL ASSEMBLY IN AQUEOUS TWO PHASE SYSTEMS
Sarah Danielle Hann
Daeyeon Lee and Kathleen J. Stebe
Stabilizing bio-friendly and cyto-mimetic fluid structures has important implications for
drug and gene delivery, micro bio-reactors, single cell and microniche studies, and as
protocells. The majority of stabilization techniques have been developed for oil-in-water
and water-in-oil emulsions, which have limitations in their application to biological
systems due to the presence of the oil phase. The structures built in this thesis are
therefore made within water-in-water dispersions. These all water dispersions are from
aqueous mixtures of two polymers that demix to form two phases, termed aqueous two
phase systems (ATPSs). ATPSs are comprised of two water-rich phases and are therefore
excellent candidates for hosting or implantation within biological systems. In this thesis,
challenges to stabilizing ATPSs are identified and discussed, including the ultra-low
interfacial tension characteristic of these systems, and new strategies are developed to
overcome such challenges. The first system studied is that of casein and xanthan (a
protein and a polysaccharide) which undergoes spinodal decomposition, resulting in a
transient bicontinuous structure. Colloids present in this phase-separating mixture attach
at the water-water interface owing to capillarity, despite the low interfacial tension. This
occurs for both living and passive colloids. The living colloids, Escherichia coli and
vii
bicontinuous matrix, indicating the bacteria can cooperate with the structure. The second
system studied is the aqueous mixture of two polymers, poly ethylene glycol (PEG) and
dextran. The PEG-dextran system is used to study emulsion stabilization techniques and
understand the nuances of building materials at all water interfaces, specifically using
polyelectrolyte complexation. In this study, oppositely charged polyelectrolytes are
delivered from droplet and continuous phases to form a complex layer at the interface
that stabilizes a water-in-water emulsion. Since the polyelectrolytes are soluble in both
phases, successful interfacial complexation requires that polyanion and polycation fluxes
be balanced such that they meet at, rather than around, the interface. Otherwise,
non-stabilizing complexes are formed either inside or external to the droplet, far from the
interface. This strategy is utilized to create microcapsules that can support a microbial
community within the lumen. Interestingly, when one of the polyelectrolytes is replaced
with a charged nanoparticle, the formation of stabilizing complexes is far less dependent
on nanoparticle flux, as nanoparticles remain in the phase in which they are originally
dispersed. Intriguingly, nanoparticle-polyelectrolyte complexation favors spontaneous
double emulsion formation; we name these structures AWE-somes as they are water
emulsion bodies. The mechanism for their formation relies on the osmotic pressure
imbalance between the droplet and continuous phases. The encapsulated double emulsion
structure is reminiscent of membrane-less organelles within biological cells, which
comprise internal membrane-less compartments enclosed by a permeable membrane.
This motivates the study of transport within the AWE-some structures. Small and large
molecules can diffuse into the lumen and selectively partition to the PEG or dextran
viii
nanoparticle-polyelectrolyte shell is less flexible than the membrane formed by the
polyelectrolyte pair. To imbue the nanoparticle decorated capsules with both flexible
membranes and spontaneous multiple compartments, compound capsules are fabricated
in which the continuous phase initially includes both anionic polyelectrolyte and
negatively charged nanoparticles. These compound capsules have tunable flexibility and
stimulus responsive properties, which are important for fortifying the capsules for various
biological environments. Future studies will include the incorporation of biological
ix
TABLE OF CONTENTS
ACKNOWLEDGEMENTS ... iv
ABSTRACT ... vi
TABLE OF CONTENTS ... ix
LIST OF TABLES ... xi
LIST OF FIGURES ... xii
CHAPTER 1. Introduction... 1
1.1 Motivation: Stabilization of Water-Water Mixtures ... 1
1.2 Background ... 2
1.2.1 Self-Assembly at Fluid Interfaces ... 2
1.2.2 Aqueous Two Phase Systems (ATPS): Water-water interface ... 3
1.2.3 Polyelectrolyte Complexation ... 4
1.3 Objectives and Outline ... 5
CHAPTER 2. Trapping and Assembly of Living Colloids at Water-Water Interfaces ... 7
2.1 Introduction ... 7
2.2 Materials and Methods ... 9
2.2.1 Stock Solution Preparation ... 9
2.2.2 Sample Cell Preparation ... 9
2.2.3 Bacteria Preparation ... 10
2.2.4 Solution Preparation... 11
2.2.5 Sample Imaging ... 11
2.3 Results and discussion ... 12
2.3.1 Living colloids at the interface ... 12
2.3.2 Inert colloids at the interface... 17
2.4 Conclusions ... 22
CHAPTER 3. One-Step Generation of Cell-Encapsulating Compartments via Polyelectrolyte Complexation in an ATPS ... 24
3.1 Introduction ... 24
3.2 Materials and Methods ... 27
3.2.1 Materials ... 27
3.2.2 Solution preparation ... 27
3.2.3 Polyelectrolyte complexation in pendant drops ... 28
3.2.4 Capsule formation via electrospray ... 28
3.2.5 Triggered release tests... 29
3.2.6 Bacterial culture capsules ... 30
3.3 Results and Discussion ... 30
3.3.1 Polyelectrolyte complexation in aqueous two phase system (ATPS) ... 30
3.3.2 Stimuli-responsive properties of polyelectrolyte microcapsules ... 42
x
3.4 Conclusion ... 47
CHAPTER 4. All Water Emulsion-bodies (AWE-somes) with Permeable Shells and Selective Compartments ... 49
4.1 Introduction ... 49
4.2 Experimental Section ... 51
4.2.1 Materials ... 51
4.2.2 Solution Preparation... 52
4.2.3 Pendant Drop ... 52
4.2.4 AWE-some Fabrication ... 53
4.2.5 Fluorescent PEG Permeation ... 53
4.2.6 Small Molecule Diffusion ... 53
4.3 Results and Discussion ... 54
4.3.1 Spontaneous Double Emulsion AWE-some Formation ... 54
4.3.2 AWE-some Shell Permeability and Compartmentalization ... 61
4.3.3 AWE-some Compartmentalized Reaction ... 64
4.4 Conclusion ... 66
CHAPTER 5. Tuning Interfacial Complexation in ATPS with Polyelectrolytes and Nanoparticles for Compound AWE-somes ... 68
5.1 Introduction ... 68
5.2 Experimental Methods and Materials ... 69
5.2.1 Materials ... 69
5.2.2 Solution Preparation... 69
5.2.3 Microcapsule Fabrication and Characterization ... 70
5.3 Results and Discussion ... 70
5.3.1 Microcapsules via Interfacial Complexation in ATPS ... 70
5.3.2 Tuning the Mechanical Robustness of the Shell ... 77
5.3.3 Tuning the pH Responsive Properties of Microcapsules ... 80
5.4 Conclusions ... 82
CHAPTER 6. Summary and Outlook ... 83
6.1 Introduction: Compartmentalization in nature ... 83
6.2 Molecular confinement: self-assembly within cells ... 84
6.2.1 Creating ATPS droplets and dispersions ... 89
6.2.2 Stabilizing ATPS droplets... 92
6.2.3 Stabilized ATPS droplets as cell mimics ... 97
6.3 Cellular-scale confinement: Cellular (micro)niches ... 98
6.4 Conclusions and Outlook ... 101
Appendix 1. Experimental Methods: Extra Information ... 105
A1. All-Aqueous Electrospray ... 105
A2. Minimalist Media ... 108
xi
LIST OF TABLES
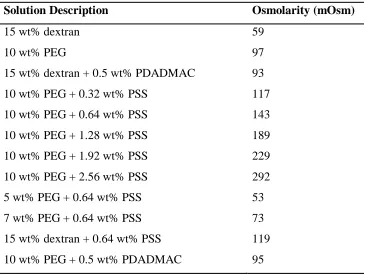
Table 1. Osmotic pressure measurements for relevant solutions used within this study... 37
Table A1.1. Components in Minimum Media Supplement (MMS) used as vitamin source in bacterial encapsulation. ... 108
xii
LIST OF FIGURES
Figure 2.1. Schematic of experimental setup. Casein-xanthan suspension was enclosed in a PDMS cell on top of a coverslip. Total sample thickness was 500 μm. Imaged on inverted confocal laser scanning microscope (CLSM). ... 10
Figure 2.2. WT E. coli in casein-xanthan. Casein is stained red with Rhodamine B and E. coli is stained in green with SYTO 9. (A) Immediately after mixing, arrows showing free bacteria. (B) 16 h after mixing. (C) 24 h after mixing. (D) 40 h after mixing. (E) 7 d after mixing. (A-E) 20 μm above cover slip. (F) Projection of scan from top, 40 h after mixing. All scale bars 50 μm. ... 14
Figure 2.3. Non-motile, GFP E. coli in casein-xanthan mixture. Casein is stained red by rhodamine B and the E. coli is green. (A) Immediately after mixing. (B) 24 h after mixing. (C) 48 h after mixing. (D) Inset of (C). (E) Growth curve of GFP E. coli in 2 wt% casein solution (■) and 0.08 wt% xanthan (♦) in PBS, at 22 °C, measured by agar plating method. (A-D) taken 20 μm above cover slip, scale bar 50 μm. ... 15
Figure 2.4. Time progression of P. aeruginosa (PA01) imaged in CLSM 20 μm above coverslip. Casein is stained with Rhodamine B and PA01 is stained with SYTO 9. (A) Immediately after mixing (B) 16 hours after mixing (C) 40 hours after mixing. All scale bars are 50 μm. ... 16
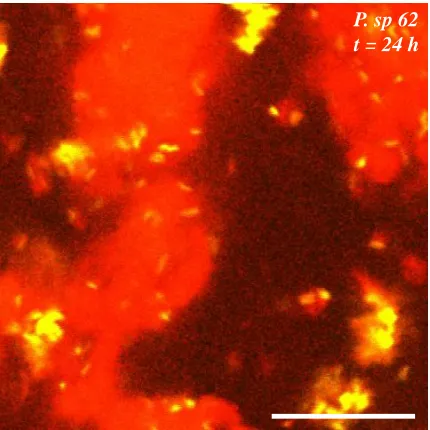
Figure 2.5. Image of Pseudomonas sp. 62 in 2 wt% casein, 0.08 wt% xanthan solution 20 μm above coverslip. Scale bar 20 μm. ... 17
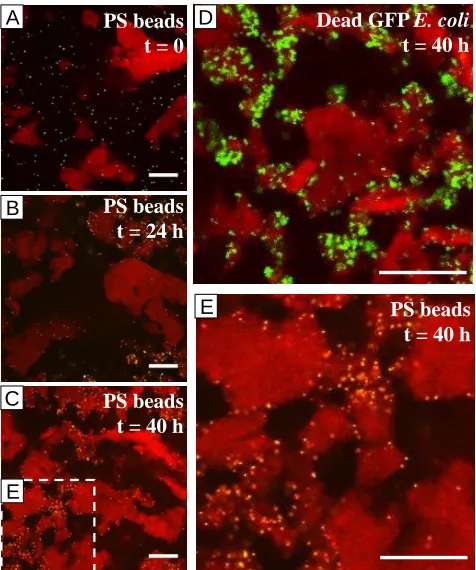
Figure 2.6. Inert colloids in casein-xanthan phase separating system imaged by CLSM. Casein is stained red by Rhodamine B, green are green fluorescent polystyrene (PS) beads (A,B,C,E) or spectinomycin-killed GFP E. coli (D). (A) PS beads immediately after mixing. (B) PS beads 24 h after mixing. (C) PS beads 40 h after mixing. (D) Dead GFP E. coli 40 h after mixing. (E) Inset of (C). All slices from 20 μm above glass, scale bars 50 μm. ... 19
Figure 2.7. (A) Sequence of pendant drop experiment, drop fluid is 10 wt% casein, bulk fluid is 0.1 wt% xanthan, both filtered with 5 μm filter, scale bar 200 μm. (B) Sequence of pendant drop experiment, drop fluid is 10 wt% casein; bulk fluid is DI water, scale bar 200 μm. (C) PS beads in 2 wt% casein solution (no xanthan) 40 h after mixing. (D) GFP E. coli in 2 wt% casein solution (no xanthan) 40 h after mixing. (C) and (D) taken 20 μm above cover slip; casein is red, colloids are green; scale bar 50 μm. ... 20
xiii
Figure 3.1. (left) digital images of microdialysis cell (right) Schematic depiction of microdialysis cell used to dialyze water against capsules to remove wrinkles. ... 29
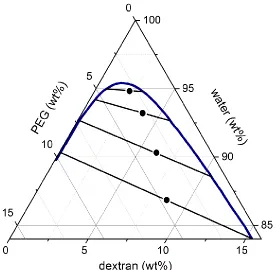
Figure 3.2. Ternary phase diagram of MW 20,000 PEG–MW 500,000 dextran–water: Adapted with permission from Diamond, A. D. and Hsu, J. T. “Phase Diagrams for Dextran-PEG Aqueous Two-Phase Systems at 22C”. Biotechnology Techniques. 1989, 3 (2), 119–124. Copyright 1989 Springer. ... 31
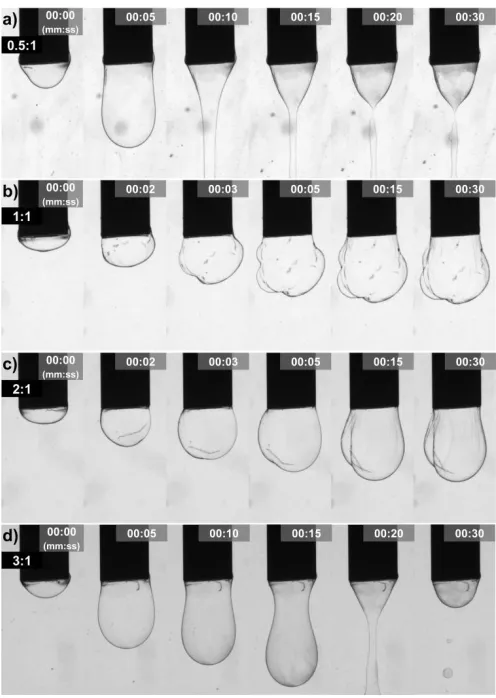
Figure 3.3. Injection of 1 μL 15% dextran/0.5% PDADMAC into 10% PEG with various concentrations of PSS. a) 0.5 PSS:1 PDADMAC ratio injected over 30s. b) 1:1 c) 2:1 d)3:1. Needle diameter = 0.85 mm. ... 32
Figure 3.4. Schematic of flux balances near the PEG-dextran interface. ... 34
Figure 3.5. (a) Schematic illustration of electrospray setup. 15% dextran with polyelectrolyte(1) (PE1) is injected into a capillary device which is connected to (+ or -) electrode of a high voltage supplier. Droplets are pulled out of the capillary tip toward a 2 cm diameter copper ring that is connected to the opposing electrode. These drops are sprayed into a bath of 10% PEG with PE2, and the two PEs meet at the interface (zoom in). (b) A typical capsule made by electrospray with PE1 = 0.5% PDADMAC and PE2 = 0.64% PSS and dialyzed against water to fully inflate, inset is the capsule as made in original 10% PEG/0.64% PSS solution before dialysis. (c) PE1 = 0.5% PDADMAC, PE2 = 0.64% fluorescein-PSS (f-PSS) and encapsulated RD70 dye (red signal) imaged with confocal microscopy; inset is the fluorescence intensity of the f-PSS across the capsule along the green line. (d) PE1 = 0.64% f-PSS (green signal), PE2 = 0.5% PDADMAC and encapsulated RD70 dye (red signal) imaged with confocal; inset is the fluorescence intensity of the f-PSS across the capsule along the green line. All scale bars 100 μm. ... 35
Figure 3.6. a) Capsules/droplets made by electrospray with 15% dextran/0.5% PDADMAC in dispersed phase with varying amounts of PSS in the continuous 10% PEG phase. The molar charge ratios of PSS:PDADMAC are varied from 0.07:1 to 4:1 as labeled from left to right. b) Capsules/droplets made by electrospray with 15% dextran/0.64% PSS in the dispersed phase with varying amounts of PDADMAC in the continuous 10% PEG phase. The molar charge ratios of PDADMAC:PSS are varied from 0.1:1 to 4:1 as labeled from left to right. All scale bars are 100 μm. ... 38
Figure 3.7. a) Ternary phase diagram of MW 20,000 PEG and MW 500,000 dextran in water, with the binodal line represented by a blue solid curve. Data adapted from Diamond and Hsu.8 Black dot and line drawn are based on reported tie line compositions. Blue diamond (
xiv
sprayed into continuous phase of 64% glycerol/0.64% PSS, which have the same approximate viscosities of 15% dextran and 10% PEG, respectively. d-f) 15% dextran/0.5% PDADMAC sprayed into varied% PEG/0.64% PSS continuous phases. Top row images are the capsules/drops as made in their respective PEG phases. Bottom row images are these capsules/drops dialyzed against pure water. e-f) insets are fluorescence microscopy images showing encapsulated RD70 dye. All scale bars are 100 μm. ... 41
Figure 3.8. a) Bright field images of capsules/droplets made by electrospraying 15% dextran/0.5% PDADMAC into 10% PEG with varying amounts of PSS. i-iii) dialyzed against pure water from t = 0 – 72h. b) Measured intensity loss of RD70 dye over time due to net negative osmotic stress. Error bars are standard error of average intensities of at least 8 capsules per time point. c) 0.5:1 capsules, dialyzed in water, salt added at t = 0. d) Time lapse of 0.5:1 capsule due to exposure to 100 mM NaCl. e) Time lapse of 0.5:1 due to exposure to 500 mM NaCl. Error bars are standard deviation of average fluorescent intensity from the single capsules shown. All scale bars 100 μm. ... 43
Figure 3.9. 15% dextran, 0.64% PSS, PAO1 culture, and media were electrosprayed into a 10% PEG, 0.5% PDADMAC solution, then moved to a 15% dextran, 25% media bath and incubated at 37°C. Cells are stained with SYTO 9 (green signal, all cells) and propidium iodide (red signal, dead cells) per the Live/Dead staining protocol. a) Initial time scan imaged with CLSM, areal cell density of 1.7x10⁻³ cells/μm2. b) Bacterial microcapsule imaged 24h post incubation, areal cell density of 1.9x10⁻² cells/μm2. All scale bars 100 μm. ... 46
Figure 3.10. Absorbance measured at 630 nm of PAO1 cultures with varying amounts of PSS or PDADMAC, normalized by initial intensity, Io. Black square curve has no polyelectrolyte. ... 47
Figure 4.1. Schematic of spontaneous double emulsion AWE-some formation. (a) Initial placement of NP and PE in ATPS. PEG- and dextran-rich phases form the exterior and dispersed phases of ATPS. (b) Schematic of interface from (a). (c) Optical micrographs of microcapsules made with 22 nm diameter SiO2 at i) 4% ii) 5% and iii) 10%. The concentration of PDADMAC in the dextran phase is kept constant at 0.5%. (d) Fluorescently-labelled components are included during formation of double emulsion microcapsules. f-PEG: Rhodamine tagged PEG (MW = 20 000). f-dex: False colored, Rhodamine tagged dextran (MW = 70 000). f-NP: False colored, 18 nm diameter TRITC core-SiO2 NPs. Insets are corresponding bright field images. Bottom right: Illustration showing the final location of each component upon formation of AWE-somes. All scale bars 100 μm. ... 55
Figure 4.2. SEM micrograph of 0.5% PDADMAC/4.5% NP microcapsule. (a) Scale bar 100 μm,
xv
Figure 4.3. In situ observation of encapsulated double emulsion formation using the pendant drop method. Injection of 0.5 μL 15% dextran/ 0.25% PDADMAC drop at a rate of 1 μL/s into 10% PEG/22 nm NPs. (a) Schematic of initial state. (b) Time evolution of hanging drop with 2% SiO2 in the PEG phase up to 4 minutes post-injection. (c) Time evolution of hanging drop with 4% SiO2 in the PEG phase up to 5 minutes post-injection. (d) Schematic of final state of hanging drops. Needle diameter = 0.85 mm. ... 58
Figure 4.4. Hypothesized mechanism behind PEG drop inclusion and projected areal fraction of PEG drop inside AWE-some. (a) Initial state of dextran drop containing only PDADMAC and has osmotic pressure, Πdex. PEG phase initially contains only SiO2 NPs and has osmotic pressure, ΠPEG, where ΠPEG > Πdex. (b) Short times post-introduction, NPs and PDADMAC form a porous, rigid complex at the interface. In this initial stage, water is driven out of the dextran phase due to the osmotic pressure gradient, which drives the PEG-phase inward due to the incompressibility of each phase on either side of the rigid membrane. (c) This exchange occurs until a later time, tf, where permeability is drastically reduced. (d) Plot of projected area of included PEG drop normalized by the projected are of the capsule as a function of NP concentration in the PEG phase. More than 100 AWE-somes are averaged for each data point and error bars are standard deviation. ... 60
Figure 4.5. Injection of 0.5 μL 15% dextran/4% 22 nm silica NPs at a rate of 1 μL/s into 10% PEG and PDADMAC. (a) Schematic of initial state. (b) Time evolution of hanging drop with 0.5% PDADMAC post injection. (c) Time evolution of hanging drop with 5% PDADMAC up to 10 min post injection. (d) Schematic of final state of hanging drops. Needle diameter = 0.85 mm. ... 61
Figure 4.6. Schematic of osmotic driving force for NP/PE microcapsules. ... 61
Figure 4.7. Permeation of f-PEG (MW = 20 000) into AWE-somes. (a) Schematic of measurement geometry. (b) Representative fluorescent image of PDADMAC/22 nm NP AWE-somes measured 4 h after addition of f-PEG. (c) A different AWE-some measured after 24 h. Insets are corresponding bright field images. (d) Plot of concentration of f-PEG in the inner PEG drop normalized by that in the outer PEG phase as a function of time for AWE-somes made with 8 nm and 22 nm NP. All scale bars 100 μm. ... 63
Figure 4.8. Additional data to previous figure; measurement of PEG permeation into capsules by adding f-PEG to 5 mL continuous PEG phase and normalized by the mass of f-PEG. Legend descriptions indicate the size of silica NP used to form the capsule (nm) and the amount of f-PEG added to the 5 mL solution (mg). All capsules were made for inner PEG drop fractions of 0.25 except ( ), which is made to a fraction of 0.05. Data designated as ‘aged’ (
, ) are capsules that were made 1 week prior to adding f-PEG. Mass ‘mg’ in legend refers to the amount of f-PEG added to the 5 mL continuous PEG phase... 64
xvi
Rhodamine B added to PEG phase, found predominantly in PEG phases. Insets are bright field. (c) 10 μL NaClO is added to 500 μL of outer PEG phase approximately 1 cm away from monitored capsule. Within 2 minutes, signal from f-PEG is quenched inside the AWE-some. (d) Bright field images of AWE-some in (c). All scale bars 100 μm. ... 65
Figure 4.10. Confocal image of microcapsule fabricated with 15% dextran/0.5%
PDADMAC/1μM rhodamine tagged lysozyme into 10%PEG/4.5% 22 nm silica NPs. (a) Fluorescent image, where red is the rhodamine tagged lysozyme. (b) Corresponding bright field image. Scale bar is 100 μm. ... 67
Figure 5.1. Schematic of initial and final configurations of PE/PE, PE/NP, and PE/(PE,NP) (compound) capsules. All droplet phases are 15% dextran and 0.5% PDADMAC. Left column: PE/PE capsules, as presented in Chapter 3. Outer phase is 10% PEG and various concentrations of PSS. Center column: PE/NP capsules (AWE-somes), as presented in Chapter 4. Outer phase is 10% PEG and various concentrations of 22 nm SiO2 NP. Right column: Schematic of compound PE/(PE,NP) capsules presented in this chapter. Outer phase is 10% PEG and various concentrations of both PSS and SiO2 NP. Scale bars are 100 μm. ... 73
Figure 5.2. Optical images of microcapsules made with varying outer phase compositions. All droplet phases are 15% dextran and 0.5% PDADMAC. The outer phase is 10% PEG with 0, 0.1, 0.5, 1%, or 2% PSS (columns, left to right) and 0, 2, or 4% 22 nm diameter SiO2 NP (rows, top to bottom). Wrinkly capsules indicate good membrane formation (wrinkles are due to osmotic compression of the capsule). Double emulsion AWE-somes [PE0.5/NP2, PE0.5/(PE0.1,NP2), PE0.5/NP4, PE0.5/(PE0.1,NP4)] contain included PEG drop in the lumen of the capsule. Scale bars are 100 μm and apply to all images. ... 74
Figure 5.3. Representative compound microcapsules fabricated with fluorescently labelled PSS and TRITC-core SiO2 NPs. PE0.5/(PE0.1,NP2) microcapsules with (a) f-PSS and (b) f-NP. PE0.5/(PE1,NP4) microcapsules with (c) f-PSS and (d) f-NP. (e) Laser intensity of (d) increased 300%. Insets (a-d) are corresponding bright field images. Scale bars are 100 μm. ... 76
Figure 5.4. Release of encapsulated dextran in response to negative osmotic stress. Microcapsules fabricated with fluorescent dextran (f-dex, Cargo) are washed with pure DI water through microdialysis cells. (a) Schematic of experiment geometry. (b-f) Optical micrographs of capsules after 24 h dialysis. Scale bar is 100 μm and applies to all images. (g) Measured release of f-dex normalized by initial intensity over time. Decrease in intensity indicates loss of encapsulated dextran. Final intensity (I/Io) of 0.4 is the equilibrium final signal of an empty shell (residual signal is from f-dex incorporated in the shell. ... 78
xvii
Figure 5.6. PE/PE, PE/NP, and compound PE/(PE,NP) microcapsule response to pH stimulus. Microcapsules (fabricated at pH 9) were washed with 15% PEG to remove external complexing agents, then subjected to different pH 15% PEG solutions (columns, left to right). PE0.5/PE0.5 capsules (top row). PE0.5/NP2 AWE-somes (middle row). PE0.5/(PE0.1,NP2) AWE-somes (bottom row). Complete capsule dissolution occurs for PE0.5/NP2 capsules at pH 3. Rightmost column is confocal image series of f-NP in PE0.5/(PE0.1,NP2) capsules at pH 3. Some NP remain in shell (white arrows) while some NP are dissolved off the shell (green arrows). Scale bars 100 μm. ... 81
Figure 6.1. Lipid stabilized PEG/dextran ATPS emulsion. (a) Emulsion formation scheme. (b) Transmitted light (Left) and fluorescent images of emulsion droplet, prepared with rhodamine-tagged lipid (center) and fluorescein-tagged streptavidin (right). Scale bar = 10 μm. Reprinted with permission from Ref 106... 87
Figure 6.2. Demonstrated protein partitioning and RNA cleavage reaction within liposome-stabilized ATPS. (a) Fluorescent human serum albumin (HSA, green channel) is localized in the PEG-rich phase at pH 6.5 and partitions to the dextran-rich phase upon an increase to pH 12. Red fluorescence is rhodamine-tagged lipid. Scale bar is 5 μm. (b) Measured partitioning coefficient (ln K) with respect to time after pH change, negative ln K indicates PEG-phase affinity, positive ln K indicates dextran-phase affinity. (a)-(b) Reprinted with permission from Ref 108. (c) Initial fluorescein channel image and (d) 30 min after reaction has started, demonstrating an increase in donor intensity in the PEG-rich phase. (e) Rhodamine channel at t = 30 min, includes acceptor fluorescence and liposome tags. Scale bar is 25 μm, applies to (c)-(e). (f) Fluorescence emission spectra (Ex: 488 nm) from PEG-rich phase, which come both from a decrease in quenching (due to the reaction) and an increase in PEG-phase concentration due to re-partitioning. (g) Reaction progress monitored in PEG-rich phase by summing intensity from 520 and 530 nm to capture donor peak, without lipid-membranes (red data), with lipid membranes (blue data), and without enzyme degradation (no reaction, black line). (c)-(g) Reprinted with permission from Ref 21. ... 88
xviii
glass capillary device, which is then pulled out into the continuous phase through an oppositely charged electrode. Reprinted with permission from Ref 40. ... 91
Figure 6.4. Microcapsule and microgel formation from strong and weak polyelectrolytes generated by AAE. (a) Schematic of microcapsule formation from interfacial complexation. (b) Optical and SEM images of (1-2) PSS and poly(allylamine hydrochloride) (PAH) and (3-4) PSS and PDADMAC. Scale bars 300 μm. (c) Confocal images of PSS-PAH capsules with varying shell thicknesses based on varying PE concentration, plotted in (d) Fluorescent signal is from FITC-PAH. Scale bars 50 μm. (e) Schematic of microgel particle formation based on internal complexation. (f) Optical micrograph of PAH-PSS microgel particle. (g) Confocal image of PAH-PSS particle fabricated with FITC-PAH. Scale bars 100 μm. Reprinted with permission from Ref 91. ... 94
Figure 6.5. Polyelectrolyte complexation in middle aqueous phase within a water-in-water-in-water double emulsion. (a) Schematic of glass capillary microfluidic device used to fabricate microcapsules. (b) Optical micrograph of droplet breakup. (c) Illustration of complexation of PDADMAC and PSS occurring in the middle water phase, the ‘complexation zone’. (d) Optical micrograph of final capsules. (e) Fluorescent image of capsule shells labeled with ethidium homodimer. Reprinted with permission from Ref 116. ... 95
Figure 6.6. Cell partitioning as a function of interfacial tension in the PEG/dex ATPS. (a) Schematic of experimental setup. (b)-(c) Cell partitioning behavior for two different cell types as a function of interfacial tension. Reprinted with permission from Ref 11. ... 100
Figure A1.1. First assembly step of capillary device (top view)... 106
Figure A1.2. Second assembly step of capillary device (side view). ... 106
Figure A1.3. Optical micrographs of PE/PE microcapsules made at different syringe pump flowrates. Capillary tip diameter 150 μm, applied voltage 3500 V. Larger flowrates result in larger droplets, all else constant. ... 107
1
CHAPTER 1.
Introduction
1.1 Motivation: Stabilization of Water-Water Mixtures
As a liquid transforms from an initially miscible single phase to a final two phase state, it
presents a variety of intermediate structures along the path to complete phase separation.
The morphology of such intermediate structures is determined by the path taken into the
phase separated region. For example, a binary liquid system that is thermally quenched
into the two phase region through the critical point will undergo phase separation by
creating a bicontinuous structure, often referred to as spinodal decomposition.
Alternatively, two phases can be mixed to create an emulsion with one phase dispersed in
the other that would ultimately coarsen over time to form two macroscopically separated
phases. By stabilizing these intermediate structures, either kinetically or
thermodynamically, multiphasic liquid mixtures with high surface areas can be produced.
Such stabilized multiphasic mixtures are important in a number of applications for
encapsulation and delivery that range from using encapsulated fluids as microreactors to
micro-niche studies for biological cells. Although stabilization techniques are well
developed for oil-water based systems, their applicability to many biological or
environmental systems can be limited due to the presence of the potentially deleterious
oil phase. By replacing the oil phase with another water phase, to create a water-water
system, stabilized multiphasic mixtures for applications in drug/gene delivery, micro
bio-reactors, nano-cultures, and cell-mimetic studies can be prepared that allow sequestration
2
structures in an all-aqueous environment by identifying and addressing key challenges in
the stabilization of water-water systems to enable their applications in biologically and
environmentally relevant settings.
1.2 Background
1.2.1 Self-Assembly at Fluid Interfaces
Fluid interfaces exist between two phases that are immiscible; the energy associated with
these interfaces is characterized by the surface tension. The total energy contribution
from the interface scales as the product of the surface tension and the interfacial area.
Therefore, to minimize the energy of the system, the lowest energy state is one with the
lowest interfacial area, or a macroscopically phase separated state.
Another way to reduce the interfacial area is to introduce a third component before or
during phase separation. With the appropriate chemistry, the third component, which can
comprise nanoparticles or other colloids, accumulates at the interface between the two
immiscible phases, thereby reducing the interfacial area. The thermodynamically-driven
accumulation of particles at the interface is one means of self-assembly. The driving
force for self-assembly at the interface also scales as the product of the interfacial tension
and interfacial area taken up by the colloid, and is known as the trapping energy.
For typical oil-water systems, the trapping energy for individual particles of a range
of sizes can be 102-104 kBT, and these moieties will therefore be kinetically trapped at the
interface. In this trapped state, the interface is considered stabilized. These trapped states
3
When the oil phase is replaced with another water phase to create a water-water interface,
the interfacial tension is reduced significantly by up to 3-4 orders of magnitude, therefore
reducing the trapping energy. These special low tension interfaces will be the focus of
this thesis.
1.2.2 Aqueous Two Phase Systems (ATPS): Water-water interface
Water-water interfaces result from a special class of mixtures known as aqueous two
phase systems (ATPSs). ATPSs are aqueous mixtures of two
thermodynamically-incompatible, water-soluble components that can comprise two polymers, a polymer and
a salt, or a protein and a polysaccharide, among other combinations of hydrophilic
materials. The phenomenon was first observed in the late 1890s by microbiologists in a
system of gelatin-agar-water2 and later greatly expanded on in other ATPSs for use in
two-phase extraction schemes of biological molecules.3–5
The two primary characteristics of ATPS are an ultra-low interfacial tension (γ ≤ 10-1
mN/m) and a broad interfacial width.5–10 Both of these characteristics complicate
interfacial assembly of molecules and colloids. If allowed to equilibrate, ATPS phase
separation can take a day to relax; these prolonged timescales, attributable to the ultralow
tension and the relatively high viscosity of the mixture, are much longer than a typical
oil-water system. As stated in Section 1.2.1, the ultralow interfacial tension reduces the
trapping energy, and therefore the driving force, for particle attachment. The broad
4
because the two aqueous phases are interpenetrating near the macroscopic interface,
resulting in a diffuse interphase layer of about 7-10 nm.
Despite these challenges, researchers have developed a few techniques that enable
stabilization of ATPS. Transient stability has been imparted to ATPS to
compartmentalize biological materials.11–16 More stable interfacial assemblies involve
chemically distinct tri-block copolymers,17 flat nanoparticles (that are the approximate
width of the interface),18,19 or protein particles.20–22 Each of these techniques requires a
particular selection of materials based on the ATPS used, and a generalized approach and
understanding for stabilization has not yet been achieved.
1.2.3 Polyelectrolyte Complexation
One phenomenon that will be explored in Chapters 3-5 is that of interfacial
polyelectrolyte complexation. Polyelectrolytes (PEs) are charged polymers that dissociate
in solution; PEs are categorized as either ‘weak’ or ‘strong’. Weak PEs are polymers with
degrees of ionization that can be tuned by pH.23 Strong PEs will remain fully charged in
solution, regardless of pH; the PEs used in this thesis are all strong PEs. Polyelectrolyte
complexation occurs when two oppositely charged polymers are introduced in solution
and they associate driven by the entropy gain upon counter ion release.24 Once
complexed, the PEs form condensed entities whose structure and properties can be tuned
by stimuli such as pH (for weak PEs) or salt (for strong PEs).25–27
Polyelectrolyte complexation at interfaces has been studied extensively in the
5
sequentially added in a layer-by-layer process on solid surfaces.28–31 Recently,
water-in-oil emulsions generated within microfluidic devices have also been stabilized by PE
complexes to create PE microcapsules.32–34 Given their ionic nature, however, the
delivery of PE from the oil phase can present a major challenge, as charged species in
non-polar media require particular selection of material and potentially extra processing
steps, limiting the applicability of this technique.35
Here we introduce a nomenclature, PE/PE, in which any membrane-forming
components before the slash are introduced in the droplet phase, while those after the
slash are introduced in the external phase.
1.3 Objectives and Outline
The main objective of this thesis is to stabilize water-water interfaces, both bicontinuous
and emulsion-based, by understanding the interfacial phenomena associated with ATPS,
and in turn to fabricate biologically and environmentally friendly functional materials
using ATPS. This thesis explores the interaction of live bacteria with water-water
interfaces. Additionally, interfacial complexation of polyelectrolytes and nanoparticles is
explored to impart stability within an ATPS emulsion and to produce novel
compartmentalization systems. Lastly, a combination of techniques is used to modulate
capsule properties and demonstrate control over stabilized microcapsules.
Chapter 2 addresses the feasibility of assembling either microbes or microparticles at
the interface in a bicontinuous ATPS. This chapter describes and compares how live
6
Chapter 3 describes the polyelectrolyte complexation within ATPS and, in particular,
addresses the objective of understanding the nuances with working in these all-water
phases. Relevant transport effects are investigated and general rules for using PEs within
ATPS are described. Additionally, bacteria-containing microcapsules are created to
demonstrate the feasibility of using PE microcapsules as micro-niches or delivery
vehicles.
Chapter 4 builds on the PE/PE complexation in Chapter 3 by replacing one PE with a
nanoparticle (NP) (PE/NP). The change in complexing agent significantly changes the
structure and properties of the microcapsules; this chapter presents a mechanistic scheme
to explain these results. The potential of using these nanoparticle-containing (PE/NP)
microcapsules as protocells is demonstrated.
Chapter 5 combines the materials and mechanisms of Chapters 3 and 4 to show that
distinct structural and functional control over the all-aqueous microcapsules based on
ATPS can be achieved. We demonstrate that the structures and properties can be
precisely controlled and augmented through the inclusion of both PE and NP in the
continuous phase during capsule formation.
Chapter 6 summarizes the conclusions of this thesis and identifies opportunities and
7
CHAPTER 2.
Trapping and Assembly of Living Colloids at
Water-Water Interfaces
Reprinted (adapted) with permission from S. D. Hann, M. D. Goulian, D. Lee, K. J. Stebe. Trapping and assembly of living colloids at water-water interfaces. Soft Matter, 2015, 11, 1733-1738. Copyright (2015) Royal Society of Chemistry.36
2.1 Introduction
Fluid interfaces provide excellent environments to locate and organize particles, as
evidenced by the rich and rapidly evolving literature focusing on the interaction
and assembly of particles at interfaces.37–43 Pieranski’s seminal work demonstrated
the ability of interfaces to trap colloids, and the ability of the colloids at interfaces
to form phases and structures which can be modulated by tuning interparticle
interactions.44 This work has spawned numerous studies in which capillary
interactions and packing constraints are exploited to induce organization of
particles into two- and three-dimensional structures.42,45,46 When colloids are
present in systems of two immiscible fluids, they attach to the interface to lower
the interfacial area, thereby lowering the total system energy. In the case of
conventional oil-water systems, this interfacial energy is significant and leads to a
high trapping energy.44 Depending on the nature of interactions between the
immiscible fluids and the concentration of colloids, such systems can be stabilized
in a range of states ranging from Pickering emulsions1 and foams,47 to
8
Interfaces with far lower interfacial tension, formed, for example, by spinodal
decomposition, also trap particles at the interface, as has been exploited t o form
bicontinuous interfacially-jammed emulsion gels (bijels).50,51 We are particularly
interested in studying colloidal behaviour in all aqueous systems. Interactions
within these systems can be tuned to achieve a wide range of phase transitions,
including phase separated systems in which the two phases form via spinodal
decomposition.52 The resulting interfaces have an interfacial tension, albeit one
which is orders of magnitude lower than that in the more conventional oil-water
systems.7 Our interest stems from the potential for these systems to sustain living
species, opening the door to creating three dimensional structures using living
colloids such as bacteria cells.
The development of non-trivial structures to confine and organize living
colloids can have significant impact not only from a materials viewpoint, but also
from a fundamental perspective in the study of the dynamics of living colloids in
confinement. A rich literature is developing on the collective dynamics and self
-organization of bacteria swimming in confined systems, including quasi -2D
systems53, 3D confining systems54, and for bacteria trapped at/near fluid
interfaces.55–57 Aqueous two phase systems, such as those studied here, can allow
us to create soft, topographically complex, or, in the case of bicontinuous systems
or systems with interconnecting pathways, topologically complex systems in
which to confine bacteria to study their dynamics.
In this chapter, we have successfully trapped living bacteria at the interface
9
colloids, strongly suggest that these bacteria attach to the interface to lower the
interfacial area. These experiments serve as a proof of principle for this new
domain of materials which can be used as dynamic, phase separating vehicles for
studies in food science, medicine and materials science.
2.2 Materials and Methods
2.2.1 Stock Solution Preparation
Stock casein and xanthan were prepared following the procedures described in the
numerous phase separation studies.52,58,59 The casein, obtained from Fisher, was
used to prepare a 10 wt% solution; the casein was stirred with 0.1 wt% NaOH in
water at 55°C for 2 hours then stirred at room temperature for another 2 hours. The
stock xanthan, generously supplied by CP Kelco, (Keltrol – food grade xanthan
gum) was used to make a 0.2 wt% solution by mixing 0.1 M NaCl with the
xanthan in water and stirring at 70°C for one hour before stirring overnight at room
temperature. Both stocks were then kept at 4°C.
2.2.2 Sample Cell Preparation
The solutions were placed in a well formed within a polydimethylsiloxane (PDMS)
slab by using a rectangular mold, suitable for placement on a microscope stage.
The well holds 50 μL of solution, and is approximately 500 μm deep. It was filled
with the solution to be observed, and immediately sealed using a coverslip as a lid,
10
in a 100% humidity chamber to prevent evaporation, and wrapped in a protective
foil to prevent photo bleaching of fluorophores used to label various constituents.
Figure 2.1. Schematic of experimental setup. Casein-xanthan suspension was enclosed in a PDMS cell on top of a coverslip. Total sample thickness was 500 μm. Imaged on inverted confocal laser scanning microscope (CLSM).
2.2.3 Bacteria Preparation
Four species of bacteria were used in this study: Pseudomonas aeruginosa (PA01),
Pseudomonas sp.62, non-motile GFP-labelled Escherichia coli (MDG10 – a
derivative of MC4100), and motile WT E. coli (MG1655). All species were
cultured at room temperature in LB broth for 2 days. The bacteria were all
harvested in stationary phase and then stored at 4°C for 1 day. These bacterial
suspensions were then centrifuged and the pellet was re-suspended in phosphate
buffered saline (PBS) before adding to the sample solution.
We monitored both WT and GFP E. coli strains during various periods
throughout the phase separation at 20 μm above the coverslip for short periods of
time. These movies (Supplementary Information of Ref 36, movies S1-S3)
reiterate the free motion that the WT E. coli has immediately after mixing versus
11
24 hours after mixing. Once trapped at the interface, they do not swim. This lack
of motility is either because they are trapped at the interface and cannot move or
they have turned off their motility gene. No additional verification was done
investigating the gene expression through time. The lack of motion of the GFP E.
coli in Movie S3is shown as verification that we have used a non-motile strain.
2.2.4 Solution Preparation
The solutions and suspensions used in experiments were mixed approximately 20
min before t = 0. In all studies, the casein concentration was kept constant at 2
wt%. Xanthan was added at 0.08 wt% and the bacterial suspension was added at
about 0.01% solids. PBS was added to achieve the desired wt% after addition of
the stock solutions. 5 μL of a 0.05 wt% Rhodamine B (Fisher) solution was added
per 1 g sample. Green fluorescent polystyrene (PS) beads (1 μm diameter) from
Sigma were used for the non-bacteria experiment, also at 0.01% solids. For the
non-fluorescent bacteria, a 3 μL/100 mL SYTO 9 solution was also added at 50
μL/1 g solution. The solution was mixed on the vortex mixer for 3 pulses and
added to the PDMS cell. The final pH of the solution was approximately 6.3.
2.2.5 Sample Imaging
Solutions were imaged using confocal laser scanning microscopy (CLSM) on an
Olympus IX81. The 512 x 512 pixel images were taken using a 40X water
immersion lens excited by 488 nm and 543 nm lasers and collected through EGFP
12
2.3 Results and discussion
2.3.1 Living colloids at the interface
We exploit the aqueous phase separating system of casein and xanthan, which can
be tuned by varying the relative concentrations of each component.52,59 This
system is relatively well studied, as it is widely exploited in the form ulation of
foodstuffs such as dairy products.60 It is particularly interesting as a model system
to investigate the interactions between living colloids and interfaces because these
components are known to undergo spinodal decomposition under c ertain
conditions, in particular when the casein is a part of skim milk powder (SMP).52,58
We are working with solely casein and xanthan at concentrations near the
previously reported spinodal point; Rhodamine B dye was added to the mixture to
directly visualize the casein phase. Under these conditions, the system visually
resembles an interconnected, bicontinuous structure. Furthermore, the protein
phase has the potential to serve as a nutrient source for the bacteria in the system if
the bacteria possess the correct enzymes, which allows the possibility for the
bacteria to degrade and consume the structure over time.
We chose a wild type (WT) E. coli [MG1655] stained with SYTO 9 to
ascertain whether living colloids attach to the interface of this phase separating
casein-xanthan mixture. WT E. coli serves as an ideal model bacterium, as it has
been widely manipulated and exploited in the study of recombinant DNA
technology and as a host for production of recombinant proteins such as insulin.61
13
swimming in the casein-void regions, indicating that they are not immediately
driven to the interface (Movie S1). Following the progression shown in Figure
2.2B – D, the bacteria attach to the interface within 16 h. Their accumulation at
interfaces continues as the phase separation of the casein-xanthan mixture
progresses; after 40 h, they have filled a large portion of the casein-xanthan
interface. Figure 2.2F, a projection of the compiled 3-D scan taken with a confocal
laser scanning microscope (CLSM), gives clear evidence of bacteria at the
interface of the interconnected casein-xanthan phases. By allowing the system to
continue to evolve over one week post-mixing, we can see in Figure 2.2E that
there is barely any detectable red fluorescence remaining in the solution, indicating
a loss of localization of the casein phase. Since the samples are kept at room
temperature, the growth dynamics of the bacteria are slower than their typical
growth at 37 ˚C, which allows our system to evolve and the bacteria to interact
with its changing environment. At the end of one week, there were still live
bacteria, as verified by agar plating. The progression from Figure 2.2A-E indicates
the live bacteria are actively interacting with the matrix due to the segregation of
the casein phase. As a control, the SYTO 9 dye was added to the casein-xanthan
system devoid of bacteria; no increase or decrease in green or red fluorescence,
respectively, was observed over time.
An important question arises regarding the mechanism for the localization of
the bacteria at the interface. Since the bacteria may consume casein, it is plausible
that bacteria may swim toward the casein-rich interface via chemotaxis.62 To test
14
interface between casein-rich and xanthan-rich phases, we use non-motile GFP E.
coli [MDG10] as our living colloids in the same phase-separating system.
Figure 2.2. WT E. coli in casein-xanthan. Casein is stained red with Rhodamine B and E. coli is stained in green with SYTO 9. (A) Immediately after mixing, arrows showing free bacteria. (B) 16 h after mixing. (C) 24 h after mixing. (D) 40 h after mixing. (E) 7 d after mixing. (A-E) 20 μm above cover slip. (F) Projection of scan from top, 40 h after mixing. All scale bars 50 μm.
As shown in Figure 2.3, the non-motile bacteria attach to the interface within 24 h,
and the density of interface-trapped bacteria increases with time. When the system was
allowed to evolve for longer times, in addition to densifying, the casein-rich region
fluorescence again diminished as in the motile WT E. coli case. We confirm that these
non-motile GFP E. coli can survive on the casein by culturing them in a casein-added
PBS solution, where the casein serves as the only possible carbon and nitrogen sources.
As seen in Figure 2.3E, the bacteria have a slight increase in growth in the initial hours in
WT E coli 24 h
A
E F
WT E. coli
t = 0
WT E. coli
t = 7 d WT E. coli
t = 40 h
B
C D
WT E. coli
t = 16 h
WT E. coli
t = 24 h
WT E. coli
15
the casein solution and are able to maintain a relatively constant number over a week. In
contrast, the bacteria are not able to survive on the xanthan alone. Thus, once bacteria are
trapped at the interface, their ability to slightly degrade the casein likely contributes to the
subsequent long-time restructuring of the matrix.
Figure 2.3. Non-motile, GFP E. coli in casein-xanthan mixture. Casein is stained red by rhodamine B and the E. coli is green. (A) Immediately after mixing. (B) 24 h after mixing. (C) 48 h after mixing. (D) Inset of (C). (E) Growth curve of GFP E. coli in 2 wt% casein solution (■) and 0.08 wt% xanthan (♦) in PBS, at 22 °C, measured by agar plating method. (A-D) taken 20 μm above cover slip, scale bar 50 μm.
A
B
C
D
GFP E. coli t = 0
GFP E. coli t = 24 h
GFP E. coli t = 40 h
E
GFP E. coli t = 40 h
D 7.2 7.4 7.6 7.8 8.0 8.2 8.4 8.6 8.8 9.0
0 50 100 150 200
16
We also observe interfacial attachment of other bacteria, including
Pseudomonas aeruginosa (PA01) and Pseudomonas sp.62 in this casein-xanthan
system. For both species, the bacteria become trapped at the interface after ~16 h,
and the phase separated mixture coarsens. A key difference is that P. sp. 62 and
PA01 can actively break down and consume casein at higher rates than E. coli, so
the casein region diminishes more rapidly, Figure 2.4 and Figure 2.5. These results
clearly demonstrate that phase separating aqueous mixtures can induce attachment
of living colloids and sustain life, and that choosing specific bacteria strains affects
the lifetime and dynamics of the matrix.
Figure 2.4. Time progression of P. aeruginosa (PA01) imaged in CLSM 20 μm above
coverslip. Casein is stained with Rhodamine B and PA01 is stained with SYTO 9. (A) Immediately after mixing (B) 16 hours after mixing (C) 40 hours after mixing. All scale bars are 50 μm.
PA01 t = 0
PA01 t = 16 h
PA01 t = 40 h
A
B
17
Figure 2.5. Image of Pseudomonas sp. 62 in 2 wt% casein, 0.08 wt% xanthan solution 20 μm above coverslip. Scale bar 20 μm.
2.3.2 Inert colloids at the interface
Our results based on motile and non-motile E.coli suggest that chemotactic
motility is not necessary to induce the attachment to the interface. To ascertain
whether capillarity could be a likely mechanism, we estimate trapping energies
owing to capillarity, i.e., the energy associated with the reduction in the interfacial
energy owing to particle attachment. The trapping energy of a colloid particle from
an interface (∆E) can be estimated as∆𝐸 ~ 𝛾𝐴, where γ and A denote the interfacial
tension and the area of interface eliminated by particle attachment, respectively. A
recent report has shown that interfacial tension between two aqueous phases made
of poly(ethylene glycol) and dextran can be as low as 0.012 mJ/m2.7 Using this
value along with the typical size of bacteria (~ 1 μm), we estimate that the trapping P. sp 62
18
energy at such an interface can exceed 103kBT; this value is significant and
indicates that once bacteria attach to the interface it may be extremely difficult to
detach themselves from the interface. If, as this estimate suggests, capillary forces
can account for the interfacial trapping of bacteria, then similar behaviour should
be observable for inert colloids.
To confirm that the casein-xanthan system possesses sufficient interfacial
energy to trap inert colloids at the interface, we added 0.01% green fluorescent
polystyrene (PS) beads (i.e., inert colloids) to the mixture at t = 0, Figure 2.6. After
24 h (Figure 2.6B), the beads are found only at the interface between the casein
and xanthan regions. After 40 h, shown in Figure 2.6C, the phase separation has
continued to progress and most of the casein regions within the viewing window
are connected. This phase separation progression has occurred at room temperature
and is nearly bicontinuous after 40 h as shown in Figure 2.6E. After this time
point, the casein continues to densify and all components settle to the bottom.
During the transition, however, we can see the inert colloids indeed remain trapped
at the interface. Similar results have been reported recently for inert colloids in a
phase separated system of gelatin and maltodextrin; the inert colloids were indeed
trapped at the interface in a manner similar to oil-water-colloid three component
19
Figure 2.6. Inert colloids in casein-xanthan phase separating system imaged by CLSM. Casein is stained red by Rhodamine B, green are green fluorescent polystyrene (PS) beads (A,B,C,E) or spectinomycin-killed GFP E. coli (D). (A) PS beads immediately after mixing. (B) PS beads 24 h after mixing. (C) PS beads 40 h after mixing. (D) Dead GFP E. coli 40 h after mixing. (E) Inset of (C). All slices from 20 μm above glass, scale bars 50 μm.
To complement the PS bead study with inert colloids that more closely match
the shape and surface chemistry of live E. coli, we repeated this experiment with
antibiotic-killed GFP E. coli, with similar results. Within 24 h, the dead bacteria
were trapped at the interface and remained so as the system evolved, as seen in
Figure 2.6D. These results demonstrate that even weak interfacial tension can exert
significant trapping energies, leading to attachment and trapping of particles at
interfaces between two aqueous phases. The prolonged time required for the
colloids to find the interface may be attributed to the highly viscous nature of the A
B
C
E D
PS beads t = 0
PS beads t = 24 h
PS beads t = 40 h
E
PS beads t = 40 h Dead GFP E. coli
20
xanthan phase. The colloids have significantly dampened Brownian motion in this
two phase system.
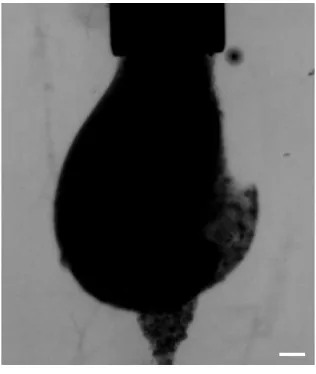
Figure 2.7. (A) Sequence of pendant drop experiment, drop fluid is 10 wt% casein, bulk fluid is 0.1 wt% xanthan, both filtered with 5 μm filter, scale bar 200 μm. (B) Sequence of pendant drop experiment, drop fluid is 10 wt% casein; bulk fluid is DI water, scale bar 200 μm. (C) PS beads in 2 wt% casein solution (no xanthan) 40 h after mixing. (D) GFP
E. coli in 2 wt% casein solution (no xanthan) 40 h after mixing. (C) and (D) taken 20 μm above cover slip; casein is red, colloids are green; scale bar 50 μm.
It would be interesting to directly quantify the interfacial tension in this system.
We attempted this measurement by performing a simple pendant drop experiment.
When a casein solution (10 wt%) was injected slowly into a xanthan solution (0.1
wt%) through a tube, we observed the formation of a transient pendant drop which
elongated continuously as shown in Figure 2.7A. In contrast, when xanthan was
removed from the continuous phase, it was not possible to form a cohesive drop no
matter how slowly we injected the casein solution, as shown in Figure 2.7B. These
observations indicate that the presence of the casein-xanthan system leads to the
development of interfaces that have a finite interfacial tension.
A B C PS beads in casein only D
t = 40 h
GFP E. coli in casein only
21
Our conclusion regarding the importance of surface tension in the interfacial
attachment of living and inert colloids is further corroborated by adding bacteria to
a casein-only solution. Figure 2.7C-D demonstrate that in the absence of xanthan,
living and inert colloids do not attach to the blobs of casein phase even after 40 h
post mixing, indicating that surface tension, albeit extremely small, is critical in
making the particles attach to the interface. We were unable to determine a value
for this tension, however, owing to the complex rheological nature of this system;
the significant elasticity of the bulk phases can play a role in determining the shape
of the droplet. This is particularly evident in the movies of pendant drop elongation
(Movies S9-10), and in Figure 2.8 in which one side of the droplet is torn away.
Even after continued elution, the torn drop edge remains jagged, a form that is not
consistent with an interface dominated solely by interfacial tension. These
non-Newtonian aspects preclude a comparison of the pendant drop shape to solutions
of a Young-Laplace equation to extract the interfacial tension.