R E S E A R C H
Open Access
Objective assessment of changes in nuclear
morphology and cell distribution following
induction of apoptosis
Jon R Eidet
*, Lara Pasovic, Rima Maria, Catherine J Jackson and Tor P Utheim
Abstract
Background:To objectively measure changes in nuclear morphology and cell distribution following induction of apoptosis. Methods:A spontaneously immortalized retinal pigment epithelial cell line (ARPE-19) was cultured for three days in DMEM/ F12 with 10% fetal bovine serum followed by 24 hours incubation in staurosporine to induce apoptosis. Cells that were not incubated in staurosporine served as control. Caspase-3 expression in apoptotic cells was demonstrated by quantitative immunofluorescence. Nuclei were counterstained with DAPI. Assessments of nuclear morphology and cell distribution were performed using ImageJ software. Statistical analyses included Student’s t-test and Pearson’s correlation coefficient. Nearest neighbor analysis was used to assess cell nuclei distribution.
Results:Caspase-3 expression in staurosporine-incubated cells increased by 471% ± 182% compared to control (P= 0.014). Relative to the control, cells in the staurosporine-incubated cultures had smaller average nuclear area (68% ± 5%;P< 0.001) and nuclear circumference (78 ± 3%;P< 0.001), while nuclear form factor was larger (110% ± 1%;P< 0.001). Cell nuclei from the staurosporine-group (R = 1.12 ± 0.04;P< 0.01) and the control (R = 1.28 ± 0.03;P< 0.01) were evenly spaced throughout the cultures, thereby demonstrating a non-clustered and non-random cell distribution. However, the staurosporine-incubated group had a significantly lower R-value compared to the control (P= 0.002), which indicated a move towards cell clustering following induction of apoptosis. Caspase-3 expression of each individual cell correlated significantly with the following morphological indicators: circumference of the nucleus divided by form factor (r= -0.475;P< 0.001), nuclear area divided by form factor (r= -0.470;P< 0.001), nuclear circumference (r= -0.469;P< 0.001), nuclear area (r= -0.445; P< 0.001), nuclear form factor (r= 0.410;P< 0.001) and the nuclear area multiplied by form factor) (r= -0.377;P< 0.001). Conclusions:Caspase-3 positive apoptotic cells demonstrate morphological features that can be objectively quantified using freely available ImageJ software. A novel morphological indicator, defined as the nuclear circumference divided by form factor, demonstrated the strongest correlation with caspase-3 expression.
Virtual Slides:The virtual slide(s) for this article can be found here: http://www.diagnosticpathology.diagnomx.eu/vs/ 3271993311662947
Background
Based on morphology, cell death can be characterized as apoptotic or necrotic or both. Apoptotic cell death con-serves the organelles and cell membrane for some time whereas the nucleus undergoes early degeneration. In necrotic cell death, however, the nucleus stays relatively intact while the cell membrane and organelles show early degeneration [1]. Typically, cap-shaped chromatin margination is one of the first signs of apoptosis [2,3].
Cytosol condensation, pyknosis and cell membrane blebbing may also be seen. The nucleus then develops several electron dense micronuclei, which are often released to the extracel-lular space. Finally, the cells split into numerous apoptotic bodies. In vitro, apoptotic cells undergo a late phase of ne-crosis characterized by early cell membrane damage [4,5]. However, pyknotic and fragmented cell nuclei are not com-mon in necrosis.
Due to the characteristic changes in nuclear morphology during apoptosis, morphological features can be used as indicators of activation of programmed cell death. A low * Correspondence:[email protected]
Department of Medical Biochemistry, Oslo University Hospital, Oslo, Norway
nuclear area factor (NAF), which was originally defined as the area of the nucleus multiplied by roundness [6], has been reported as an early sign of cell death [6-8]. Some of the latter studies employed Image Pro Plus software to al-locate scores based on NAF character; a completely round cell nucleus scores 1 and less round nuclei score above 1. ImageJ software, developed by National Institutes of Health (NIH), does not calculate roundness, but instead computes form factor (in ImageJ termed ‘circularity’). Using form factor, a perfect circle scores 1 and less circular structures score between 0 and 1. Therefore, to obtain NAF with ImageJ, the nuclear area can be divided by its form factor [7]. However, some groups have calculated NAF by multi-plying the nuclear area by form factor [8,9]. Nonetheless, both ways of calculating NAF have been shown to be significantly correlated with cell death. Which of these two definitions of NAF is optimal has not been reported, how-ever. In addition, these studies did not compare the expres-sion of apoptosis-related proteins in each cell with nuclear morphology, but rather compared average nuclei measure-ments in apoptosis-induced cultures with that of healthy control cultures. Comparing individual cell morphology with apoptotic phenotype could be a sensitive method to identify key morphological characteristics.
As apoptosis affects cell morphology, the spatial rela-tionship between the cells may be altered in cultures with a higher number of apoptotic cells. Using nearest neighbor analysis, the distance from each individual cell to its near-est neighboring cell is measured to calculate an R-value [10]. An R-value of 0 denotes a completely clustered growth pattern, whereas cultures with completely random spacing between cells are given a value of 1. Given the theoretical scenario of perfectly even spacing between cells, where cells are distributed in a hexagonal pattern, the R-value becomes 2.15. However, the use of nearest neighbor analysis to investigate whether apoptotic cell cul-tures show specific cell distribution patterns has not been undertaken.
In the present study we investigated the association between objective changes in nuclear morphology and cell distribution following induction of caspase-3 in apoptotic cells. We found that morphological features associated with caspase-3 activation could be objectively quantified. A novel morphological indicator, defined as the circumference of the nucleus divided by form factor, demonstrated the strongest correlation with caspase-3 expression.
Methods
Cell culture media and reagents
Cells from the adult RPE cell line ARPE-19 were obtained from the American Type Culture Collection (ATCC) (Manassas, VA). Dulbecco’s Modified Eagle’s Medium (DMEM): Nutrient Mixture F12, fetal bovine
serum (FBS), bovine serum albumin (BSA), trypsin-EDTA, phosphate-buffered saline (PBS), Triton X-100, penicillin, streptomycin, and 4′, 6-diamidino-2-pheny-lindole (DAPI) were provided by Sigma-Aldrich (St. Louis, MO). NunclonΔ-surface multidishes, pipettes, and other routine plastics were supplied by VWR International (West Chester, PA). Staurosporine and the primary rabbit anti-cleaved caspase-3 (Asp 175) antibody were obtained from Cell Signaling Technology (Danvers, MA). The Cy3-conjugated goat anti-rabbit IgG secondary antibody was purchased from Abcam (Cambridge, UK).
Cell culture
Adult human retinal pigment epithelial (ARPE-19) cells were routinely cultured in 95% air and 5% CO2 at 37°C in DMEM/F12 medium containing 10% FBS, 50 units/mL penicillin, and 50 g/mL streptomycin. The cells were seeded (5000 cells/cm2) on Nunclon Δ-surface mul-tidishes. The culture medium was changed on the second day, and confluent cultures were obtained on the third day.
Immunocytochemistry
Cells were cultured in 24-well multidishes as described above. Samples were subsequently prepared for immuno-cytochemical characterization by 15 minutes of methanol fixation at room temperature followed by 30 minutes of permeabilization and blocking in PBS containing 1% BSA and 0.2% Triton X-100. Anti-cleaved caspase-3 (1:400) antibody was diluted in blocking solution (PBS with 1% BSA). The primary antibody was omitted from the nega-tive controls. Samples were incubated overnight at 4°C. Goat anti-rabbit Cy3-conjugated secondary antibody (di-luted 1:10,000 in blocking solution) was added for one hour at room temperature. Specimens were washed for 5 minutes three times in PBS, with the addition of 1μg/mL DAPI during the last wash for cell nuclei staining. To in-duce caspase-3 expression cells were incubated with 1μM staurosporine for 24 hours (n = 5). Control cultures were incubated for 24 hours without staurosporine (n = 3).
The specimens were studied using a Nikon Eclipse Ti fluorescence microscope and photographed at × 200 magni-fication with a DS-Qi1 black-and-white camera. Photomi-crographs were captured at predetermined positions in each culture using a motorized microscope stage. The exposure length and gain were maintained at a constant level for all samples, and the Cy3-fluorescence brightness of the secondary antibody was within the dynamic range of the camera.
Analyses of cell nuclear morphology and distribution with imageJ
measurements, 16-bit photomicrographs of DAPI-stained nuclei were converted to 8-bit images before being auto-thresholded to binary photos using the default method of the“Make Binary”function in ImageJ. Touching cell nuclei were separated by the “Watershed” function and small fragments of nuclei were discarded on the basis of area by the“Analyze Particle”function. The latter function also pro-vided other morphological parameters, including nuclear area, circumference and form factor.
By comparing the total number of cell nuclei obtained with and without the use of “Watershed”, an estimate of range was computed for the association percentage between cell nuclei. The lower end of the range was calcu-lated by the following formula: (total number of cell nuclei obtained with “Watershed” – total number of cell nuclei obtained without “Watershed”+ 1)/total number of cell nuclei obtained with “Watershed” ×100%; whereas the higher end of the range was computed as follows: (total number of cell nuclei obtained with“Watershed” –total number of cell nuclei obtained without“Watershed”) × 2/total number of cell nuclei obtained with “ Water-shed” ×100%. The rationale for using this formula was as follows: If the number of cell nuclei obtained with “Watershed”decreased by ten for example compared to without using“Watershed”, then the number of associ-ated nuclei could be anywhere from 11 to 20 depending on whether omitting“Watershed” resulted in failure to separate 11 nuclei associated in a cluster or 20 nuclei associated as ten pairs.
In addition, we employed a“Nearest Neighbor Distance” -plugin [11] to measure the distance between each cell nu-cleus and its nearest nunu-cleus (Nearest Neighbor Distance; NND). Using the binary images of DAPI-stained nuclei, this plugin calculated the distance between the centroid of each nucleus and the centroid of its nearest neighboring nucleus. The centroid of a single cell nucleus was defined as the average of the x and y coordinates of all of the pixels in the nucleus. Nearest neighbor analysis was then performed to assess patterns of cell distribution in the cultures [10]. Using this analysis, cell distribution (or cell spacing) was characterized as clustered (R = 0), random (R = 1) or even (hexagonal) (R = 2.15).
Finally, the area percentage with DAPI-stained cell nuclei (volume fraction [Vv]) in each of the binary images was calculated and compared with the mean NND of the same image.
Caspase-3 expression quantification using imageJ
For caspase-3 quantification, an ImageJ macro was de-veloped to measure the expression in each cell. In brief, areas around each nucleus were automatically selected in the binary DAPI-stained images. The selections were transferred to the 16-bit caspase-3-stained photomicro-graphs using the “Add to Manager”-function. As these
selections only encircle the nuclei and not the cytosol where the caspase-3 protein is found, each selection was enlarged to enclose the cytosol by the“Enlarge”-function. Thereafter, the fluorescence intensity of caspase-3 in each cell body was measured independently. By using this method we were able to correlate the nuclear morphology measurements and the caspase-3 expression measure-ments within each cell.
Statistical analysis
Student’s t-test and Pearson’s correlation coefficient were used for statistical analyses (SPSS ver. 19.0). Nearest neighbor analysis was performed to assess cell nuclei distribution. P-values below 0.05 were consid-ered significant.
Results
Induction of caspase-3 after staurosporine-incubation Staurosporine was used to induce apoptosis through caspase-3 expression (Figure 1B). Control cells that had not been incubated in staurosporine were essentially caspase-3 negative (Figure 1A). Caspase-3 expression in staurosporine-incubated cells increased by 471% ± 182% compared to control cells (P= 0.014) (Figure 2). Hence, staurosporine was effective in inducing apoptosis.
Nuclear morphology analyses of staurosporine-incubated cells
To quantify the morphological changes in cell nuclei upon staurosporine incubation, cell nuclei were counter-stained with DAPI and nuclear morphology was assessed with ImageJ (Figure 3). Relative to the control, stauro sporine-incubated cultures had a lower average nuclear area (68% ± 5%; P< 0.001) and nuclear circumference (78% ± 3%; P< 0.001). Compared to the control (0.76 ± 0.01), nuclear form factor increased in the staurosporine-exposed cultures (0.84 ± 0.01;P< 0.001) (Figure 4).
Nearest neighbor analysis of staurosporine-incubated cells
By comparing the total number of cell nuclei obtained by ImageJ with and without the use of“Watershed”, the percentage of cell nuclei that were associated with at least one other nucleus was estimated to range between 16% and 32%.
completely randomly spaced (Figure 5). However, the staurosporine-incubated group had a significantly lower R-value compared to control (P= 0.002), demonstrating that activation of apoptosis is associated with more un-even cell spacing.
To assess whether the Vv of cell nuclei was related to the NND, the percentage of each image covered by cell nuclei was compared with the mean NND. There was no significant correlation between Vv and NND (r= -0.633;
P= 0.092).
Correlation of nuclear morphology and caspase-3 expression
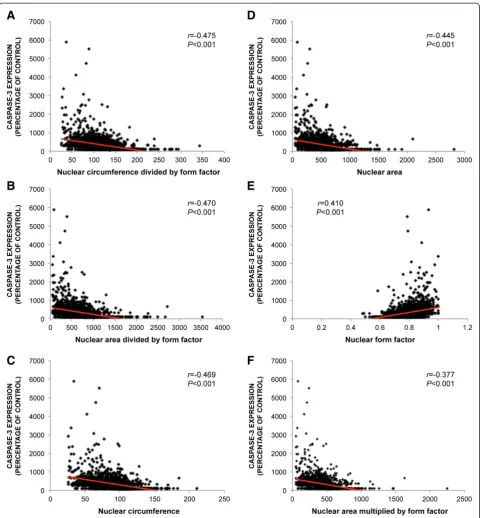
The caspase-3 expression of each individual cell was quan-tified and compared with the measurements of nuclear morphology to explore whether nuclear shape is correlated with apoptosis (Figure 6). Caspase-3 expression of each individual cell was found to be significantly correlated with the following morphological indicators; circumference of the nucleus divided by form factor (r= -0.475; P< 0.001), NAF (nuclear area divided by form factor) (r= -0.470;
P< 0.001), nuclear circumference (r= -0.469;P< 0.001), nuclear area (r= -0.445; P< 0.001), nuclear form factor (r= 0.410; P< 0.001) and the product of nuclear area and form factor (r= -0.377;P< 0.001) (Figure 7). These results show that nuclear morphology is correlated with apoptosis. The strongest correlation was between apop-tosis and the circumference of the nucleus divided by form factor.
Discussion
In the present study we investigated the association be-tween objective changes in nuclear morphology and cell distribution following induction of caspase-3 in apoptotic cells. We found that caspase-3-positive apoptotic cells show morphological features that can be objectively quan-tified. A novel morphological indicator, defined as the nu-clear circumference divided by form factor, demonstrated the strongest correlation with caspase-3 expression.
Age-related macular degeneration (AMD) is a major cause of blindness in the developed world resulting from a diseased retinal pigment epithelium (RPE) [12]. For the majority of AMD patients (85%), no effective treatment al-ternative exists. Replacement of the RPE monolayer, how-ever, has been proposed as a future therapy for this group [13-15]. The belief that RPE transplantation holds promise as having therapeutic benefit in the treatment of AMD builds on several studies reporting improved visual func-tion following the restorafunc-tion of the sub-retinal compart-ment [13]. Methods for RPE cell replacecompart-ment include injection of RPE cell suspensions and transplantation of intact RPE cell sheets. Though progress has been made to improve these techniques, the production of RPE trans-plants is still at an experimental stage. A method for
Figure 1Immunocytochemistry.Cultured cells were incubated in 1μM staurosporine for 24 hours to induce apoptosis through caspase-3 activation (red)(B). Control cells that had not been incubated in staurosporine were essentially caspase-3 negative(A). Cell nuclei were counterstained with DAPI (blue). Original magnification: ×200. Photomicrographs are representative of three(A)and five(B)samples.
assessing quality of the transplants prior to transplantation would aid in the development of RPE replacement tech-niques. Quality assessment of transplants pre-operatively can be performed invasively or non-invasively. Invasive techniques may include harvesting and processing of small biopsies from the transplant for analyses of gene and protein content. Although these are powerful tech-niques, they risk damaging the transplant and necessitate a larger transplant due to loss of tissue during biopsy harvesting. Non-invasive techniques for quality assess-ment include various microscopy analyses, such as light microscopy andin vivoconfocal microscopy (IVCM). The latter has lately been widely employed within the field of ophthalmology, aiding in the identification of putative corneal epithelial stem cell niches embedded in the ocular surface [16], keratinized surface epithelia in patients suf-fering from dry eye disease [17] and in the quantification of corneal endothelium density as part of quality control of corneal transplants [18]. Contrary to invasive tech-niques involving removal of the analyzed tissue,
non-invasive image-based techniques for assessing quality of RPE cell sheets prior to transplantation would allow direct comparison of transplants pre- and post-operatively. As we did not use a non-invasive technique for obtaining images of the cell nuclei in the cultured cell sheets, the current study is a preliminary step towards the develop-ment of a method to detect apoptotic cells in RPE trans-plants based on cytometric measurements. Assessing cell death in RPE transplants prior to surgery could likely aid in quality selection and improve transplantation outcome.
Digital pathology has developed rapidly in recent years. Objective quantification of cell- and tissue- based measures offers the prospect of reducing bias due to sub-jective interpretation and help meet pathologist workload demand [19]. There are, however, several challenges with objective image quantification that need to be addressed, including image artifacts, such as blurred regions or chro-matic aberrations, and batch-to-batch differences [20]. Techniques have been developed for describing images based on pixel, object, and semantic features [20].
Pixel-Figure 3ImageJ analyses of nuclear morphology.To quantify the morphological changes in cell nuclei upon staurosporine incubation, cell nuclei were counterstained with DAPI and nuclear morphology was assessed with ImageJ. Photomicrographs (16-bit) of DAPI stained nuclei of control cells(A)were converted to 8-bit images, then auto-thresholded by the“Make Binary”function, using the default method. Touching nuclei were then separated with the“Watershed”function(B). Thereafter, the“Analyze Particles”function was used to analyze nuclear morphology
based image analysis derives information from features such as texture (e.g. sharpness, contrast) and color. The latter has been used to classify breast tumors through data reduction based on diffusion maps [19]. Object-level fea-tures encompass higher order feafea-tures including cellular structures (e.g. nuclei, cytoplasm). Object-level information can be obtained through image segmentation. Semantic level features build on lower level features and make use of preprocessing methods, such as the bag-of-features method [21]. The latter can also include machine-learning technology. Digital pathological techniques are increasingly employed for objective assessment of whole-slide image,
the latter of which is gradually becoming common clinical practice [20].
In our study, staurosporine-incubated cells differed sig-nificantly from control cells with regards to their smaller nuclear area and circumference and their higher form fac-tor. Similar results have been reported with several other cell types [6-9,22]. The decrease in cell nuclei due to DNA loss and the increase in form factor upon initiation of apoptosis form the rationale for using NAF as a morpho-logical indicator of apoptosis.
Both the staurosporine-exposed cultures and the con-trol cultures exhibited a relatively even cell distribution (non-clustered and non-random) in the current study. However, the staurosporine-exposed cultures presented less even cell spacing. Our results are partly in line with a previous study in which blood-derived Jurkat cells temporarily clustered upon initiation of apoptosis [22]. However, the authors did not employ nearest neighbor analysis, but demonstrated cell clustering in photomicro-graphs. The lack of obvious cell clustering upon apop-tosis in the current study may have been due to our use of adherent cells. One third to one sixth of the cell nu-clei in our study were co-associated. These numbers are only approximate, however, as they are derived from comparing cell counts with and without the“Watershed” algorithm. Applying “Watershed” in ImageJ could, in theory, inadvertently either 1) removed some cell nuclei
Figure 4Nuclear morphology analyses of staurosporine-incubated cells.Bar charts demonstrate the effects of staurosporine-incubation on nuclear morphology. Relative to the control, staurosporine-incubated cultures showed a decrease in average nuclear area(A)and nuclear circumference(B). Nuclear form factor, on the other hand, was increased in the staurosporine-exposed cultures compared to control(C). Error bars represent standard deviation.
by separating them into small fragments that were excluded from the cell count on the basis of area; or 2) increased the number of cells by dividing large single cell nuclei into two or more fragments that were in-cluded in the cell count as separate cells. The NND, which was quantified to assess cell nuclei distribution, was defined as the distance between the centroid of each individual nucleus and its closest neighboring nucleus. From this it follows that the NND of associated nuclei would be approximately equal to the sum of the radii of the two nuclei. Thus, this may have affected the compu-tation of cell nuclei distribution, giving a tendency for a somewhat larger NND with larger nuclei.
The use of immunocytochemistry allows for the compari-son of protein expression and morphology in single cells. In addition, by employing quantitative immunofluorescence the relative protein expression can be objectively measured. In the current study, we compared single cell caspase-3 ex-pression with the same cell’s morphology measurements. This allowed a more sensitive analysis of the relationship between cell morphology and phenotype than merely com-paring the mean phenotype of entire cell cultures/samples [7-9,22]. Using this method, we found that caspase-3 ex-pression in apoptotic cells showed the highest correlation with a morphologic indicator defined as the nuclear cir-cumference divided by form factor. We also found that the NAF, when computed by its original formula [6]: nuclear area divided by form factor, had greater correlation with caspase-3 expression than when calculating the NAF by the formula: nuclear area multiplied by form factor. In fact, the morphological indicators nuclear circumference, area and form factoralonehad greater correlation with caspase-3 ex-pression than nuclear area multiplied by form factor.
We used DAPI as nuclear stain in the current study due to its simple staining protocol, high specificity and avail-ability for quantitative analyses [23]. DAPI can be used with live and fixed cells [23], and its fluorescence increases 20-fold upon binding to DNA [24]. However, a possible disadvantage of using DAPI is the increase in glare from intensely bright DAPI-stained nuclei. Glare can affect nuclear measures and must be taken into consideration when interpreting the results in the current study. Tech-niques for avoiding bias due to glare have been described elsewhere [25]. Feulgen stain is considered the gold stand-ard for DNA image cytometry [26]. It has been widely used for objective DNA quantification as the amount of stain seen in the nucleus directly correlates with DNA content [27]. However, the staining protocol is compara-tively longer and is more laborious compared to using DAPI. The latter has been shown to yield reliable mea-surements of staining intensity and nuclear area size [28]. Moreover, DAPI gives similar results as the conventional Feulgen staining [28], making DAPI a good candidate for use in cytometric analyses.
Figure 6Comparison of caspase-3 expression and nuclear morphology using ImageJ.The caspase-3 expression of each individual cell after staurosporine-incubation was quantified and compared with the measurements of nuclear morphology to explore whether nuclear shape is correlated with apoptosis.(A)
In this study, we performed both random and stratified sampling [29,30]. The former was used when 8-bit images were thresholded to binary images, thereby segmenting the images into figure (nuclei) and background (space be-tween nuclei) [29]. Stratified sampling was done when
measuring fluorescence intensity of the Cy3-conjugated caspase-3 antibody in the vicinity of each cell nucleus. For closely associated nuclei, we cannot fully exclude the pos-sibility of biased measurements of caspase-3 expression due to overlapping cells. However, this should not have
Figure 7Correlation of nuclear morphology and caspase-3 expression.The caspase-3 expression of each individual cell was measured and compared with the measurements of nuclear morphology to explore whether nuclear shape is correlated with apoptosis. Caspase-3 expression of each individual cell correlated significantly with a morphological indicator defined as the circumference of the nucleus divided by form factor
affected the results significantly, as we mainly used mono-layer cultures. We employed the default method defined in ImageJ for auto-thresholding each photomicrograph to create binary images. There are, however, at least 16 differ-ent thresholding algorithms available in ImageJ, the use of which may have given different results.
Conclusion
We conclude that caspase-3 positive apoptotic cells dem-onstrate morphological features that can be objectively quantified using freely available ImageJ software. A novel morphological indicator, defined as the circumference of the nuclei divided by form factor, demonstrated the stron-gest correlation with caspase-3 expression. Objective com-parison of individual cell phenotype and morphology using ImageJ as presented in the current study can potentially contribute to the development of defined morphological indicators of activation of certain cellular pathways.
Competing interests
The authors declare that they have no competing interests.
Authors’contribution
JRE designed the study and drafted the manuscript. LP and RM performed immunofluorescence. CJJ drafted the manuscript. TPU drafted the manuscript. All authors read and approved the final manuscript.
Received: 26 December 2013 Accepted: 15 April 2014 Published: 12 May 2014
References
1. Vitale M, Zamai L, Mazzotti G, Cataldi A, Falcieri E:Differential kinetics of propidium iodide uptake in apoptotic and necrotic thymocytes. Histochemistry1993,100:223–229.
2. Falcieri E, Zamai L, Santi S, Cinti C, Gobbi P, Bosco D, Cataldi A, Betts C, Vitale M:The behaviour of nuclear domains in the course of apoptosis. Histochemistry1994,102:221–231.
3. Stuppia L, Gobbi P, Zamai L, Palka G, Vitale M, Falcieri E:Morphometric and functional study of apoptotic cell chromatin.Cell Death Differ1996,3:397–405. 4. Buja LM, Eigenbrodt ML, Eigenbrodt EH:Apoptosis and necrosis: basic types
and mechanisms of cell death.Arch Pathol Lab Med1993,117:1208–1214. 5. Ziegler U, Groscurth P:Morphological features of cell death.News Physiol
Sci2004,19:124–128.
6. Daniel B, DeCoster MA:Quantification of sPLA2-induced early and late apoptosis changes in neuronal cell cultures using combined TUNEL and DAPI staining.Brain Res Brain Res Protoc2004,13:144–150.
7. DeCoster MA:The nuclear area factor (NAF): a measure for cell apoptosis using microscopy and image analysis.Modern Res and Educ Topics in Microsc2007,1:378–384.
8. Helmy IM, Azim AM:Efficacy of ImageJ in the assessment of apoptosis. Diagn Pathol2012,7:15.
9. Afifi NS, Abdel-Hamid ES, Baghdadi HM, Mohamed AF:Nuclear Area Factor as a Novel Estimate for Apoptosis in Oral Squamous Cell Carcinoma -Treated Cell Line: A Comparative in-vitro Study with DNA Fragmentation Assay. J Clinic Experiment Pathol2012,2:107. doi:10.4172/2161-0681.1000107. 10. Clark P, Evans F:Distance to nearest neighbor as a measure of spatial
relationships in populations.Ecol Soc of Am1954,35:445–453. 11. MediaWiki.https://icme.hpc.msstate.edu/mediawiki/index.php/
Nearest_Neighbor_Distances_Calculation_with_ImageJ.
12. Jager RD, Mieler WF, Miller JW:Age-related macular degeneration.N Engl J Med2008,358:2606–2617.
13. da Cruz L, Chen FK, Ahmado A, Greenwood J, Coffey P:RPE transplantation and its role in retinal disease.Prog Retin Eye Res2007,26:598–635. 14. Sheridan CM, Mason S, Pattwell DM, Kent D, Grierson I, Williams R:
Replacement of the RPE monolayer.Eye2009,23:1910–1915.
15. Lund RD, Adamson P, Sauvé Y, Keegan DJ, Girman SV, Wang S, Winton H, Kanuga N, Kwan ASL, Beauchène L, Zerbib A, Hetherington L, Couraud P-O, Coffey P, Greenwood J:Subretinal transplantation of genetically modified human cell lines attenuates loss of visual function in dystrophic rats. Proc Natl Acad Sci U S A2001,98:9942–9947.
16. Zarei-Ghanavati S, Ramirez-Miranda A, Deng SX:Limbal lacuna: a novel limbal structure detected by in vivo laser scanning confocal microscopy. Ophthalmic Surg Lasers Imaging2011,42:e129–131.
17. Kojima T, Matsumoto Y, Dogru M, Tsubota K:The application of in vivo laser scanning confocal microscopy as a tool of conjunctival in vivo cytology in the diagnosis of dry eye ocular surface disease.Mol Vis2010,
16:2457–2464.
18. Jonuscheit S, Doughty MJ, Ramaesh K:In vivo confocal microscopy of the corneal endothelium: comparison of three morphometry methods after corneal transplantation.Eye2011,25:1130–1137.
19. Belhomme P, Oger M, Michels JJ, Plancoulaine B, Herlin P:Towards a computer aided diagnosis system dedicated to virtual microscopy based on stereology sampling and diffusion maps.Diagn Pathol2011,6(1):S3. 20. Kothari S, Phan JH, Stokes TH, Wang MD:Pathology imaging informatics
for quantitative analysis of whole-slide images.JAMIA2013,
20:1099–1108.
21. Cruz-Roa A, Caicedo JC, Gonzalez FA:Visual pattern mining in histology image collections using bag of features.Artif Intell Med2011,52:91–106. 22. DeCoster MA, Maddi S, Dutta V, McNamara J:Microscopy: Science, technology,
applications and education. vol 2.Badajoz, Spain: Formatex Research Center; 2010:836–843.
23. Tarnowski BI, Spinale FG, Nicholson JH:DAPI as a useful stain for nuclear quantitation.Biotech Histochem1991,66:297–302.
24. Chazotte B:Labeling nuclear DNA using DAPI.Cold Spring Harb Protoc
2011,2011:pdb prot5556.
25. Haroske G, Meyer W, Theissig F, Kunze KD:Increase of precision and accuracy of DNA cytometry by correcting diffraction and glare errors. Anal Cell Pathol1995,9:1–12.
26. Biesterfeld S, Beckers S, Del Carmen Villa Cadenas M, Schramm M:Feulgen staining remains the gold standard for precise DNA image cytometry. Anticancer Res2011,31:53–58.
27. Bacus SS, Goldschmidt R, Chin D, Moran G, Weinberg D, Bacus JW:
Biological grading of breast cancer using antibodies to proliferating cells and other markers.The Am J of Pathol1989,135:783–792.
28. Kayser K, Baumgartner K, Gabius HJ:Cytometry with DAPI-stained tumor imprints: a reliable tool for improved intraoperative analysis of lung neoplasms.Anal Quant Cytol Histol1996,18:115–120.
29. Kayser K, Radziszowski D, Bzdyl P, Sommer R, Kayser G:Towards an automated virtual slide screening: theoretical considerations and practical experiences of automated tissue-based virtual diagnosis to be implemented in the Internet.Diagn Pathol2006,1:10.
30. Kayser K, Schultz H, Goldmann T, Gortler J, Kayser G, Vollmer E:Theory of sampling and its application in tissue based diagnosis.Diagn Pathol2009,4:6.
doi:10.1186/1746-1596-9-92
Cite this article as:Eidetet al.:Objective assessment of changes in nuclear morphology and cell distribution following induction of apoptosis.Diagnostic Pathology20149:92.
Submit your next manuscript to BioMed Central and take full advantage of:
• Convenient online submission
• Thorough peer review
• No space constraints or color figure charges
• Immediate publication on acceptance
• Inclusion in PubMed, CAS, Scopus and Google Scholar
• Research which is freely available for redistribution