60 GHz Range Boost: Exploiting Frequency
Selectivity in Millimeter-Wave Networks
Guillermo Bielsa
IMDEA Networks Institute and Universidad Carlos III de Madrid, SpainAdrian Loch
IMDEA Networks InstituteMadrid, Spain [email protected]
Joerg Widmer
IMDEA Networks InstituteMadrid, Spain [email protected]
Abstract—The directional nature of communication in millimeter-wave bands suggests that the frequency selectivity of the channel may be limited due to the absence of reflected paths. However, our measurement studies show that reflections often cause significant frequency selectivity in practical scenarios, which we can exploit to increase the otherwise limited range of 60 GHz networks. Specifically, we measure real-world indoor 60 GHz channels with a bandwidth of 2 GHz, and study their behavior with respect to techniques such as bitloading, subcarrier switch-off, and waterfilling. To this end, we consider Orthogonal Frequency-Division Multiplexing (OFDM) as defined in the IEEE 802.11ad standard and show that in contrast to common belief, these techniques are highly beneficial in millimeter-wave networks. We analyze this in practice for both horn antennas as well as an electronically-steerable phased antenna array. Most importantly, our practical results demonstrate that for the specific case of the 60 GHz band, this selectivity allows for a range extension of up to 50%. Hence, our approach enables us to alleviate one of the main limitations of millimeter-wave networks.
I. INTRODUCTION
Existing 60 GHz wireless networks ignore frequency se-lectivity. Most implementations use single-carrier schemes as defined in WiGig [1] and the IEEE 802.11ad standard [2]. This means that each physical layer symbol spreads over the entire 2 GHz channel bandwidth, regardless of potential variations of the channel in the frequency domain. While the standard also allows for Orthogonal Frequency-Division Multiplexing (OFDM), all subcarriers are treated equally in terms of, e.g., Modulation and Coding Scheme (MCS) thus not taking into account frequency selectivity. In theory, such an approach is suitable for the 60 GHz band—since nodes must use highly directive antennas to overcome the high path loss at those frequencies, reflections are expected to be rare and thus frequency selectivity should be limited. In other words, due to the lack of a rich multi-path environment as in systems using omni-directional antennas, channels should be flat.
However, in practice 60 GHz channels often behave differ-ently. In real-world scenarios with actual hardware, antenna beam patterns are not pencil-shaped as theory typically as-sumes [3]. Also, indoor environments feature a significant number of potential reflectors, while simulations usually as-sume simplified room geometries with little furniture. Hence, the signal is likely to reach the receiver not only via the Line-Of-Sight (LOS) path but also via reflections. While the number
of reflections is much lower compared to lower frequency systems, frequency selectivity occurs to a certain degree. For short, strong links, this does not play a significant role. In most cases, the difference in terms of power between the weakest and strongest subcarrier is limited. Thus, the complexity of techniques that take into account frequency selectivity (e.g., bitloading, waterfilling, or subcarrier switch-off) does not pay off. However, such techniques can also be beneficial for weak, long links. As channel quality worsens with distance, some subcarriers may not be able to sustain communication while others can still operate. According to the current design of 60 GHz networks, this would break the link entirely. The above behavior points to the following symbiosis. While tech-niques exploiting frequency selectivity only provide limited benefit for short links, for which 60 GHz networks anyhow provide very large throughput, such techniques can improve performance significantly for long links, which is precisely where 60 GHz networks have strong limitations. Moreover, 60 GHz networks may need to fall back to legacy 802.11 using Fast Session Transfer (FST) [2] in case of long, weak links. This has a disastrous impact on throughput since such legacy networks are orders of magnitude slower than 802.11ad. By exploiting the above symbiosis, 60 GHz networks can extend their range and thus limit FSTs for a given Access Point (AP) density. These range extensions are also relevant to better serve cell-edge users in 5G mm-wave micro cells [4].
In this paper, we study this symbiosis in a practical scenario. We measure real-world indoor channels in the 60 GHz band, and study their behavior as distance increases. We focus on the channels defined in the IEEE 802.11ad standard, that is, each channel has a bandwidth of roughly 2 GHz. Moreover, we consider the OFDM parameters as in the standard. We also study both the practical performance for the case of horn antennas, as well as for phased antenna arrays in our testbed. Our results show that, indeed, channels exhibit frequency selectivity. Based on this, we compare the standard operation of 60 GHz networks with techniques that do take into account this frequency selectivity. With the latter approach, we show that we can significantly extend the coverage of 60 GHz networks. Concretely, our contributions are as follows.
• We measure real-world 60 GHz indoor channels, showing that they do exhibit significant frequency selectivity. • We show that frequency selectivity becomes stronger the
longer the link, or the wider the beampattern, since for both cases reflections become more likely.
• We analyze how schemes that exploit frequency selectiv-ity can extend the range of a link by up to 50%. • We demonstrate that the above techniques can also exploit
frequency selectivity to save up to 7 dB transmit power. The remainder of this paper is structured as follows. In Section II we provide background on the frequency selectivity of millimeter-wave channels. In Section III we explain how we characterize such wideband channels in our testbed. Section IV presents the evaluation of our range extension and power saving techniques using horn antennas. Then, in Section V we compare the results to the case of a phased antenna array. Based on our insights, we discuss the implications of the results in Section VI. Finally, Section VII concludes the paper.
II. BACKGROUND ANDRELATEDWORK
In the following, we first survey related work which studies the characteristics of the 60 GHz band that enable us to increase range via frequency selectivity. After that, we provide a brief overview on the large body of work dealing with frequency selectivity not only for 60 GHz but in general.
A. 60 GHz Channel Characteristics
While mm-wave networking for local wireless access has been considered for more than a decade now [5], it is only recently that commercial off-the-shelf (COTS) devices for 60 GHz networking are becoming available. One of the key enablers for this has been the release of the IEEE 802.11ad standard [2], [6], which defines physical and medium access control layer techniques to deal with the characteristics of the 60 GHz band [7]. Related work shows that directional communication plays a fundamental role regarding channel characteristics. As sketched in Section I, using directional antennas reduces multi-path effects [8]. Moreover, signals re-flected off walls typically suffer strong attenuation, in addition to high path loss. Still, extensive measurement campaigns [3], [9], [10] show that even second-order reflections can still have a significant impact. Designing cost-efficient phased antenna arrays to filter out such reflections is feasible [11]–[13] but often not enough—as recent work shows, the antennas of 60 GHz COTS devices can have strong side lobes [3]. In other words, actual commercial hardware is far from the ideal pencil-shaped beams often assumed in simulative work on 60 GHz networks [14]. Thus, reflections are likely to fall into a side lobe of the receiver, which may cause frequency selec-tivity. The authors of [15] analyze this issue in practice, and show that 60 GHz channels indeed exhibit a certain degree of frequency selectivity for beams which are not pencil-shaped. This motivates our work since it suggests that techniques exploiting such selectivity may be suitable for range extension. The range of practical 60 GHz networks depends on a number of factors, such as the directivity of the antenna and the allowed transmission power. Recent work [3], [16], [17] uses COTS hardware to determine the actual impact of path loss in real-world environments. This adds to related work which
measures range using custom-built solutions [18], [19]. In both cases, the general consensus is that the range of 60 GHz networks in LOS conditions is 10 to 15 meters. In isolated cases, ranges of up to 25 meters are feasible. Such outliers may be due to, e.g., dry environments in which water absorption is limited. Still, given the limited range in the standard case, extending the link length is highly interesting. Otherwise, 60 GHz networks must resort to relays [20].
B. Exploiting Frequency Selectivity
The following overview on related work exploiting fre-quency selectivity is not exhaustive but provides a basic background regarding the techniques used later in the paper. Specifically, we consider three techniques in conjunction with OFDM, namely, subcarrier switch-off, bit loading, and power loading. In subcarrier switch-off [21]–[23], transceivers simply do not use subcarriers which experience poor channel condi-tions. Hence, even if some of the subcarriers are in deep fade and thus cannot sustain even the lowest MCS, transceivers can still exchange data using the rest of the subcarriers. In contrast, bit loading uses all subcarriers but allows each subcarrier to use a different MCS. While this improves throughput, subcarriers with very poor channel conditions may still prevent communication. Finally, power loading allows transmitters to distribute the transmit power unevenly among subcarriers, such as in water-filling [24]–[26]. Hence, the transmitter can, for instance, allocate more power to poor subcarriers to mitigate deep fades. For more details, we refer the interested reader to the extensive body of work in this area [27], [28].
III. SYSTEMMODEL
In this section, we explain the techniques that we use to take advantage of frequency selectivity. Moreover, we introduce the two metrics that we use to quantify the range improvement.
A. Compared Techniques
We consider an IEEE 802.11ad network using OFDM as defined in the standard. Thus, nodes occupy a bandwidth of
2.640 GHz using 512 subarriers in total. Out of those, 336
subcarriers transport data,16are pilots, and the rest is nulled,
using 1.88GHz out of the channel bandwidth of 2.640 GHz
[2]. Each subcarrier has a bandwidth of roughly5.15MHz.
1) Baseline: The AP transmits data to an end device and,
as in the standard, uses the same modulation with even energy distribution on all subcarriers. This is our baseline, which we use to asses the performance of techniques exploiting frequency selectivity. It is the standard technique to have a communication link between devices, but its robustness is limited. If a link has one or more weak subcarriers, those subcarriers force all other subcarriers to use a low modulation and coding scheme, resulting in poor performance.
2) Subcarrier Switch-Off: This mechanism is based on
just switch-off subcarriers that are not able to transmit data even at the lowest MCS, but also switch off the ones which could transmit data but would limit the overall performance. Similarly to our baseline, all subcarriers use the same MCS.
3) Bit Loading: OFDM systems that support bit loading
can use a different MCS value for each subcarrier. As a result, subcarriers with a high Signal-to-Noise Ratio (SNR) are mapped to high MCS values, while the ones with low SNR are mapped to low MCS values. In contrast to subcarrier switch-off, all usable subcarriers are used.
4) Waterfilling: OFDM implementations typically send the
same amount of power uniformly across all subcarriers. In contrast, waterfilling distributes the power according to the channel response in order to maximize the spectral efficiency of the system. This means that waterfilling allocates more power to subcarriers which are less noisy, and less power to subcarriers which anyhow have a low SNR. Such an approach only is beneficial if combined with bit loading or subcarrier switch-off, since otherwise the subcarriers with low SNR would limit the performance of the system. In our case, we use waterfilling along with bit loading. As a result, the best subcarriers can transmit data using very high MCS values. We expect waterfilling to perform best out of all our techniques.
B. Metrics
In our evaluation, we obtain the per-subcarrier SNR that we can achieve for each of the techniques in Section III-A. While this already provides an intuition of the performance of each technique, the actual gain only becomes evident in terms of throughput. Related work often approximates throughput simply using the well-known Shannon-Hartley theorem, which provides the capacity C based on the signal strength S, the
noise N, and the bandwidth B as C =B·log2(1 +S/N).
However, this does not take into account the threshold effects that result from using a discrete set of modulation schemes. In order to take this into account, we use two metrics.
1) Non-Coded Bitrate: We call “non-coded bitrate” the
throughput that results from rounding down the spectral effi-ciency of each subcarrier to the spectral effieffi-ciency of the next-lowest MCS. For instance, if we obtain a spectral efficiency value of3.2bits/s/Hz for a certain subcarrier, we round it down to 2 bits/s/Hz since it is the next-lowest power of two. This would correspond to using 4-QAM on that subcarrier. When computing the non-coded bitrate, we consider modulation values up to 64-QAM, which is the highest modulation defined in the IEEE 802.11ad standard [2]. Since this metric does not take into account channel coding, it allows us to study the impact of the MCS thresholds only. These thresholds often determine the gain of a technique compared to our baseline even if a technique provides an SNR improvement, the gain may be zero if it is not enough to reach the next MCS.
2) Coded Bitrate: Our second metric is the so-called
“coded bitrate”, which takes into account both the specific modulation and coding values as defined in IEEE 802.11ad. Essentially, the standard defines a guideline regarding which MCS to use for which SNR. This allows us to convert the
TABLE I
EVALUATIONSCENARIOS
Scenario Width Length Measured distances
Empty Room 6 m 18 m d2[2.5,5,10,15]m
Lab 6 m 18 m d2[2.5,5,8.7,11]m
Corridor 2.5 m 25 m d2[2.5,6,9,15]m
SNR directly into the actual data rate at the physical layer, taking into account all the details defined in the standard such as the overhead due to headers and preambles. Compared to our first metric, the coded bitrate results in lower throughput values due to the impact of coding. This impact is particularly strong for weak subcarriers, since 802.11ad resorts to codes with high redundancy to overcome the channel impairments. Conversely, the impact on strong subcarriers is relatively low.
IV. EVALUATION
In the following, we study the performance in terms of range extension of the techniques presented in Section III in practice. First, we describe our testbed, and then we discuss our results.
A. Testbed Setup
We use a Universal Software Radio Peripheral (USRP) X310 Software Defined Radio (SDR) to generate the baseband signal at the AP, and to decode the received signal at the Mobile Station (MS). At both the AP and the MS we convert the signal to and from the 60 GHz band using Sivers IMA FC1005V/00 converters. For the bulk of our experiments, we use 20 horn antennas with a gain of 25 dB for both transmission and reception. However, we also compare our results to the performance achieved with a practical phased antenna array in Section V. Since our USRPs generate a signal at 18 dBm, we set the gain of the converter to 20
dB such that overall we comply to the maximum Equivalent Isotropically Radiated Power (EIRP) as regulated by the US and EU authorities. Due to the limited bandwidth of the USRP daughterboards, we cannot capture the entire bandwidth of an 802.11ad channel at once. Thus, we scan one subcarrier at a time. To avoid channel variations while we scan the channel, we perform all experiments in controlled environments. In Section IV-B we validate that the channel is actually static across multiple measurements. We measure the impact of frequency selectivity in three different scenarios, namely, a corridor, a lab, and an empty room. Table I provides an overview of their dimensions. We expect these scenarios to provide very different propagation environments. The small dimensions of the corridor should benefit reflections off walls. In the lab, walls should play a much less important role but reflections from furniture should be high. Finally, in the empty hall we expect only few reflections. Due to the arrangement of each of the locations, we cannot perform measurements at exactly the same distances in all three locations. For instance, in the lab we are limited by the fixed layout of the tables.
100 200 300 Subcarrier -55
-50 -45 -40 -35 -30
Received Power [dBm]
100 200 300
Subcarrier -55
-50 -45 -40 -35 -30
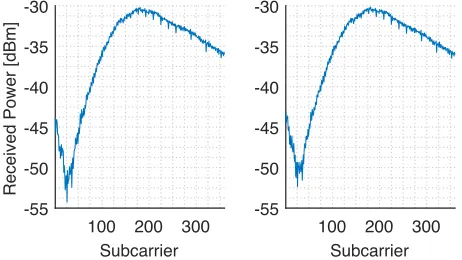
Fig. 1. Consecutive channel measurements in the corridor scenario at 9 m.
loss of generality, we consider the third channel defined in the 802.11ad standard, which goes from 61.56 GHz to63.72
GHz. Based on our measurements, we obtain the SNR for each subcarrier, which is the input that we need for the frequency selective techniques that we study. Next, we compute the metrics described in Section III-B. For our first metric, we choose the modulation of each subcarrier such that we do not exceed a Bit Error Rate (BER) of 2.4%. This is in accordance to widespread methods for determining the sensitivity of a device. We then add up the rate of each subcarrier to obtain the total link capacity. For our second metric, we select the MCS for each subcarrier based on the measured SNR.
B. Results
We structure our practical results into five subsections. First, we validate that channels are stable in an environment without mobility (c.f. Section IV-A). Next, we analyze how frequency selectivity varies with distance. Then, we evaluate how well the signal strength matches the free-space path loss formula, and finally, we show how this frequency selectivity can help extend the range of a 60 GHz network or provide energy savings.
1) Channel Stability: In Figure 1 we show two subsequent
measurements of our 60 GHz channel within a time interval of three hours. We observe that the channel is identical in both measurements. Hence, our measurement technique based on scanning one subcarrier at a time is valid. Figure 1 also depicts a significant frequency selectivity, since subcarriers 0 to 100 suffer from significant fading compared to the rest of the channel. The difference between the strongest and the weakest subcarriers is up to 20dB. Further, in Figure 2 we show the Cumulative Distribution Function (CDF) of the signal strength of a single subcarrier over a time interval of one hour for the Lab scenario at distance 2.5m. We depict subcarrier 100, but
the result is equivalent for all other subcarriers. As expected, the subcarrier exhibits high stability—since the channel fre-quency fading only depends on a few multi-path components, the channel remains constant as long as the environment does not change. In contrast, lower frequency networks are prone to much more fluctuations since the receiver receives many more multi-path components.
2) Frequency Selectivity: Next, we discuss the frequency
selective behaviour of communication in the 60 GHz band.
Fig. 2. CDF of the signal strength of subcarrier 100 during one hour.
TABLE II
FREQUENCY SELECTIVITY WITH DISTANCE
Empty Room Lab Corridor
2.5 m 4.27 dB 2.5 m 5.28 dB 2.5 m 5.09 dB
5 m 4.86 dB 5 m 6.13 dB 6 m 6.95 dB
10 m 8.80 dB 8.7 m 5.64 dB 9 m 22.25 dB
15 m 4.95 dB 11 m 6.31 dB 15 m 7.50 dB
Figure 3 shows the detailed channel measurements for each scenario and link distance. Further, Table II provides an overview on the difference in dB between the best and the worst subcarrier for each of the channels in Figure 3. For all scenarios, we observe that selectivity is small for the shortest distance. This is expected, since transmitter and receiver are placed at only 2.5 m, which means that any reflection off
the surrounding walls or obstacles is highly unlikely to fall into the beam of the receiver. In general, Figure 3c exhibits the strongest frequency-selective behavior (22.25 dB), and
Figure 3a the lowest (less than 5 dB). This is expected due to the narrow nature of the corridor, and the wide space of the empty room, which limits reflections. Interestingly, Figure 3b also exhibits low frequency selectivity (5 dB). While the lab scenario is prone to reflections off furniture and metallic objects, blockage of such reflections is also more likely compared to our other scenarios. For instance, in the lab scenario we place the transmitter and the receiver on the lab tables. As a result, the tables themselves as well as the chairs in the lab often block potential ground reflections.
For increasing distances, we observe that selectivity in-creases since it becomes more probable that the receiver receives reflections. However, this behavior is highly location dependent. For instance, at a distance of 10 m in the empty
room, selectivity increases up to 8.80 dB but then decreases
again to4.95dB for15m. This suggests that at10ma strong
multi-path component geometrically hits the receiver beam, but misses it at 15 m. Similarly, selectivity increases up to
22.25 dB for the corridor case at a distance of 9 m. Hence,
we conclude that frequency selectivity plays a significant role in indoor 60 GHz scenarios. While it does not necessarily increase with distance, we observe that the selectivity is lowest for short links.
50 100 150 200 250 300 350
−55
−50
−45
−40
−35
−30
−25
−20
Subcarrier
Rx Power [dBm] 2.5 m5 m
10 m 15 m
(a) Empty Room
50 100 150 200 250 300 350
−55
−50
−45
−40
−35
−30
−25
−20
Subcarrier
Rx Power [dBm] 2.5 m5 m
8.7 m 11 m
(b) Lab
50 100 150 200 250 300 350
−55
−50
−45
−40
−35
−30
−25
−20
Subcarrier
Rx Power [dBm] 2.5 m6 m
9 m 15 m
(c) Corridor Fig. 3. Channel measurements for all the positions.
50 100 150 200 250 300 350
−40 −38 −36 −34 −32
Subcarrier
Rx Power [dBm]
15m 10m
Fig. 4. Channel measurement in the empty room scenario at 10 m and 15 m.
Figure 4, which depicts channel measurements at10and15m
in our empty room scenario. As expected, the received power is generally lower for15than for10m, but for subcarriers 250
to 350 the opposite occurs. The remaining subcarriers roughly follow the free-space path loss model since up to subcarrier 250 the shape of the curve is approximately the same for both distances. This highlights that the impact of reflections in the 60 GHz band can be much stronger than often assumed in the literature. The overall result in Figure 4 clearly contradicts the free-space path loss model, which should thus not be used as a basis for, e.g., simulating communications and networks operating in the 60 GHz band.
3) Signal Strength: In Figure 5 we show how the received
power varies for the different positions and the different sce-narios that we consider, and how this compares to free-space path loss propagation formula, using the first measurement as a reference. We can see that, in general, the different mea-surements adjust to the theoretical model. However, we also observe small variations in virtually all of them. This is due to the existence of reflections, and how they increase or decrease the received signal power depending on whether reflections add constructively or destructively at the receiver. The most striking result can be seen for the corridor measurements, since at 15 m the received power is more than 7 dB above the
theoretical result due to the constructive addition of reflections. This is surprising, given that the measured positions at 6and 9 m adjust very well to the theoretical model. We observe
a similar behavior at 15 m in the empty room case, even
though the impact of reflections is limited in that scenario. This again validates our findings in Section IV-B2, that is,
that the theoretical free-space path loss model is not valid for the 60 GHz band in indoor environments.
4) Range Extension: Next, we study the range extension
that we achieve when using the techniques discussed in Sec-tion III-A. Specifically, we compute the throughput according to our metrics in Section III-B for each of the locations in Table I. Figure 6 shows the achievable non-coded throughput while Figure 7 shows the achievable coded throughput. The figures show that all mechanisms perform significantly better than the baseline. We observe a clear relation between the received power in Figure 5 and the throughput, as expected. Further, we find a clear relation of the throughput and the selectivity of the channels listed in Table II for the different mechanisms. Figures 6 and 7 depict the impact of coding on the rate achievable on a link. As discussed in Section III-B, the impact is stronger for weak links that require high redundancy to operate than for strong links. In all of our three scenarios we observe that bit loading is the technique that provides the high-est bit rate, particularly for impaired links. This holds true both for the case when bit loading is used with a power distribution based on water filling and for the case with a homogeneous power distribution. As a result, bit loading increases the range at which communication is possible. Subcarrier switch-off is also able to extend the range of the link for all three scenarios. However, it only achieves a lower data rate since having to use the same MCS on all subcarriers limits its performance.
Specifically, the limited range of the 60 GHz link prevents communication beyond5mon our empty room scenario. For
10and15m, our three mechanisms are able to establish a link, whereas the baseline mechanism fails. Exploiting frequency selectivity, we are capable of transmitting data up to 15 m
with a non-coded rate of at least2000Mbps and a coded rate of at least 630 Mbps for this scenario. That is, wetriple the range of the link. As expected, our techniques based on bit loading achieve even better performance. In our lab scenario, the gain in terms of range is lower since the baseline scheme is able to transmit data up to a distance of8.7 min the
non-coded case. Still, our frequency selective techniques are able to achieve significantly higher rates, and transmit data up to a distance of 11 m. Moreover, in this scenario we observe
that the impact of coding limits the range of the baseline down to only 5 m, since the BER is too high beyond that
2.5 m 5 m 10 m 15 m -30
-25 -20 -15 -10 -5
Rx Power [dBm]
∆P = Ref. 0.54 dB 0.91 dB 2.44 dB
Measured Friis Eq
(a) Empty Room
2.5 m 5 m 8.7 m 11 m -30
-25 -20 -15 -10 -5
Rx Power [dBm]
∆P = Ref. -1.12 dB -0.41 dB 0.83 dB
Measured Friis Eq
(b) Lab
2.5 m 6 m 9 m 15 m
-30 -25 -20 -15 -10 -5
Rx Power [dBm]
∆P = Ref. 0.04 dB 0.41 dB 7.15 dB
Measured Friis Eq
(c) Corridor Fig. 5. Measured overall signal strength compared to the theoretical Friis equation.
2.5 m 5 m 10 m 15 m
0 2000 4000 6000 8000
Non-Coded Throughput [Mbps]
BitLoaded Water Filling BitLoaded Uniform Distribution Subcarrier Switch-Off Baseline
(a) Empty room
2.5 m 5 m 8.7 m 11 m
0 2000 4000 6000 8000
Non-Coded Throughput [Mbps]
BitLoaded Water Filling BitLoaded Uniform Distribution Subcarrier Switch-Off Baseline
(b) Lab
2.5 m 6 m 9 m 15 m
0 2000 4000 6000 8000
Non-Coded Throughput [Mbps]
BitLoaded Water Filling BitLoaded Uniform Distribution Subcarrier Switch-Off Baseline
(c) Corridor Fig. 6. Achievable non-coded throughput for increasing distances and different frequency selective techniques.
2.5 m 5 m 10 m 15 m
0 1000 2000 3000 4000 5000 6000 7000
Coded Throuput [Mbps]
BitLoaded Water Filling BitLoaded Uniform Distribution Subcarrier Switch-Off Baseline
(a) Empty room
2.5 m 5 m 8.7 m 11 m
0 1000 2000 3000 4000 5000 6000 7000
Coded Throuput [Mbps]
BitLoaded Water Filling BitLoaded Uniform Distribution Subcarrier Switch-Off Baseline
(b) Lab
2.5 m 6 m 9 m 15 m
0 1000 2000 3000 4000 5000 6000 7000
Coded Throuput [Mbps]
BitLoaded Water Filling BitLoaded Uniform Distribution Subcarrier Switch-Off Baseline
(c) Corridor Fig. 7. Achievable coded throughput for increasing distances and different frequency selective techniques.
we consider still reach the aforementioned link distance of
11 m. Finally, the results for our corridor scenario differ significantly from the lab and the empty room cases. As listed in Table 5, the corridor is the most frequently selective scenario out of the settings that we consider in this work, featuring up to 22 dB difference in terms of received power among subcarriers at9m. As a result, the baseline mechanism
is unable to establish a link at that position, while our other techniques can operate normally. Most interestingly, at 15 m
the overall received energy increases (c.f. Figure 5) and the channel becomes more flat in the frequency domain, enabling the baseline scheme to operate again. The underlying reason is that the destructive reflection at9mdisappears when moving
to the next position further away, resulting in a flat channel response. Moreover, constructive reflections at15mboost the
received power, allowing for similar coded throughput rates at 15 m and at 6 m. All in all, we observe that frequency-selective techniques can improve the range of a 60 GHz link
on average by 50%, ranging from a 26% range increase in the lab scenario to 3⇥longer links in the empty room case. Moreover, such techniques improve the achievable data rate significantly in all of our scenarios. For the coded case, range and rate improvements are even larger since the impact of coding limits the performance of the baseline. Results are roughly in the same order of magnitude but, for instance, the range improvement in the lab case increases from26%to2⇥.
Hence, we conclude that frequency-selective techniques can be very beneficial for 60 GHz communication.
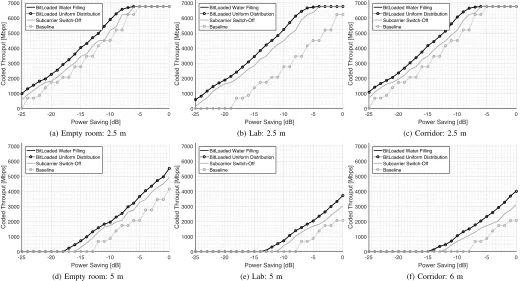
5) Energy Saving: Next, we analyze the performance of
the techniques described in Section II for a range of different power margins. This provides insights regarding potential en-ergy savings when using them. Figure 8 depicts the achievable rate for positions one and two in each of our scenarios. We compute the rate for a range of transmit power values. A power saving of0dB stands for transmission at the maximum power
-25 -20 -15 -10 -5 0 Power Saving [dB]
0 1000 2000 3000 4000 5000 6000 7000
Coded Throuput [Mbps]
BitLoaded Water Filling BitLoaded Uniform Distribution Subcarrier Switch-Off Baseline
(a) Empty room: 2.5 m
-25 -20 -15 -10 -5 0
Power Saving [dB] 0
1000 2000 3000 4000 5000 6000 7000
Coded Throuput [Mbps]
BitLoaded Water Filling BitLoaded Uniform Distribution Subcarrier Switch-Off Baseline
(b) Lab: 2.5 m
-25 -20 -15 -10 -5 0
Power Saving [dB] 0
1000 2000 3000 4000 5000 6000 7000
Coded Throuput [Mbps]
BitLoaded Water Filling BitLoaded Uniform Distribution Subcarrier Switch-Off Baseline
(c) Corridor: 2.5 m
-25 -20 -15 -10 -5 0
Power Saving [dB] 0
1000 2000 3000 4000 5000 6000 7000
Coded Throuput [Mbps]
BitLoaded Water Filling BitLoaded Uniform Distribution Subcarrier Switch-Off Baseline
(d) Empty room: 5 m
-25 -20 -15 -10 -5 0
Power Saving [dB]
0 1000 2000 3000 4000 5000 6000 7000
Coded Throuput [Mbps]
BitLoaded Water Filling BitLoaded Uniform Distribution Subcarrier Switch-Off Baseline
(e) Lab: 5 m
-25 -20 -15 -10 -5 0
Power Saving [dB]
0 1000 2000 3000 4000 5000 6000 7000
Coded Throuput [Mbps]
BitLoaded Water Filling BitLoaded Uniform Distribution Subcarrier Switch-Off Baseline
(f) Corridor: 6 m Fig. 8. Achievable bitrate for increasing distances and different frequency selective techniques.
lower transmission power values. For instance, a power saving of 10 dB means that the transmitter is transmitting 10 dB
below the maximum allowed transmission power. The depicted rate values are for the coded case (c.f. Section III-B2).
Figure 8 shows that frequency selectivity plays a role in terms of energy saving, since each of the scenarios performs differently. Regarding the individual techniques, we observe that both bit loading approaches perform almost identically across all scenarios. That is, the impact of water filling compared to a uniform power distribution is limited. The results for those two cases actually differ by tens of megabits per second, but this difference is not visible in Figure 8 because the scale of the y-axis ranges from 0 Mbps to 7000 Mbps. The similarity in terms of results of both bit loading approaches is due to the large bandwidth of the system. Given the large number of subcarriers, the amount of energy that waterfilling spreads among subcarriers is small. As a result, it is typically not enough to reach the next MCS threshold, and thus results in the same throughput. Finally, Figure 8 is consistent with previous sections, since we observe that our bitloading techniques generally outperform subcarrier switch-off. Only for the scenarios for which the SNR is anyhow very high, the results of both approaches match.
Regarding the individual scenarios, for the measured posi-tion at 2.5 m in the empty room case we observe that all
of our techniques could achieve the maximum throughput with a transmit power at least 3 dB below the maximum
allowable transmit power. If the link does not need to operate at the maximum rate, further power savings are possible.
The subcarrier switch-off technique occasionally matches the baseline but requires on average slightly less transmit power to achieve the same rate. In contrast, the bit loading techniques consistently outperform the baseline, requiring on average 2
dB less to achieve the same rate. At5m, gains with respect to the baseline increase since the larger distance results in more impairments on certain subcarriers. Specifically, the bit loading techniques require3dB less transmit power than the baseline. Also, the subcarrier switch-off approach is now consistently better than the baseline, with a difference of2dB in terms of
transmit power. Most interestingly, Figure 8d shows that the baseline cannot operate beyond a power saving of 12dB but
our other techniques can transmit data up to a power saving of17dB. Next, Figure 8e depicts the potential energy saving
at2.5min the lab scenario. In this case, bit loading can yield
a saving of up to 7 dB compared to the baseline. That is,
bit loading can achieve the same rate than the baseline with less than a quarter of the transmit power. Subcarrier switch-off performs similarly, resulting in6dB power saving. The reason behind such large power savings is that for the particular case in Figure 8e, many subcarriers are operating close to the threshold of the next MCS level when using the baseline. Thus, a slight improvement based on our techniques allows many subcarriers to switch to a higher MCS, thus achieving much higher throughput. This does not occur for the next position in the lab scenario (c.f. Figure 8e), resulting again in similar gains as for the empty room scenario. Concretely, bit loading can save on average3dB transmit power, while subcarrier
similar results as for the empty room case. While subcarrier switch-off is consistently better than the baseline at the first position, the difference is just 1 dB. In contrast, bit loading
achieves again a 3dB improvement. As expected, the rates at
the second position are significantly lower due to the increased distance. In this case, bit loading achieves4dB power savings
and subcarrier switch-off 2 dB. All in all, we conclude that
bit loading is key to achieve significant energy savings. While energy distribution techniques such as waterfilling provide some benefit, their impact is minimal in the case of very wide channels. Subcarrier switch-off is beneficial, too, but performs consistently worse than bit loading. Our above results are for the coded throughput case only. We observe a similar general behavior for the non-coded throughput. However, when coding is not taken into account, gains may be inflated for very low SNRs, as these weak links contribute to the throughput while no MCS is available that can operate at these SNRs. (c.f. Section IV-B4).
V. ANTENNAARRAYCOMPARISON
Our results in Section IV are based on a 60 GHz testbed equipped with horn antennas, which focus the transmit power into a given direction. However, such antennas are bulky and not electronically steerable, which makes them unsuitable for commercial hardware. Instead, commercial 60 GHz devices typically use phased antenna arrays. Such arrays are essentially a group of antenna elements. Each element shifts the phase and amplitude of the same transmitted signal by a configurable value. The resulting interference among all elements generates a beam in a given direction, similar to a horn antenna. Still, antenna arrays typically generate larger sidelobes than horn antennas. Thus, arrays may result in more unexpected reflec-tions, which in turn may lead to stronger frequency selectivity. In order to assess whether this effect has a significant impact on our analysis in this paper, in this section we present a first-of-its-kind study regarding the frequency selective behavior of 60 GHz channels when using phased antenna arrays.
A. Testbed Setup
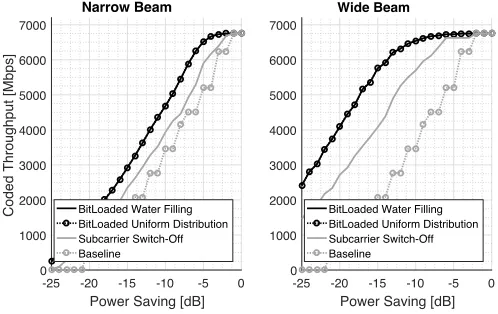
Unfortunately, phased antenna arrays for experimental pur-poses are not commercially available. This hindered us from carrying out the bulk of our experiments on such a testbed. However, in cooperation with the IMEC Research Center in Belgium, we were able to perform detailed channel measure-ments on a phased antenna array prototype. In particular, we use an antenna array with2⇥8elements and measure channels
with a bandwidth of1.8GHz, similarly to our experiments in
Section IV. We place the transmitter and the receiver in a lab at a distance of 4m. We then design two different beampatterns
using the antenna array. Our first beampattern has an ideal shape, that is, very narrow and with negligible sidelobes. We can generate such a beampattern based on the advanced capa-bilities of the phased array beamforming transceiver module from IMEC [29]. However, typical consumer-grade off-the-shelf 60 GHz devices are not capable of generating such ideal
-25 -20 -15 -10 -5 0 Power Saving [dB] 0
1000 2000 3000 4000 5000 6000 7000
Coded Throughput [Mbps]
Narrow Beam
BitLoaded Water Filling BitLoaded Uniform Distribution Subcarrier Switch-Off Baseline
-25 -20 -15 -10 -5 0 Power Saving [dB] 0
1000 2000 3000 4000 5000 6000 7000
Wide Beam
BitLoaded Water Filling BitLoaded Uniform Distribution Subcarrier Switch-Off Baseline
Fig. 9. Antenna array results
beampatterns [3]. Our second beampattern accounts for this, featuring a wider main lobe and a higher sidelobe energy level.
B. Results
Figure 9 shows our results. We clearly observe the impact of beamwidth and sidelobes—while the potential power savings for the narrow case are only4dB, savings increase to9dB for the case with significant sidelobes. We cannot depict the chan-nel measurements due to space constraints but the increased frequency selectivity becomes evident in those measurements, too. Hence, this validates our assumptions regarding the impact of sidelobes. Moreover, the frequency selectivity of our phased antenna array measurements is similar to the case with horn antennas. This means that the gains that we could achieve with phased antenna arrays when using techniques that exploit frequency selectivity should be equivalent or even higher than our results in Section IV. We thus conclude that frequency selectivity plays a significant role on COTS 60 GHz devices.
VI. DISCUSSION
Our practical results question common assumptions in the recent 60 GHz networking literature. Such related work often deals with the 60 GHz band from a networking perspective, thus often resorting to assumptions such as flat channels and free-space path loss models. However, early work on propagation characteristics [15] that deals with the 60 GHz band from a physical layer perspective suggests that such assumptions are not realistic. In this work, we bring together both perspectives by considering typical indoor scenarios for 60 GHz network deployments based on IEEE 802.11ad. We show (a) that the free-space path loss model is not accurate in such deployments, and (b) that the impact of frequency selectivity becomes evident as soon as the distance between transmitter and receiver is beyond a few meters.
From our work, we derive two crucial insights. First, we observe that, while the throughput improvements that we can achieve when using frequency selective techniques may be limited, the gains in terms of range extension are significant for low SNRs. We can extend the range of a 60 GHz link by up to
results in a highly beneficial symbiosis—the longer the link, the stronger the impact of the very high path loss in the 60 GHz band but also the higher the benefit of frequency selective techniques. Our second insight is that frequency selective techniques help to achieve a uniform coverage area. As discussed in Section IV, basic approaches may not be able to establish a link at a distance d1 due to strong frequency
selective fading on certain subcarriers, but may be able to operate at distance d2> d1 if the channel response becomes
flat again. That is, the area of coverage may contain areas with no coverage at all even if no obstacle blocks the link. We show that frequency selective techniques can help to homogenize the coverage area of a 60 GHz transmitter.
VII. CONCLUSION
In this paper, we show how frequency selectivity can help mitigate the strong range limitation of 60 GHz networks. Instead of using techniques such as bit loading, power loading, and subcarrier switch-off to improve throughput, we leverage them to reduce the impact of poor subcarriers at the edge of the coverage of a 60 GHz AP. To this end, we exploit the unap-parent frequency selectivity in indoor 60 GHz indoor channels. Although 60 GHz networks use highly directive antennas which greatly reduce the impact of multi-path components, we show practically that typical indoor environments do feature a significant number of such components. This results in an unexpectedly strong frequency selective behavior which becomes particularly clear for link lengths beyond 2.5 meters. Our practical testbed results show that using techniques that exploit this frequency selectivity can increase range by up to 50% in many of the scenarios that we consider. Moreover, this effect allows for transmit power savings of up to 7dB.
ACKNOWLEDGMENTS
This work is partially supported by the European Research Council grant ERC CoG 617721, the Ramon y Cajal grant from the Spanish Ministry of Economy and Competitive-ness RYC-2012-10788, and the Madrid Regional Government through the TIGRE5-CM program (S2013/ICE-2919). We also thank IMEC for the use of their equipment and facilities.
REFERENCES
[1] C. Hansen, “WiGiG: Multi-gigabit wireless communications in the 60 GHz band,”IEEE Wireless Communications, vol. 18, no. 6, 2011. [2] IEEE, “Wireless LAN Medium Access Control (MAC) and Physical
Layer (PHY) Specifications Amendment 3: Enhancements for Very High Throughput in the 60 GHz Band,”IEEE Std 802.11ad-2012, 2012. [3] T. Nitsche, G. Bielsa, I. Tejado, A. Loch, and J. Widmer, “Boon
and Bane of 60 GHz Networks: Practical Insights into Beamforming, Interference, and Frame Level Operation,” inProc. of CoNEXT’15, 2015. [4] T. S. Rappaport, S. Sun, R. Mayzus, H. Zhao, Y. Azar, K. Wang, G. N. Wong, J. K. Schulz, M. Samimi, and F. Gutierrez, “Millimeter wave mobile communications for 5g cellular: It will work!” IEEE Access, vol. 1, pp. 335–349, 2013.
[5] P. Smulders, “Exploiting the 60 GHz band for local wireless multimedia access: prospects and future directions,”IEEE Communications Maga-zine, vol. 40, no. 1, 2002.
[6] C. Cordeiro, D. Akhmetov, and M. Park, “IEEE 802.11ad: Introduction and Performance Evaluation of the First Multi-gbps Wifi Technology,”
inProc. of ACM mmCom, 2010.
[7] T. Nitsche, C. Cordeiro, A. Flores, E. Knightly, E. Perahia, and J. Wid-mer, “IEEE 802.11ad: directional 60 GHz communication for multi-Gigabit-per-second Wi-Fi,”IEEE Communications Magazine, vol. 52, no. 12, 2014.
[8] T. Manabe, Y. Miura, and T. Ihara, “Effects of antenna directivity and polarization on indoor multipath propagation characteristics at 60 GHz,”
IEEE Journal on Selected Areas in Communications, vol. 14, no. 3,
1996.
[9] H. Xu, V. Kukshya, and T. S. Rappaport, “Spatial and temporal charac-teristics of 60-GHz indoor channels,”IEEE Journal on Selected Areas in Communications, vol. 20, no. 3.
[10] T. Zwick, T. Beukema, and H. Nam, “Wideband channel sounder with measurements and model for the 60 GHz indoor radio channel,”IEEE Transactions on Vehicular Technology, vol. 54, no. 4, 2005.
[11] A. Lamminen, J. Saily, and A. Vimpari, “60-GHz Patch Antennas and Arrays on LTCC With Embedded-Cavity Substrates,”IEEE Transactions on Antennas and Propagation, vol. 56, no. 9, 2008.
[12] X.-P. Chen, K. Wu, L. Han, and F. He, “Low-Cost High Gain Planar Antenna Array for 60-GHz Band Applications,”IEEE Transactions on Antennas and Propagation, vol. 58, no. 6, 2010.
[13] S. B. Yeap, Z. N. Chen, and X. Qing, “Gain-Enhanced 60-GHz LTCC Antenna Array With Open Air Cavities,”IEEE Transactions on Antennas and Propagation, vol. 59, no. 9, 2011.
[14] S. Singh, R. Mudumbai, and U. Madhow, “Interference Analysis for Highly Directional 60-GHz Mesh Networks: The Case for Rethinking Medium Access Control,” IEEE/ACM Transactions on Networking, vol. 19, no. 5, 2011.
[15] H. Yang, P. Smulders, and M. Herben, “Frequency Selectivity of 60-GHz LOS and NLOS Indoor Radio Channels,” inProc. of VTC Spring’06, vol. 6, 2006.
[16] Y. Zhu, Z. Zhang, Z. Marzi, C. Nelson, U. Madhow, B. Y. Zhao, and H. Zheng, “Demystifying 60GHz Outdoor Picocells,” inProc. of ACM
Mobicom’14, 2014.
[17] X. Tie, K. Ramachandran, and R. Mahindra, “On 60 GHz Wireless Link Performance in Indoor Environments,” inProc. of PAM’12, 2012. [18] N. Moraitis and P. Constantinou, “Indoor channel measurements and
characterization at 60 GHz for wireless local area network applications,” IEEE Transactions on Antennas and Propagation, vol. 52, no. 12, 2004. [19] S. Sur, V. Venkateswaran, X. Zhang, and P. Ramanathan, “60 GHz Indoor Networking Through Flexible Beams: A Link-Level Profiling,”
inProc. of ACM SIGMETRICS’15, 2015.
[20] G. H. Sim, A. Asadi, A. Loch, M. Hollick, and J. Widmer, “Opp-relay: Managing directionality and mobility issues of millimeter-wave via d2d communication,”IEEE COMSNETS, 2017.
[21] J. Gross, M. Emmelmann, O. Pu˜nal, and A. Wolisz, “Dynamic Single-user OFDM Adaptation for IEEE 802.11 Systems,” inProc. of ACM
MSWiM, 2007.
[22] O. Pu˜nal, H. Escudero, and J. Gross, “Power loading: Candidate for future WLANs?” inProc. of WoWMoM’12, 2012.
[23] T. Nitsche and J. Widmer, “Sub-carrier Switch Off in OFDM-based wireless local area networks,” inProc. of SECON’13, 2013.
[24] D. P. Palomar and J. R. Fonollosa, “Practical algorithms for a family of waterfilling solutions,”IEEE Transactions on Signal Processing, vol. 53, no. 2, 2005.
[25] E. N. Onggosanusi, A. M. Sayeed, and B. D. V. Veen, “Efficient signaling schemes for wideband space-time wireless channels using channel state information,”IEEE Transactions on Vehicular Technology, vol. 52, no. 1, 2003.
[26] F. Rey, M. Lamarca, and G. Vazquez, “Transmit filter optimization based on partial CSI knowledge for wireless applications,” inProc. of ICC’03, 2003.
[27] Z. Song, K. Zhang, and Y. L. Guan, “Joint bit-loading and power-allocation for OFDM systems based on statistical frequency-domain fading model,” inProc. of VTC Fall’02, 2002.
[28] E. Bedeer, O. A. Dobre, M. H. Ahmed, and K. E. Baddour, “A Systematic Approach to Jointly Optimize Rate and Power Consumption for OFDM Systems,”IEEE Transactions on Mobile Computing, vol. 15, no. 6, 2016.