Trade-offs in Optimizing the Cache Deployments of CDNs
Syed Hasan
Institute IMDEA Networksand Carlos III University of Madrid, Spain
Sergey Gorinsky
Institute IMDEA Networks,Spain
Constantine Dovrolis
Georgia Instituteof Technology, USA
Ramesh K. Sitaraman
University of Massachusettsat Amherst and
Akamai Technologies Inc., USA
Abstract—Content delivery networks (CDNs) deploy globally distributed systems of caches in a large number of autonomous systems (ASes). It is important for a CDN operator to satisfy the performance requirements of end users, while minimizing the cache deployment cost. In this paper, we study the cache deployment optimization (CaDeOp) problem of determining how much server, energy, and bandwidth resources to provision in each cache AS, i.e., each AS chosen for cache deployment. The CaDeOp objective is to minimize the total cost incurred by the CDN, subject to meeting the end-user performance requirements. We formulate the CaDeOp problem as a mixed integer program (MIP) and solve it for realistic AS-level topologies, traffic de-mands, and non-linear energy and bandwidth costs. We also evaluate the sensitivity of the results to our parametric assump-tions. When the end-user performance requirements become more stringent, the CDN footprint rapidly expands, requiring cache deployments in additional ASes and geographical regions. Also, the CDN cost increases several times, with the cost balance shifting toward bandwidth and energy costs. On the other hand, the traffic distribution among the cache ASes stays relatively even, with the top 20% of the cache ASes serving around 30% of the overall traffic.
I. INTRODUCTION
CDNs (Content Delivery Networks) have revolutionized Internet data dissemination by storing content in their ge-ographically distributed caches and thereby improving the experience of end users [1], [2]. The proximity of the CDN caches to the end users provides low-latency low-loss paths between the caches and the users, increasing the performance. Originally designed to deliver web content, video content, and file downloads, CDNs currently serve a much broader family of applications, including social networks, e-commerce sites, CRM (customer relationship management) portals, and web-based SaaS (software as a service).
CDNs play an important role in the economic structure of the Internet ecosystem. Content providers, such as the New York Times, Netflix, or Facebook, pay CDNs for delivering their content to end users with greater reliability, performance, and scalability than what is possible directly over the In-ternet. The Internet is a best-effort network and does not provide performance guarantees or a globally differentiated delivery service. Part of the reason is that the Internet infras-tructure consists of tens of thousands of independent ASes (Autonomous Systems) that are owned by separate business entities who do not cooperatively optimize end-to-end perfor-mance for the users [3]. CDNs succeed by deploying widely in
a large number of ASes and creating an overlay network that is capable of delivering better end-to-end performance than the Internet underlay can.
The CDN delivery quality is subject to trade-offs with the CDN cost. While the very existence of CDNs hinges on their ability to improve upon the direct Internet delivery, a better delivery requires a larger and more costly footprint of the distributed caches. Furthermore, the optimal trade-offs between footprint/cost and performance change over time. Real-world commercial CDNs have caches in thousands of ASes and keep expanding their AS presence to provide greater performance by being closer to the end users [4].
There are many types of ASes. Access ASes focus on providing last-mile Internet access to end users. Transit ASes in the Internet core provide traffic-delivery services to ac-cess ASes. CDNs need to deploy widely in all types of ASes. In particular, a CDN needs to deploy in both core and access ASes to meet performance needs of all downstream end users. Access ASes economically benefit from CDNs because delivery of the content from a local CDN cache reduces the transit traffic and thus transit expenses of the access AS. Consequently, access ASes eagerly host CDN caches and even incentivize their deployment, e.g., by not charging the CDN for the cache colocation space and on-net traffic (i.e., the CDN traffic that stays within the access AS). On the other hand, CDN deployments in a core AS might decrease the transit revenues of the AS and make it reluctant to offer any kind of deployment incentives. For these reasons, planning the cache deployment in access ASes is a simpler matter and impacts only a smaller portion of the total deployment cost. Consequently, our work focuses on optimizing CDN deployments in the core of Internet where the problem is both more complex and more expensive.
A. CaDeOp: cache deployment optimization
Our work is the first formal study of the cache deployment optimization (CaDeOp) problem that is an important opera-tional component of any real-life CDN. CaDeOp is an offline planning problem where the CDN operator makes deployment decisions on the time scale of months or quarters. The CaDeOp objective is to minimize the deployment cost incurred by the CDN, subject to meeting the end-user performance require-ments. We call an AS where the CDN deploys its caches a
the CDN has no cache deployments. The primary output of CaDeOp is the set of cache ASes and the amount of server, bandwidth, and energy resources that the CDN has to deploy in each cache AS.
To optimize the deployment of a CDN, one must consider the traffic of the end users and examine which ASes can satisfy these end-user traffic needs with acceptable performance. Therefore, CaDeOp also produces a tentative assignment of end users to cache ASes. While these assignments are guide-lines for which cache ASes can serve which users, the CDN may choose to alter these assignments in real time when the Internet performance [2] or cost characteristics [5], [6] change. In this work, we do not consider the real-time aspects of the CDN operation but rather focus on planning the CDN deployment in the longer term. Another aspect worth noting is that a CDN typically needs to optimize the cache deployment incrementally because of already having a deployment and needing to modify it to meet new traffic, performance, and cost requirements. While CaDeOp takes the clean-slate ap-proach of computing a full optimal deployment from scratch, our CaDeOp problem formulation can be easily extended, without affecting the solution methodology, to optimize the incremental update of an existing deployment. Our subsequent work will also examine a strategy of potentially sacrificing the current optimality to enable updates that optimize the deployment under expected future conditions.
In studying the CaDeOp problem, we strive for practical rel-evance of our assumptions. Unlike previous cache-deployment studies that assume a highly hypothetical network topology such as a line or ring [7], we investigate CaDeOp in AS-level Internet topologies derived from real measurements. Using C-BGP [8], we compute realistic BGP (Border Gateway Protocol) [9] paths from cache ASes to the other ASes in these topologies. We model the traffic demands of the end users by adopting a realistic Zipf distribution seeded with data from Akamai Technologies. To evaluate the sensitivity of the results to parameter settings, we consider 3 topologies from 2 different sources as well as 2 opposing vectors of traffic demands. We model the cost of the CDN as a combination of bandwidth, energy, and server costs. While the server costs are linear, we realistically represent bandwidth and energy costs as non-linear functions. In particular, we consider bandwidth-cost functions that are sensitive to the geographic location and configured according to data from TeleGeography [10].
B. Our contributions
This paper is the first to formulate and solve the CaDeOp problem of optimizing multi-AS deployments of CDN caches in the Internet core. Our work is of significant practical relevance since it formalizes the planning process that all real-life CDN operators must follow to reduce the operational cost of their overlay networks, while meeting the performance requirements of their end users.
We evaluate our CaDeOp solutions in realistic settings, examine the sensitivity of the results to our parametric as-sumptions, and reach the following main conclusions:
Notation Semantics
G AS-level topology of the Internet core N set of ASes inG
Tj traffic demand of the end users in ASj H set of cache ASes
Ii bit indicating whether ASi∈H
Di,j AS-hop distance from cache ASito ASj mij fraction ofTj satisfied by cache ASi
Vi overall traffic of cache ASi Fi on-net traffic of cache ASi Ji off-net traffic of cache ASi
d performance constraint Si server cost of cache ASi Ei energy cost of cache ASi Bi bandwidth cost of cache ASi a,e,bi cost-function factors
h,g cost-function exponents C CDN cost
TABLE I: Notation in the CaDeOp problem formulation.
1) When the end-user performance requirements become more stringent, the CDN footprint expands rapidly, requiring cache deployments in additional ASes and geographical regions.
2) With higher performance requirements, the CDN cost also rises by several times. While the server costs remain about the same, the costs of energy and bandwidth grow because the CDN loses some of the economies of scale in procuring these resources. Consequently, the cost balance in CDNs with higher performance shifts toward bandwidth and energy costs. As the end-user performance requirements become more and more stringent over time, our work suggests that adoption of schemes for energy-usage reduction [5] and bandwidth optimization [11] will become even more important for CDNs of the future.
3) The traffic distribution among the cache ASes stays relatively even, with the top 20% of the cache ASes serving around 30% of the overall CDN traffic. It is notable that the Pareto principle, which applies in many related domains, does not apply to CDN deployments, in part due to the highly distributed nature of the Internet traffic [2].
The rest of this paper has the following structure. Section II formulates the CaDeOp problem. Section III presents our solution methodology. Section IV reports the results. Section V discusses related work. Section VI sums up our paper.
II. FORMULATING THECADEOP PROBLEM
We model the Internet core as a connected directed graphG
Internet core topology ASes Transit links Peering links Maximum node degree Diameter Average AS-hop distance
UCLA 320 1308 3535 167 16 2.69
CAIDA1 302 1074 3345 167 9 2.54
CAIDA2 490 1726 5335 253 10 2.69
TABLE II: Statistical properties of the considered Internet core topologies.
In the given model,cache ASesrefer to the ASes where the CDN deploys caches. One of the CaDeOp goals is to identify set H of the cache ASes. BitIi identifies whether AS i is a cache AS: Ii= 1for ASi∈H, andIi= 0for ASi�∈H.
Any AS can have end users of the CDN. Measured in Mbps, traffic demandTj denotes the overall rate of the content traffic from the CDN caches to the end users in ASj. To satisfy the traffic demands, the cache ASes transmit the content traffic along the paths computed according to the BGP protocol. Distance Di,j represents the number of hops on the AS-level path from cache ASi to ASj.
Traffic split mi,j is another CaDeOp output and denotes the fraction of traffic demandTj satisfied by cache ASi. The traffic splits are subject to the following constraints:
0≤mi,j ≤Ii ∀i∈N,∀j∈N, (1)
�
i∈H
mi,j = 1 ∀j ∈N. (2)
Inequalities 1 imply that only the cache ASes serve the content, i.e., mi,j = 0 if ASi�∈H. Equalities 2 ensure that the cache ASes fully satisfy the traffic demand of each ASj.
With the traffic splits determined, we establish the overall rate Vi of the content traffic transmitted by each cache ASi:
Vi=
�
j∈N
(mi,j·Tj). (3)
Some of this traffic might be on-net, i.e., sent to local end users. The rate of the on-net traffic for cache AS i can be determined as Fi = mi,i·Ti. Then, the rate of the off-net traffic (i.e., the overall traffic from ASito the other ASes) is
Ji=Vi−Fi.
To characterize the delivery quality provided by the CDN to the end users, the CaDeOp model incorporates the following performance constraintd:
�
j∈N
(Di,j·mi,j·Tj)
Vi ≤
d ∀i∈H (4)
where the hop distance from cache AS ito AS j is weighed with the fraction of the Vi traffic that the cache AS sends along the delivery path. This metric reflects the delay in AS hops acceptable for the end users. For example, d = 0
requires delivery from a cache in the same AS. Meeting the
d= 1constraint corresponds, on average, to delivery from an
adjacent cache AS.
To operate each cache ASi, the CDN incurs server costSi, energy cost Ei, and bandwidth cost Bi. These costs are computed as
Si=a·Vi, Ei=e·Vih, andBi=bi·Vig (5)
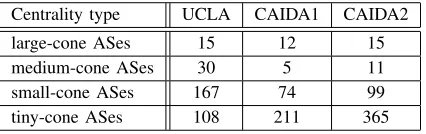
Centrality type UCLA CAIDA1 CAIDA2 large-cone ASes 15 12 15 medium-cone ASes 30 5 11 small-cone ASes 167 74 99 tiny-cone ASes 108 211 365
TABLE III: Split of the ASes according to their centrality in the UCLA, CAIDA1, and CAIDA2 topologies.
where a, e, and bi are positive constant factors, and h and
g are constant exponents with values between 0 and 1. The
non-linear Ei and Bi functions capture the economies of scale in energy and bandwidth consumption [12]–[14]. While pricing may vary with geography, we model such variations for bandwidth pricing only, by allowing different cache ASesi
to differ in their factors bi (factors e and a are fixed for all ASes).
We use C to denote the CDN cost that combines the
individual costs of the CDN in all cache ASes:
C=�
i∈H
(Si+Ei+Bi). (6)
The objective in CaDeOp is to minimize C. With all the notation summarized in table I, we formulate the CaDeOp problem as follows:
• Inputs: topologyG, AS-level paths inG, traffic-demand vector T, cost-function parameters a, e, bi, h, g, and performance constraintd;
• Objective:minimize CDN costC;
• Constraints:equalities 2 and inequalities 1 and 4; • Outputs: set H of cache ASes, traffic-split matrix m,
overall-traffic vector V, on-net traffic vector F, off-net traffic vector J, server-cost vector S, energy-cost vectorE, bandwidth-cost vector B, and CDN costC.
III. SOLUTION METHODOLOGY A. Approximation of non-linear costs
While the energy and bandwidth costs in the formulated CaDeOp problem are non-linear, we apply the classical convex combination method [15], which uses special ordered sets of type 2 (SOS2), to approximate these costs with piecewise-linear functions. The approximating functions employ between 6 and 8 linear segments.
B. Solving the CaDeOp problem
0 0.2 0.4 0.6 0.8 1 0
2 4 6
Fraction of cache ASes
Approximation error, %
perf. constr. 0.1 perf. constr. 0.4 perf. constr. 0.8
(a) UCLA topology
0 0.2 0.4 0.6 0.8 1
0 1 2 3
Fraction of cache ASes
Approximation error, %
perf. constr. 0.1 perf. constr. 0.4 perf. constr. 0.8
(b) CAIDA1 topology
0 0.2 0.4 0.6 0.8 1
0 1 2 3
Fraction of cache ASes
Approximation error, %
perf. constr. 0.1 perf. constr. 0.4 perf. constr. 0.8
(c) CAIDA2 topology
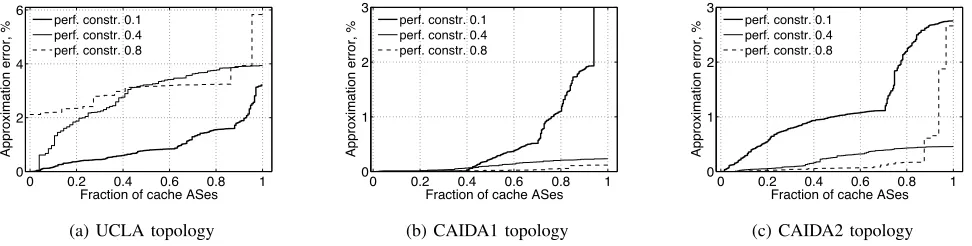
Fig. 1: Approximation error for the energy and bandwidth costs with traffic-demand vector T1 and location-oblivious bandwidth pricing.
optimization solver [17], with the maximum optimality gap of 5%.
C. Parameter settings
1) Topology: We solve the CaDeOp problem for the Inter-net core. Our iterative algorithm, which detects and resolves customer-provider cycles, extracts an Internet core topology from an Internet-wide AS-level topology by peeling off the current edge ASes, i.e., ASes that do not provide transit for another AS in the current topology. We apply the extraction algorithm to the Internet-wide topologies from UCLA [18] and CAIDA [19] to derive 3 Internet core topologies, to which we refer as UCLA, CAIDA1, and CAIDA2 through the rest of this paper. Table II reports statistical properties of these Internet core topologies.
To understand the structure of the Internet core topologies, we classify the ASes according to their centrality defined with respect to their customer cone. The customer cone of an AS consists of ASes that are either direct or indirect transit customers of that AS in the core topology, i.e., those ASes reachable from the AS through a sequence of provider-to-customer transit links [20]. We consider 4 centrality classes: large cone, medium cone, small cone, and tiny cone. The customer cone of a tiny-cone AS contains at most 5 ASes. Note that the centrality classification is for the Internet core topology only and that even a tiny-cone AS without a customer AS in the core topology can have many customer ASes in the original Internet-wide AS-level topology. The customer cone of a small-cone AS includes between 6 and 50 ASes. Medium-cone ASes have at least 51 ASes in their customer Medium-cones. We create the large-cone category by extracting from the medium-cone categories those ASes that are tier-1 according to Wikipedia [21], [22] (3 of such ASes are not in the large-cone or medium-large-cone categories for the CAIDA1 topology). Table III shows the split of the ASes according to their centrality in the Internet core topologies.
2) AS-level paths: AS-level paths in the Internet core topology constitute another input for the CaDeOp problem. We use the C-BGP tool [8] to compute realistic AS-level paths in the UCLA, CAIDA1, and CAIDA2 topologies.
3) Traffic demands: To set the traffic demands of ASes, we utilize data from Akamai caches in Indiana, California,
Sweden, and Switzerland. The datasets report average monthly rates of content traffic served by the caches. We scale up the actual traffic rates of these Akamai caches to estimate the overall monthly traffic demand for all ASes in the Internet core topology. It is worth noting that, with our focus on optimizing CDN deployments in the Internet core, we do not consider access ASes and their traffic demands. We distribute the overall core demand between the individual core ASes by assigning traffic-demand rates to the ASes according to the Zipf distribution [23], [24] where the maximum traffic demand of an AS and skew parameter are set to 5 Gbps and 0.8 respectively. While we do not have access to data for the content consumption by specific ASes, we consider 2 opposing assignments of the traffic-demand shares to in-dividual core ASes: (T1) Traffic-demand vector T1 sets the traffic-demand shares of ASes in the order of the node de-grees of the ASes; this traffic allocation roughly corresponds to the centrality classification of the ASes in the Internet core topology and places larger traffic demands toward the topological center; (T2) Traffic-demand vector T2 assigns the traffic-demand shares to the ASes in the reverse order and allocates larger traffic demands at the edges of the Internet core topology. While the Zipf profile of the traffic-share distribution is realistic [23], [24], extremes T1 and T2 of the broad traffic-demand vector range enable us to evaluate the sensitivity of the results to traffic demands.
4) Cost functions: Based on data from public sources and TeleGeography [10], our default parameter settings for the server, energy, and bandwidth cost functions are as follows:
a= 0.88,e= 20, bi = 70, h=g = 0.75 (all measurement
units are such that expressions 5 compute monthly costs in U.S. dollars). We also evaluate location-aware bandwidth pricing where the value of bi depends on the geographical region of ASi. Again guided by the TeleGeography data, we set the location-aware bi value to 51, 71, 215, 264, and 270 for Europe, North America, Asia-Pacific, South America, and Oceania respectively.
IV. EVALUATION RESULTS A. Accuracy of approximating the non-linear costs
1 10 100
0.1 0.4 0.8 1.2 1.6 2
Number of cache ASes
Performance constraint loc-oblivious T1 loc-oblivious T2 loc-aware T1 loc-aware T2
(a) UCLA
1 10 100
0.1 0.4 0.8 1.2 1.6 2
Number of cache ASes
Performance constraint loc-oblivious T1 loc-oblivious T2 loc-aware T1 loc-aware T2
(b) CAIDA1
1 10 100
0.1 0.4 0.8 1.2 1.6 2
Number of cache ASes
Performance constraint
loc-oblivious T1 loc-aware T1
(c) CAIDA2
Fig. 2: Trade-offs between the CDN footprint and performance in the UCLA, CAIDA1, and CAIDA2 topologies.
0 0.2 0.4 0.6 0.8 1
0.1 0.4 0.8 1.2 1.6 2.0
Fraction of cache ASes
Performance constraint
large-cone medium-cone small-cone tiny-cone
(a) with the UCLA topology and T1
0 0.2 0.4 0.6 0.8 1
0.1 0.4 0.8 1.2 1.6 2.0
Fraction of cache ASes
Performance constraint large-cone medium-cone small-cone tiny-cone
(b) with the UCLA topology and T2
0 0.2 0.4 0.6 0.8 1
0.1 0.4 0.8 1.2 1.6 2.0
Fraction of cache ASes
Performance constraint
large-cone medium-cone small-cone tiny-cone
(c) with the CAIDA2 topology and T1
Fig. 3: Split of the cache ASes according to their centrality when the bandwidth pricing is location-oblivious.
piecewise-linear functions, we quantify how accurately the piecewise-linear functions represent the non-linear costs for each cache AS. Keeping the approximation accuracy high is important in order to avoid error cascades and preserve the high precision in the problem solutions [25]. Figure 1 plots the approximation error for the energy and bandwidth costs of every cache AS with traffic-demand vector T1 and location-oblivious pricing.
For the UCLA topology, figure 1a shows that the error is less than 4% for all but one cache AS when performance constraint d is at most 0.8. The error stays at 0.6% when
d = 1.2. With d = 1.6 or d = 2, the approximation does
not introduce any error into the energy and bandwidth costs of cache ASes. For the CAIDA topologies, the approximation method provides the exact costs with d≥1.2. With d≤0.8,
figure 1c shows that the error consistently stays under 3% for the CAIDA2 topology. For the CAIDA1 topology withd= 0.8
or d= 0.4, figure 1b shows the error values that are always
significantly below 1%. On the other hand, with d= 0.1, the
error stays under 3% for only 94% of the cache ASes and grows to almost 15% over the remaining 6% of the cache ASes. While the cost-approximation accuracy deteriorates for some cache ASes in CAIDA1, we use UCLA as the baseline topology in our evaluation.
B. Deployment footprint
We start evaluating our CaDeOp solutions by examining how performance constraint d affects the footprint of the optimal CDN deployment. Figure 2a plots the number of cache ASes in the optimal deployment for both traffic-demand vectors in the UCLA topology with location-oblivious and
location-aware bandwidth pricing. When the required delivery quality is low, the optimal deployment involves only a few cache ASes. For d = 2, a single-AS deployment provides
the required delivery quality and minimizes the CDN cost in 3 out of the 4 plotted settings (and 2 cache ASes are needed in the 4th setting). When the performance constraint becomes more stringent, the footprint of the optimal CDN deployment consistently expands by employing more cache ASes. For each of the 4 traffic/pricing settings, the footprint expansion is roughly exponential in the number of cache ASes.
Assessing the sensitivity of the performance-footprint trade-offs to the topology and traffic demands, figures 2a, 2b, and 2c report similar trade-off profiles in the UCLA, CAIDA1, and CAIDA2 topologies with traffic-demand vector T1. However, the trade-off profiles with traffic-demand vector T2, which shifts large traffic demands towards the edges of the topology, are quite different: the optimal CDN deployment tends to involve a larger number of cache ASes than with vector T1, which places large traffic demands toward the topological center. Hence, CaDeOp solutions are more sensitive to traffic demands than topology.
0 0.2 0.4 0.6 0.8 1
0.1 0.4 0.8 1.2 1.6 2.0
Fraction of cache ASes
Performance constraint North America
Europe Asia Pacific South America
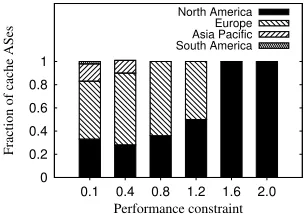
Fig. 4: Geographic distribution of cache ASes in the optimal deploy-ment for the UCLA topology, traffic-demand vector T1, and location-oblivious bandwidth pricing.
steadily declines, and the CDN spreads its cache ASes through the topology. For d = 0.1, the fractions of the large-cone,
medium-cone, small-cone, tiny-cone ASes in the optimal CDN deployment are respectively 9%, 10%, 52%, 29% which closely approach the corresponding 5%, 9%, 52%, 34% shares of these AS types in the overall AS population of the UCLA topology.
Figure 3b depicts counterpart results for traffic-demand vector T2 and shows similar footprint-performance trade-offs: while the optimal deployment with d = 2 consists of one large-cone AS, the cache ASes spread through the topology away from its center when the delivery quality requirements become more stringent. With traffic-demand vector T2, the fraction of large-cone ASes has a steeper decline, and the optimal deployment shifts the cache ASes towards the edges of the topology more aggressively, because this vector places large traffic demands away from the topological center.
Switching the topology from UCLA to CAIDA2, figure 3c shows the split of the cache ASes according to their centrality type with traffic-demand vector T1 and location-oblivious bandwidth pricing. When the performance constraint tightens from 0.8 to 0.1, the footprint expansion is qualitatively the same as in the UCLA topology: the CDN spreads its cache ASes away from the topological center. On the other hand, when the performance constraint is loose, the qualitative pic-ture differs from the UCLA case: the CDN locates its consol-idated footprint in tiny-cone or small-cone ASes of CAIDA2. Turning our attention to the geography of the optimal CDN deployment, figure 4 depicts the geographic profile of the cache ASes for the UCLA topology, traffic-demand vector T1, and location-oblivious pricing. For d= 2ord= 1.6, the only
cache AS of the optimal footprint is based in North America. When the delivery quality requirements become stricter, the optimal footprint expands first to Europe, then to Asia-Pacific, and eventually to South America. This geographic perspective confirms the more general observation that content delivery at a high quality necessitates an extensive CDN footprint throughout the topology.
The above evaluation can be summed up as follows: When the delivery-quality needs become more stringent, the CDN footprint expands rapidly, requiring cache deployments in additional ASes and geographical regions.
0 0.2 0.4 0.6 0.8 1
0 0.2 0.4 0.6 0.8 1
Fraction of cache ASes
Fraction of overall traffic
perf. constr. 0.1 perf. constr. 0.4 perf. constr. 0.8
Fig. 5: Distribution of the overall traffic among cache ASes with the UCLA topology, traffic-demand vector T1, and location-oblivious pricing.
C. Traffic patterns
We now examine how the optimal footprint satisfies the traffic demands of end users. Figure 5 depicts overall-traffic vector V, in the decreasing order of the Vi values, for dif-ferent delivery-quality needs with the UCLA topology, traffic-demand vector T1, and location-oblivious pricing. Ford= 0.8
when the optimal footprint involves 22 cache ASes, the overall traffic is spread among the cache ASes quite uniformly, with the exception of a few cache ASes that have the lowest load. In the 3 plotted distributions for the performance constraints between 0.8 and 0.1, the top 20% of the cache ASes serve around 30% of the overall traffic, and the top 50% of the cache ASes serve around 65% of the overall traffic. Hence, the distribution of the overall traffic among cache ASes stays relatively even.
Figure 6 maps served ASes to cache ASes. Withd= 0.8, figure 6a shows that the individual cache ASes serve between 31 and 8 ASes each. With d = 0.4 and d = 0.1, the maximum number of ASes served by the same cache AS reduces to 11 and 6 respectively, while the minimum number is 2 ASes which include the cache AS itself. Figure 6b shows that most of ASes receive content from only one cache AS.
With d= 0.1, only 29% of all ASes are served by multiple
cache ASes, and the maximum number of cache ASes serving the same AS is 8. For the looser performance constraints, the fraction of ASes served by multiple cache ASes shrinks even further. Focusing on the ASes served by multiple cache ASes, figure 6c plots the cumulative distribution of positive traffic splitsmij and reveals that the traffic splits are spread relatively smoothly between 1 and 0. Thus, tightening the performance constraint decreases the fraction of ASes served by multiple cache ASes but the traffic of such served ASes remains distributed smoothly among their multiple cache ASes.
0 0.2 0.4 0.6 0.8 1 0
10 20 30 40
Fraction of cache ASes
Number of served ASes
perf. constr. 0.1 perf. constr. 0.4 perf. constr. 0.8
(a) Number of ASes served by a cache AS
0 0.2 0.4 0.6 0.8 1 2
4 6 8
Fraction of served ASes
Number of cache ASes
perf. constr. 0.1 perf. constr. 0.4 perf. constr. 0.8
(b) Number of cache ASes serving an AS
0 0.2 0.4 0.6 0.8 1
0 0.2 0.4 0.6 0.8 1
Fraction of positive traffic splits
Traffic split
perf. constr. 0.1 perf. constr. 0.4 perf. constr. 0.8
(c) Distribution of traffic splitsmi,j
Fig. 6: Mapping of served ASes to cache ASes for the UCLA topology, traffic-demand vector T1, and location-oblivious pricing.
0 1 2 3 4 5
0 0.2 0.4 0.6
On−net traffic, Gbps
Off
−
net traffic, Gbps
(a) performance constraint of 0.1
0 1 2 3 4 5
0 1 2 3 4
On−net traffic, Gbps
Off
−
net traffic, Gbps
(b) performance constraint of 0.4
0 1 2 3 4 5
0 5 10 15 20
On−net traffic, Gbps
Off
−
net traffic, Gbps
(c) performance constraint of 0.8
Fig. 7: Scatter plots of the on-net vs. off-net traffic of the cache ASes for the UCLA topology, traffic-demand vector T1, and location-oblivious bandwidth pricing.
inequalities 4 because serving the off-net traffic of a cache AS at a rate that is larger than d/(1−d)times the on-net traffic rate would violate the performance constraint. Perhaps more surprising is that a large number of points coincide with the linear bound. This happens when the performance constraint is dominant, and inequalities 4 are satisfied with equalities for many cache ASes in the optimal deployment. Each of these cache ASes serves the off-net traffic at the maximum rate that does not violate the performance constraint.
For the UCLA topology, traffic-demand vector T1, and location-oblivious bandwidth pricing, figures 3a and 8 com-pare the cache ASes and their overall traffic. The comparison shows that the cache ASes and overall traffic have qualitatively similar distributions when split according to the centrality type of the cache ASes.
In the above examination of CDN traffic patterns, we can highlight the following observations: The traffic distribution among the cache ASes stays relatively even, with the top 20% of the cache ASes serving around 30% of the overall traffic. For a large fraction of the cache ASes, the off-net traffic is proportional to the on-net traffic of the AS.
D. CDN cost
While the above evaluation focuses on the CDN footprint and traffic patterns, we now examine the cost of the optimal deployment. Figure 9 plots the normalized CDN cost in the UCLA, CAIDA1, and CAIDA2 topologies. The normalization is done with respect to the CDN cost with no constraint on
0 0.2 0.4 0.6 0.8 1
0.1 0.4 0.8 1.2 1.6 2
Fraction of overall traffic
Performance constraint large-cone medium-cone small-cone tiny-cone
Fig. 8: Split of the overall traffic according to the centrality of the cache ASes with the UCLA topology, traffic-demand vector T1, and location-oblivious bandwidth pricing.
the performance, i.e., when the optimal deployment involves only one cache AS. The plot shows that tightening the per-formance constraint increases not only footprint but also cost.
Ford= 0.1, the CDN cost is several times larger than in the
baseline single-AS deployment.
We now examine how the CDN cost depends on the aware-ness of location-specific bandwidth prices. For the UCLA topology and traffic-demand vector T1, figures 10a and 10b depict the geographic distributions of the CDN cost with location-oblivious and location-aware bandwidth prices re-spectively. When the performance constraint is loose, the awareness shifts the entire deployment from North America to Europe due to the lower prices in the latter. When d
1 2 3 4 5
0.1 0.4 0.8 1.2 1.6 2
Normalized CDN cost
Performance constraint loc-oblivious T1 loc-oblivious T2 loc-aware T1 loc-aware T2
(a) UCLA
1 2 3 4 5
0.1 0.4 0.8 1.2 1.6 2
Normalized CDN cost
Performance constraint loc-oblivious T1 loc-oblivious T2 loc-aware T1 loc-aware T2
(b) CAIDA1
0.5 1 1.5 2 2.5 3 3.5 4
0.1 0.4 0.8 1.2 1.6 2
Normalized CDN cost
Performance constraint loc-oblivious T1
loc-aware T1
(c) CAIDA2
Fig. 9: Trade-offs between the CDN cost and performance in the UCLA, CAIDA1, and CAIDA2 topologies.
0 0.2 0.4 0.6 0.8 1
0.1 0.4 0.8 1.2 1.6 2
Fraction of CDN cost
Performance constraint North America Europe Asia Pacific South America
(a) with location-oblivious pricing and T1
0 0.2 0.4 0.6 0.8 1
0.1 0.4 0.8 1.2 1.6 2
Fraction of CDN cost
Performance constraint North America Europe Asia Pacific South America
(b) with location-aware pricing and T1
0.1 0.4 0.8 1.2 1.6 2 0.5
0.75 1 1.25
Performance constraint
Oblivious/aware ratio of costs
traffic demand T1 traffic demand T2
(c) ratio of the CDN costs
Fig. 10: The CDN cost for the UCLA topology with location-oblivious vs. location-aware bandwidth pricing.
additional regions and converges to similar regional splits for both pricing models because the caches in the expanding footprint are deployed closer to the end users. Nevertheless, the location-specific pricing affects the CDN cost even with tight performance constraints. For traffic-demand vectors T1 and T2, figure 10c shows that the ratio of the CDN costs with location-oblivious and location-aware prices varies from 1.2 (with d= 2 and T1) to 0.7 (with d= 0.1 and T2). For
tighter d values, the oblivious/aware ratio of the CDN costs
consistently diminishes because the CDN deploys caches in new geographical regions that have higher prices. Hence, the awareness of location-specific prices has profound effects.
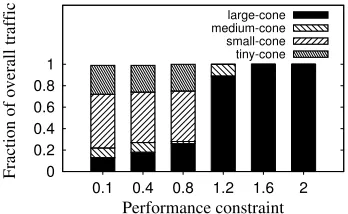
Figure 11 tracks the split of the CDN cost among the bandwidth, energy, and server categories. When the delivery-quality requirements become more stringent and expand the footprint with new cache ASes, the CDN ability to benefit from the economies of scale in energy and bandwidth costs diminishes, and the fractions of these costs in the CDN cost increase. On the other hand, while the server costs do not change, the relative share of the server costs in the increasing CDN cost declines. Thus, when the performance constraint tightens, the cost balance shifts toward the bandwidth and energy costs.
The following are the main insights from this last portion of our evaluation:When the delivery-quality requirements become more stringent, the CDN cost rises several times, and the cost balance shifts toward bandwidth and energy costs.
V. RELATED WORK
Cache placement has been studied in models that do not account for the economic structure of the Internet [7], [26],
0 0.2 0.4 0.6 0.8 1
0.1 0.4 0.8 1.2 1.6 2
Fraction of CDN cost
Performance constraint bandwidth
energy server
Fig. 11: Split of the CDN cost among the bandwidth, energy, and server categories for the UCLA topology, traffic-demand vector T1, and location-oblivious pricing.
[27]. Because the economic considerations are crucial for CDN planning, our paper goes beyond the single-network perspective and examines cache deployment in realistic AS-level Internet topologies.
Complementary to the planning problem of CaDeOp that we study in this paper, there is much prior work on the real-time operations of the CDN in areas such as dynamic content management and load balancing [5], [26]–[30].
There exists recent work on data-center placement and upgrade [31], [32]. The data-center optimizations are based on physical resources, e.g., water, energy, and land. While CDN caches are deployed in data centers, the performance and cost considerations for deploying CDNs are drastically different from those relevant for data-center operators.
subproblem of choosing the set of cache ASes. However, CDN specifics necessitate a different formulation and solution methodology for CaDeOp.
Optimization techniques have been used to study telco CDNs and IXP-colocated CDNs [34], [35]. However, there is no prior study of multi-AS deployment optimization with realistic cost and performance constraints, such as the ones examined in our paper.
Reducing the energy cost of a CDN has been a focus in earlier work [6], [36]. Our investigation takes a more comprehensive view by considering all major sources of the CDN cost, including energy, bandwidth, and server costs, in the joint CaDeOp problem.
VI. CONCLUSION
This paper is the first to formulate and solve the CaDeOp (Cache Deployment Optimization) problem of determining an optimal set of cache ASes in the Internet core and provisioning server, energy, and bandwidth resources in each cache AS. CaDeOp strives to minimize the CDN cost while satisfying the end-user performance requirements. Our evaluation of the CaDeOp solutions exposed trade-offs in CDN deployment for realistic AS-level topologies, Internet routing, traffic demands, and non-linear costs for energy and bandwidth. We also evaluated the sensitivity of the conclusions to our parametric assumptions. When the delivery-quality needs become more stringent, the CDN footprint expands rapidly, requiring cache deployments in additional ASes and geographical regions. Also, the CDN cost increases several times, with the cost balance shifting toward bandwidth and energy costs. On the other hand, the traffic distribution among the cache ASes stays relatively even, with the top 20% of the cache ASes serving around 30% of the overall traffic.
ACKNOWLEDGMENTS
This research was financially supported in part by the European Commission (FP7-ICT 288021, EINS), Spanish Ministry of Science and Innovation (RYC-2009-04660), and U.S. National Science Foundation (CNS-1017139). We also thank Manish Jain, Amogh Dhamdhere, and Pradeep Bangera for their help and advice.
REFERENCES
[1] E. Nygren, R. K. Sitaraman, and J. Sun, “The Akamai Network: a Plat-form for High-PerPlat-formance Internet Applications,”SIGOPS Operating Systems Review, 2010.
[2] J. Dilley, B. Maggs, J. Parikh, H. Prokop, R. K. Sitaraman, and B. Weihl, “Globally Distributed Content Delivery,” IEEE Internet Computing, 2002.
[3] M. Podlesny and S. Gorinsky, “Leveraging the Rate-Delay Trade-Off for Service Differentiation in Multi-Provider Networks,”IEEE Journal on Selected Areas in Communications, 2011.
[4] “CDN Provider Akamai Expands Services to Costa Rica, Names Asia-Pacific Executives,” goo.gl/BRvvk.
[5] V. Mathew, R. K. Sitaraman, and P. Shenoy, “Energy-aware Load Balancing in Content Delivery Networks,” inProceedings of INFOCOM, 2012.
[6] A. Qureshi, R. Weber, H. Balakrishnan, J. Guttag, and B. Maggs, “Cutting the Electric Bill for Internet-Scale Systems,” inProceedings of SIGCOMM, 2009.
[7] P. Krishnan, D. Raz, and Y. Shavitt, “The Cache Location Problem,” IEEE/ACM Transactions on Networking, 2000.
[8] B. Quoitin and S. Uhlig, “Modeling the Routing of an Autonomous System with C-BGP,”IEEE Network, 2005.
[9] Y. Rekhter and T. Li, “A Border Gateway Protocol 4 (BGP-4),” RFC 1771, 1995.
[10] “TeleGeography: Data-driven Telecommunications Market Research,” http://www.telegeography.com/.
[11] M. Adler, R. K. Sitaraman, and H. Venkataramani, “Algorithms for Op-timizing the Bandwidth Cost of Content Delivery,”Computer Networks, 2011.
[12] W. B. Norton, “The Internet Peering Playbook: Connecting to the Core of the Internet,”DrPeering Press, 2012.
[13] I. Castro and S. Gorinsky, “T4P: Hybrid Interconnection for Cost Reduction,” inProceedings of NetEcon, 2012.
[14] I. Castro, R. Stanojevic, and S. Gorinsky, “Using Tuangou to Reduce IP Transit Costs,”IEEE/ACM Transactions on Networking, 2014. [15] A. B. Keha, I. R. De Farias, Jr., and G. L. Nemhauser, “Models for
Representing Piecewise Linear Cost Functions,” Operations Research Letters, 2004.
[16] AMPL Optimization LLC, “AMPL Modeling Language,” http://www. ampl.com/.
[17] Gurobi Optimization, “Gurobi Optimizer 5.0,” http://www.gurobi.com/ download/gurobi-optimizer/.
[18] “UCLA Internet AS-level Topology Archive,” http://irl.cs.ucla.edu/ topology/.
[19] “CAIDA AS Relationship Topology Data,” http://as-rank.caida.org/data/. [20] X. Dimitropoulos, D. Krioukov, M. Fomenkov, B. Huffaker, Y. Hyun, k. claffy, and G. Riley, “AS Relationships: Inference and Validation,” ACM SIGCOMM CCR, 2007.
[21] Wikipedia, “Tier 1 Network,” http://en.wikipedia.org/w/index.php?title= Tier 1 network&oldid=555211028.
[22] S. Hasan and S. Gorinsky, “Obscure Giants: Detecting the Provider-free ASes,” inProceedings of Networking, 2012.
[23] H. Chang, S. Jamin, Z. M. Mao, and W. Willinger, “An Empirical Approach to Modeling Inter-AS Traffic Matrices,” in Proceedings of IMC, 2005.
[24] A. Feldmann, N. Kammenhuber, O. Maennel, B. Maggs, R. De Prisco, and R. Sundaram, “A Methodology for Estimating Interdomain Web Traffic Demand,” inProceedings of IMC, 2004.
[25] T. L. Magnanti and D. Stratila, “Separable Concave Optimization Ap-proximately Equals Piecewise-Linear Optimization,”arXiv:1201.3148, 2012.
[26] S. Borst, V. Gupta, and A. Walid, “Distributed Caching Algorithms for Content Distribution Networks,” inProceedings of INFOCOM, 2010. [27] D. Applegate, A. Archer, V. Gopalakrishnan, S. Lee, and K. K.
Ramakr-ishnan, “Optimal Content Placement for a Large-scale VoD system,” in Proceedings of CoNEXT, 2010.
[28] L. Qiu, V. N. Padmanabhan, and G. M. Voelker, “On the Placement of Web Server Replicas,” inProceedings of INFOCOM, 2001.
[29] J. Kangasharju, J. W. Roberts, and K. W. Ross, “Object Replication Strategies in Content Distribution Networks,” Computer Communica-tions, 2002.
[30] V. Sourlas, L. Gkatzikis, P. Flegkas, and L. Tassiulas, “Distributed Cache Management in Information-Centric Networks,”IEEE Transactions on Network and Service Management, 2013.
[31] I. Goiri, K. Le, J. Guitart, J. Torres, and R. Bianchini, “Intelligent Placement of Datacenters for Internet Services,” in Proceedings of ICDCS, 2011.
[32] A. R. Curtis, S. Keshav, and A. Lopez-Ortiz, “LEGUP: Using Het-erogeneity to Reduce the Cost of Data Center Network Upgrades,” in Proceedings of CoNEXT, 2010.
[33] A. Dhamdhere and C. Dovrolis, “ISP and Egress Path Selection for Multihomed Networks,” inProceedings of INFOCOM, 2006. [34] A. Sharma, A. Venkataramani, and R. K. Sitaraman, “Distributing
Content Simplifies ISP Traffic Engineering,” in Proceedings of SIG-METRICS, 2013.
[35] M. Yu, W. Jiang, H. Li, and I. Stoica, “Tradeoffs in CDN Designs for Throughput Oriented Traffic,” inProceedings of CoNEXT, 2012. [36] D. S. Palasamudram, R. K. Sitaraman, B. Urgaonkar, and R. Urgaonkar,