PERFORMANCE SIMULATION OF
COLD STORAGE USING ENERGYPLUS
ASHISH S. UTAGE*1, P.G. Scholar, Mechanical Department,
Sinhgad College of Engineering, Vadgaon (Bk.), Pune- 411 041, MH, India Tel.: +91-9028876791; E-mail: [email protected]
K. V. MALI 2,
Assistant Professor, Mechanical Department,
Sinhgad College of Engineering, Vadgaon (Bk.), Pune- 411 041, MH, India Tel.: +91-9689900884; E-mail: [email protected]
A. D. KADAM 3,
Assistant Professor, Mechanical Department,
Sinhgad College of Engineering, Vadgaon (Bk.), Pune- 411 041, MH, India Tel.: +91-9850954877; E-mail: [email protected]
Abstract:
The present work deals with the study of cold storage refrigeration plant and simulation of refrigeration system to evaluate the cooling load and annual energy consumption for cold storage applications. The specific temperature and humidity range is required for properly storing any particular food and thus facilitates its preservation for a longer duration of time. The present cold storage capacity in India is grossly inadequate and with a positive future outlook for the agro, food processing, retail and pharmaceutical industry there is urgent need to scale up and develop integrated cold chain facilities across the country. In this view, a simple methodology is presented to obtain the cooling load and energy consumption for a cold storage using an energy simulation tool “EnergyPlus”. Also the attempt has been made to minimize energy consumption of cold store by replacing the Expanded Polystyrene (EPS) with Poly-urethane Foam (PUF) insulation. The methodology has been validated against the actual data obtained from Penguin cold storage situated in Pune, India. It is found from the simulation results that the average reduction of cooling load for summer design day is 9.78 % while for winter design day it is 9.26 %, when 150 mm thick insulation of EPS is replaced by 100 mm PUF insulation. Due to this replacement the annual cooling energy is saved by Rs. 63875 with pay-back period of 6.8 years. Keywords: Cold storage refrigeration plant, simulation of refrigeration system, EnergyPlus simulation, cold storage insulation.
1. Introduction
A cold store is a building or a group of buildings with thermal insulation and a refrigerating system in which perishable food products can be stored for various lengths of times in set conditions of temperature and humidity. Such storage under controlled conditions slows the deterioration and spoilage that would naturally occur in an uncontrolled natural environment. In addition to providing control of temperature and humidity, cold stores can also be designed to deliver controlled atmospheres by maintaining the requisite concentration of various gases that aid in the preservation of food products. Thus, cold storage warehouses play an important role in the storage of food products in the food delivery chain throughout the year under conditions specially suited to prevent their degradation. This function makes seasonal products available all year round. The quality and nutritional value of food products is affected by the time and temperature of the storage. Large temperature fluctuations during storage, transportation, and handling accelerate the deteriorative effects to food products. Proper temperature and humidity levels have to be maintained in the warehouse at all times to maintain high quality, nutritious and safe food products.
When fruits and vegetables are harvested, they are cut off from their source of water and nutrition and soon start to deteriorate. They lose weight, texture, flavor, nutritive value and appeal. In other words, they lose quality and potential storage life. Both time and temperature are important factors in post-harvest product deterioration. Cooling the harvested product controls the rate of quality loss by slowing the rate of living, which is called respiration. The warmer the temperature, faster is the deterioration and shorter the storage life; conversely, the cooler the temperature, the slower the deterioration and the longer the storage life. The more quickly the product is cooled, the longer it will remain marketable. [1]
year, India produces 63.5 million tons of fruits and 125.89 million tons of vegetables. India is also the largest producer of milk (105 million metric tons per year). India produces 6.5 million tons of meat and poultry, as well as 6.1 million tons of fish a year. The perishable products transaction volume is estimated to be around 230 million metric tons. Although India has the potential to become one of the world’s major food suppliers, the countries inefficient cold chain network results in spoilage of almost 35 percent of its total agricultural production. India, therefore, has tremendous growth potential with respect to rural-based food processing. [2] Till the year 2009, the total number of cold storages in India is 5,381 with total installed capacity of 24.45 million MT. Uttar Pradesh and West Bengal accounts for more than 60 per cent of the cold storage capacity followed by Punjab, Bihar, Gujarat, Andhra Pradesh and Madhya Pradesh. Over ninety five percent of the cold storages are in the private sector. [3]
2. Cold Storage Modeling
The initial phase in the development of the computer model consists of collecting the architectural, mechanical and electrical data required for the preparation of the input file. The accurate modeling of the components/subsystems of the cold storage building and mechanical systems has a significant impact on the building energy use. The files provided in EnegyPlus Documentation were helpful to create the initial input file for this study. The entire cold storage modeling, for the purpose of this project, is done using the architectural software package Google Sketch-Up as shown in figure 1. The Google Sketch-Up is a 3D modeling program optimized for a broad range of applications such as architectural, civil, mechanical, etc. and is available in free as well as professional versions.
Figure 1 Google Sketch-Up environment
Figure 2 EnergyPlus screen
2.1 Cold storage description
The cold storage building taken for the study of simulation is Penguin Cold Storage situated in the region of Khed Shivapur of Pune city. The cold storage plant is as shown in figure 3. The cold storage has multi zones, maintained at different temperature, depending up on the requirement of commodities. A prototype cold storage model is of a distribution type where product is constantly shipped from and received in the warehouse. Also, the product is assumed to arrive “at-temperature”, which means that there are no additional thermal gains or losses to the zone on account of the shipped and received product.
Figure 3 Penguin cold storage plant
2.2 Cold storage layout
Figure 4 Cold storage floor plan
The ColdRoom has a floor area of 8 m x 5 m with the height of 4 m. Thus area of ColdRoom is 40 m2 and a volume of 160 m3. The “Dock” is available at the immediate entrance of cold storage building which is a separate zone that serves as the staging area for incoming and outgoing products. The office of a cold storage and ante room for loading and unloading of the commodities is as shown in figure 4. The condensing unit i.e. evaporative cooled condenser with two fans and a pump is located outside the zone in still atmosphere.
2.3 Cold storage construction
The walls of the cold storage zones are modeled as a layer of solid concrete block followed by three layers of EPS and a layer of Aluminum from outside to inside respectively. The insulation thickness is different for the zone and the dock. For the zone walls, three different values of insulation thicknesses were studied for the insulating material of EPS, resulting in different thermal resistance values (R values) for each wall. Then 150 mm EPS insulation is compared with 100 mm insulation of PUF. The different insulation R-values studied are given below which are in the range of recommended values of ASHRAE [4].
a) 3.73 m2-K/W for EPS insulation of 100 mm b) 4.38 m2-K/W for EPS insulation of 125 mm c) 4.926 m2-K/W for EPS insulation of 150 mm d) 5.64 m2-K/W for PUF insulation of 100 mm
Table 1. Cold storage constructions
Foundation Raft Foundation - are designed by qualified & licensed structural / civil engineer.
Type of External walls of cold chambers
Solid concrete blocks with sand cement plaster and colored with light paint.
Type of Internal / Partition walls of Zone
Solid concrete blocks with sand cement plaster followed by three layers of EPS and a layer of aluminum from inside
Type of Roof/ Ceiling RCC slab with proper water proofing with reflective color paint. Proper slope is given to slab for rain water drainage.
Floors and Inter-Floors The floor comprises of base concrete and the Inter-Floors of cold storage chambers are perforated.
Machine Room The machine room walls are of concrete blocks with sand cement plaster and colored with light paint to accommodate compressors, receiver, SLHX and control panel etc.
Condensing Unit The evaporative condenser located outside the machine room with accessories like pump sets, water tank, water softener etc.
Ante Room Ante room contains Staircase and lift. The doors in ante room are properly insulated.
Loading/ Unloading Office
Machine Room Zone- 1
Zone- 2 Zone- 3
Zone- 4
The wall of cold chamber has a layer of solid concrete block on external side with 20 cm of thickness facing towards the external surroundings, and 15 cm of expanded polystyrene with 1 mm layer of aluminum foil facing into the conditioned space or the cooler. The roof of the dock and the zone is assumed to have the same construction as the zone walls. The floor construction for the warehouse is common for both the dock and the zone space. The floor has two layers, from outside to inside: 20 cm of concrete, and 12.5 cm of EPS insulation, resulting in a floor with a total thickness of 32.5 cm , and a U-value of 0.686 W/m2-K. The commonly used insulating materials for cold storage walls, floors and roofs and their details are given in Table 2.
Table 2. Applied insulation thickness details
Application Area Thickness of
Insulation (mm)
U value (W/m2K)
R value (m2K/W)
Exposed walls 150 0.27 3.70
Intermediate walls
and Inter-floors 50 0.58 1.72
Exposed roofs 150 0.24 4.17
Floors 125 0.29 3.45
2.4 Thermal insulation details
For the application of cold storage, the commonly used insulating materials as per recommendation of IS Codes their characteristics are given in Table No. 3. And for the purpose of this study the expanded polystyrene is used as insulation whose details are as follows: Type of insulating material - Expanded Polystyrene; Relevant IS Code -IS661:2000; Density - 15 kg/m3; Thermal Conductivity - 0.036 W/mK; Compressive strength at 10% deformation- 1.72 kg/m2; Water vapor - 1 per cm; Water absorption - Negligible
Table 3. Cold storage insulation characteristics [5]
Type of Insulation
Material Properties
Wall
Ceiling U value = 0.24 W/m2K
Floor U value = 0.29 W/m2K External
U value = 0.27W/m2K
Partition U value = 0.58W/m2K
ρ Density
Kg/m3
K value W/m0C
Thickness mm Thickness mm Thickness mm Thickness mm
EPS 15 0.036 150 75 150 125
PUF 32 0.023 100 50 100 80
XPS 30-35 0.025 100 50 100 100
Phenolic
foam 50 0.026 100 50 125 100
Mineral
wool 48 0.033 125 50 125 100
Bonded
fiber glass 32 0.033 125 50 125 100
2.5 Replacement of Expanded Polystyrene (EPS) by Polyurethane Foam (PUF)
The superior long term performance of metal faced insulated panels with rigid urethane cores is now widely recognized by cold storage investors and designers when compared with site assembled, multi-part, built-up cladding systems. This has resulted in significant growth for this type of construction system. The thermal conductivity (K) of material decides the insulation property of the material. Lower the K value better is the insulation property. In this study the comparison is made between most commonly used insulating materials for cold storage application i.e EPS and PUF, since K value for PUF and EPS is lower than other insulations. The K value for EPS is 0.036 W/mK where as for PUF it is 0.023 W/mK.
2.5.1 Technical specifications
PUF Panels available in sheets under following specification:
Panel Thickness: 40mm, 50mm, 60mm, 80mm, 100mm, 150mm, 200mm. Sheet Used: PPGI, SS-304
The matrix of PUF insulation core has a closed cell structure that guarantees reliable thermal performance over the lifetime of the building. The water vapour permeability of rigid urethane insulation is very low due to its closed cell structure. The energy saving contribution of PUF insulation is a very positive factor. Though the PUF insulation is better insulating material than EPS but it is costlier than EPS. Moreover the thickness required by PUF for the same insulation effect will be lesser than others, means more space in cold storage. Since EPS is having open cells allowing moisture ingress and deposition which causes poor insulation. On the other hand, the major advantages of PUF insulation are as follows:
1) High thermal efficiency of PUF ensures low heat transfer means low refrigeration load.
2) Reduces operational cost. Major cost for any cold chain operation is electricity. Lower the refrigeration load, lower the electricity consumption.
3) It gives good aesthetic appearance, and has an easy housekeeping. It is easy to erect or dismantle the PUF panels.
4) The thermal efficiency of PUF panel does not deteriorate over a period of time, making it long lasting insulation solution.
5) Better profitability, fast deployment and early revenue earning.
2.5.2 Energy calculations
Cold storage capacity – 1400 MT, Plant Size – 17 m (L) x 22 m (W) x 12m (H), Outside Temperature – 41 oC, Operating Temperature – -20 oC.
If the total area of wall, ceiling and floor are 936 m2, 374 m2, 374 m2 respectively, then the total rate of heat flow through the walls, ceiling and floor of cold chamber is given by,
(1)
Where, Q – Rate of heat flow (W)
K – Thermal conductivity of insulating material (W/m2K) A – Cross sectional area of wall (m2)
∆T– Temperature difference between outside and zone conditions (oC) x – Thickness of insulation (m)
Table 4. Energy calculations for EPS and PUF system
EPS System PUF System
WALL - Brick wall 225 mm, Cement 12 mm both side, EPS 150 mm, Aluminum foil 0.05 mm
WALL – Brick wall 225 mm, Cement 12 mm both side, PUF Panel 100 mm
CEILING- EPS 150 mm, RCC slab at roof CEILING – PUF Panel 100 mm FLOOR- EPS 125 mm, after tar felting and finish
with concrete PCC (75 mm)
FLOOR – PUF Panel 80 mm
Q wall = 13703.04 W Q wall = 13132.08 W
Q Ceiling = 5475.36 W Q Ceiling = 5247.22 W
Q Floor = 6570.43 W Q Floor = 6559.025 W
Q Total = 25748.83 W Q Total = 24938.3256 W
Hence, saving by putting modern PUF system is 17755.39 – 15966.14 = 810.505 W (i.e. 0.8105 kW) at 100% efficiency.
If plant runs for 24 hours, units saved will be 0.8105 x 24 = 19.45 Units.
If cost of a unit of electricity is Rs 9.00, then saving per day = 19.45 x 9 = Rs 175. Saving in month = 136.15 x 30 = Rs 5250.
Saving in a year = 136.15 x 365 = Rs 63875.
2.5.3 Pay-back period calculations Cost of EPS per square meter = Rs. 420 Cost of PUF per square meter = Rs. 680 Plant size = 17m x 22m x 12m
Table 5. Pay-back period calculations
EPS System PUF System
Total Cost for Wall area = 936 x 420 = Rs. 393120
Total Cost for Wall area = 936 x 680 = Rs. 636480
Total Cost for Ceiling area = 374 x 420 = Rs. 157080
Total Cost for Ceiling area = 374 x 680 = Rs. 254320
Total Cost for Floor area = 374 x 370 = Rs. 138380
Total Cost for Floor area = 374 x 620 = Rs. 231880
Total Investment = Rs.688580 Total Investment = Rs. 1122680 Additional Investment for PUF insulation = 1122680 – 688580 = Rs.434100 Energy saving with PUF = Rs. 63875 per year
Pay Back Period = 434100/63875 = 6.8 years
Thus to recover the additional cost invested for PUF insulation, the plant have to run 6.8 years without any extra profit, but with the replacement of EPS by PUF insulation the cold storage plant can save Rs. 63875 every year.
3. Simulation Methodology
Every energy simulation tool needs specific simulation parameters, for example, numeric convergence tolerances are used for the underlying simulation model of the engine. In addition, the definition of parameters such as the simulated period and the time step (if applicable) has to be provided. The general workflow for energy performance simulation tools employs the methodology as explained with the flow chart as shown in figure 5. [7]
Figure 5 Flow chart of simulation methodology Space Type and Usage
Equipment
Construction and Material Detail
Geometry I/P Location (Weather)
Occupancy
Lighting Schedule
Air Model
Space Load
Refrigeration system and components
Simulation of Cooling Load and energy consumption
IDF EPW
file
3.1 Cooling load calculations
Hourly cooling loads can be determined by using Energy Plus, energy simulation software. This software calculates thermal loads of buildings by the heat balance method. The heat balance method takes into account all heat balances on outdoor and indoor surfaces and transient heat conduction through building construction. It is more accurate than the weighting factor methods, since it allows the variation of properties with time steps. Internal and external loads are necessary to provide enough information for an energy balance in a space. The external load strongly influenced by weather and climate, thus collected and statistically assembled weather data is used in energy performance simulation. The purpose of cooling load calculation is important in choosing system components such as compressor, condenser etc. correctly and economically. Ideal cooling system requires good calculation of cooling load and all sources of cooling load must be taking into consideration.
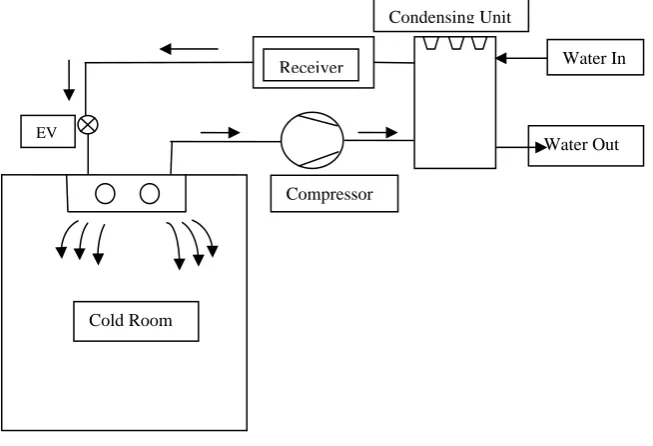
3.2 Refrigeration system and component selection
Refrigeration systems and their components are a major part of the input information for thermal simulation models. These systems are be modeled to reflect the actual system if the energy simulations tool (graphical user interface and the engine) provides enough flexibility. In EnergyPlus the components of refrigeration system is modeled based upon the regression analysis of that component. The regression results obtained are used to develop the mathematical algorithms for producing the coefficients of performance curve for a particular component.
Figure 6 Block diagram of DX type refrigeration system
A number of runs were required to achieve practical results. To ease the entry process for refrigeration systems in EnergyPlus, DX Cooling coil systems were originally used. The object related to DX cooling coil provides a shorthand way of describing standard HVAC system configurations. Those models include built-in default data and user input data entry for basic system options. EnergyPlus automatically sets up loops, branches and node names for the specified objects.
3.3 Performance curve for refrigeration system
The following section describes the use of performance curves in EnergyPlus for the refrigeration system of cold store. These objects may be used in any valid input field where a performance curve name is required. Performance curves are used directly to evaluate the performance of refrigeration system components. The curves are typically created by performing a regression analysis on tabular data for a particular equipment performance metric. The regression analysis determines the equation coefficients which are the primary input to all performance curve objects. Performance curves define a polynomial equation which represents a conditional response to a model input.
The bi-quadratic equation shown below is representative of the cooling capacity as a function of temperature performance curve for DX cooling coils. The fundamental equation for DX cooling coil capacity is:
TotDXCoolingCoilCap = a + b(Twb,i) + c(Twb,i)2 + d(Tc,i) + e(Tc,i)2 + f(Twb,i) (Tc,i) (2)
Where,
Twb,i = Wet-bulb temperature of the air entering the cooling coil (°C)
Tc,i
= Dry-bulb temperature of the air entering the condenser (°C)
Water In
Water Out Receiver
Condensing Unit
Compressor
EV
The regression analysis and summary statistical output is shown below. The equation coefficients are shown highlighted. In this example, the equation coefficients are: a = 0.757382, b = 0.014666, c= 0.000459, d = -0.00095, e = -6.7E-05 and f = -0.00015. These coefficients would be entered in a Curve:BiQuadratic object and used to describe the cooling capacity as a function of temperature for the DX cooling coil model. Minimum and Maximum values from the tabular data are entered as Min/Max values for the curve object in EnergyPlus. 3.4 Validation
To perform validation study, it is essential to obtain reliable experimental data. Therefore, the computer model developed for cold storage plant in Google Sketch-Up is validated against actual data obtained from Penguin cold storage. The zone and system configuration of the cold storage plant and its construction details are described in-depth in EnergyPlus program. The geometry and constructional materials applied for the plant developed in Google Sketch-Up are same as that of Penguin cold storage. In EnergyPlus, cooling coils can be modeled in great detail, but the detailed model requires a significant amount of input information for the coil. For a commercial cooling coil, much of this information is not available. Hence the built-in generic flat fin coil model available in EnergyPlus is used as a cooling coil model. Cooling capacity curve as a function of temperature is a biquadratic performance curve that parameterizes the variation of cooling capacity of the plant as a function of the outside dry bulb temperature and the condenser entering air temperature. The curve is described by equation (1) in previous section.
4. Results and Discussion
To verify the performance of the cold storage simulation module, predicted results of software, i.e. total cooling energy, power consumption of the cold storage refrigeration system, the zone temperature and RH are compared against monitored data. Data from cold storage is collected for every 1 hour from the daily work book of Penguin Cold storage. In the study, the calibration of cold storage is carried out separately over two design days with different outside conditions: summer design day, on 8th May, which corresponds to the shoulder portions of the summer season, and winter design day, on 21st Dec as a winter season. The simulation of two distinct operation periods has the advantage of avoiding some compensating errors that can occur when the calibration process is performed over one year, with periods of different operating conditions.
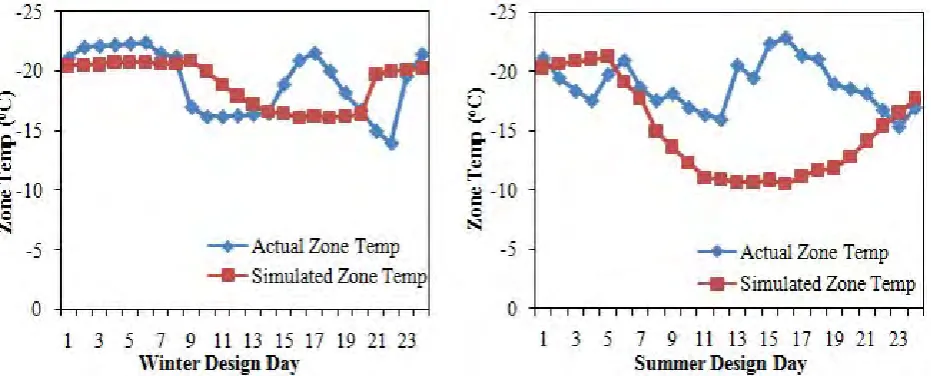
4.1 Temperature validation
The zone temperature values are obtained from temperature indicators located outside the each zone. It is a relatively the hottest day during the testing period in the month of May. The average ambient temperature during this month was 32.4 oC with extremes of 20–38.21 oC, while the indoor cold deck temperature set point remains in the range of -15 to -22 oC. The comparison between maintained zone temperature predicted by the simulation module and the observed data during the Design days is as shown in figure 7.
Figure 7 Comparison between simulated and actual temp of zone for winter and summer design day
4.2 Cooling energy/ power consumption validation
The comparison of simulation and actual results of cooling energy and power consumption of refrigeration system for the design month of May and December is given in figure 8. For the cooling energy simulation, it is found that the simulated result follows the ambient temperature profile well. The difference in peak loads is supposed to come from the difference in mathematical models used for cooling load calculations in EnergyPlus. The average difference between simulated and predicted cooling energy is 9.41 % and the maximum difference is 13.39 % happening in the period of 8:00 – 9:00 AM every day for the month of May.
Figure 8 Comparison between simulated and actual cooling energy for design days
This is due to the fact that the cold storage plant is shut off every day during the mid night period and it starts again at 7:00 AM in the morning. Therefore the compressors take maximum energy to produce suddenly increased cooling load to maintain the temperature of zone to the required values. In design month of December, the average difference in cooling energy is 9.25 % with maximum difference of 12.60 % happening in the first operating hour. The simulation results in other months of year also present the similar situation while the errors are observed to be a little smaller.
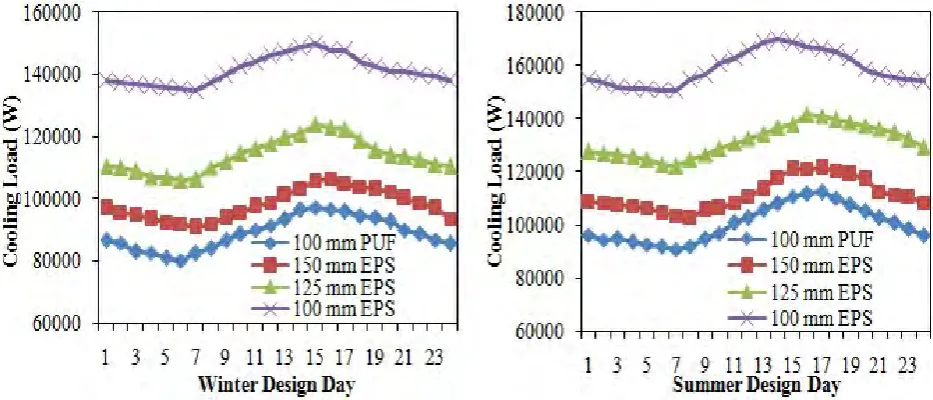
4.3 Effect of change in insulation materials and its thicknesses
In analyzing the thermal behavior of walls, different level of thermal resistance is achieved by adding extruded polystyrene (EPS) thermal insulation to the internal walls of the base case cold storage building. The thickness of EPS was increased in steps of 25 mm from 100 mm to a maximum thickness of 150 mm. The maximum thickness of insulation for cold storage application is determined according to the regulations currently used in India. The effect of thermal capacitance is simulated by putting the insulation on the inside surface of the concrete wall slab.
Three different cold storage wall constructions have been analyzed for EPS insulation, each having a different conductance, or U-value. The wall conductance has a major impact on the transmission loads, and therefore, on the cold storage cooling loads and ultimately on the temperature maintained in the cold chamber. The annual integrated cooling load for a cold storage having walls with a low conductance is higher than a cold storage having high conductance walls. As a result, a cold chamber with low conductance walls has a lower annual energy bill as compared with a cold chamber with high conductance walls.
Figure 9 Effect of change in insulation and thicknesses on cooling load for design days
For the thickness of 100 mm EPS on inside surface of cold storage wall, the average cooling load on winter design day is 141.426 kW and for summer design day it is having a load of 158.962 kW. But, with an introduction of 150 mm thickness of EPS the average cooling load reduces to 98.066 kW on winter and to 111.665 kW on summer design day causing an overall drop of 9.26 % and 9.78 % for respective design day. Accordingly, the annual cooling energy required for 150 mm EPS insulation will be lower than required for 100 mm EPS insulation.
When the peak loads are considered, it is observed that the average reduction in cooling load is obtained as 9.78 % in summer season and 9.26 % in winter when 150 mm thick insulation of EPS is replaced by 100 mm thickness of PUF. Although thickening of insulation produces effective savings on the annual energy consumption of the cold storage building, the insulation material cost also has to be considered. The reduction of cooling loads due to change in thickness of insulation for 100 mm, 125 mm, and 150 mm EPS and 100 mm PUF for the design days are given in the table below. Thus, from the simulation results it is clear that the amount of annual energy required for cooling can be reduced by Rs. 63875 per year due to replacement of EPS by PUF insulation. But additional cost of investment for PUF insulation can be recovered in 11.82 years.
Table 6. Reduction in cooling load with change in insulation and thickness
Insulation Thickness
Average cooling load (kW) Average % reduction in cooling load compared to 100 mm thickness (%) Winter
design day
Summer design day
Winter design day
Summer design day
125 mm EPS 113.845 131.776 19.50 17.10
150 mm EPS 98.065 111.665 30.65 29.75
100 mm PUF 88.982 100.734 37.08 36.63
Overall, the results evaluated by EnergyPlus program are in good agreement with measured data obtained from Penguin cold storage refrigeration plant which lead to a better evaluation of computer model of any building using EnergyPlus.
5. Conclusions
In this study, the cold storage simulation module is developed in graphical user interface, Google Sketch-Up and idf file generated in Google Sketch-Up is used as an input file for the whole-year building energy analysis program, Energy Plus. It is then validated against actual data obtained from Penguin cold storage refrigeration plant. The computer simulation of the cold storage refrigeration system agrees with the monitored performance to within generally acceptable accuracy.
cooling energy is 9.41 % with maximum difference of 13.39 % happening in the period of 8:00–9:00 AM every day for the design month of May where as for winter design month the average difference in cooling energy is found to be 9.25 % with maximum difference of 12.60 % happening in first few operating hours.
2) For the thickness of 100 mm EPS on inside surface of cold storage wall, the average cooling load for winter design day is 113.845 kW and for summer design day it is 131.776 kW. But, with an introduction of 150 mm thickness of EPS the average cooling load reduces to 88.732 kW for winter and to 100.846 kW for summer design day causing an overall drop of 22.05 % and 23.47 % respectively. The comparative study for EPS and PUF insulation is made with total emphasis on reducing the annual cooling energy of cold storage plant. It is found from the simulation results that the average reduction of cooling load for summer design day is 9.78 % while for winter design day it is 9.26 %, when 150 mm thick insulation of EPS is replaced by 100 mm PUF insulation. Due to this replacement the annual cooling energy saved by Rs. 63875 with pay-back period of 6.8 years.
It is believed that this work and its findings would give cold storage designers, architects, HVAC engineers and energy researchers a good idea about the likely impacts and a better understanding of dynamic thermal performance of cold stores.
Acknowledgement
Authors are thankful to Penguin Cold Storage personnel for their continuous help and support in assessing the cold storage data for validation of simulated work.
References
[1] Magoo Nitin, High-temperature refrigerated warehouse operation under real-time pricing of electricity, A thesis of Master of Science,
2003, pp. 1-151.
[2] Jog K. V, Cold storage industry in India, Proceedings of Refrigerated Warehouse & Transport Association of Australia, 2004, pp.
1-21.
[3] Matapurkar Aneesh, Sinha Arnav, Cold chain: Finally warming up to India, Infrastructure Today, 2011, pp. 22-25.
[4] ASHRAE Handbook of Fundamentals, 1993 (Section 26).
[5] National Horticulture Board Report, Technical Standards Number NHB-CS-Type 02-2010, Department of Agriculture & Cooperation,
Ministry of Agriculture, Govt. of India.
[6] Patel Amit M., Patel R. I., Optimization of different parameter of cold storage for energy conservation, International Journal of
Modern Engineering Research, Vol.2, Issue.3, May-June 2012 pp-1001-1005.
[7] Crawley Drury B., et al., Energy Plus: Creating a new-generation building energy simulation program, Energy and Buildings, 2001,


![Table 3. Cold storage insulation characteristics [5]](https://thumb-us.123doks.com/thumbv2/123dok_us/9666132.1494482/5.595.140.459.173.276/table-cold-storage-insulation-characteristics.webp)