Slamet et al. World Journal of Pharmaceutical and Medical Research
STUDY ON THE INITIAL ENVIRONMENTAL DESCRIPTION AS A REFERENCE
FRAMEWORK FOR TEGAL PORT DEVELOPMENT PLAN - PT. PELINDO III
TANJUNG EMAS – INDONESIA
Slamet Isworo1*, Poerna Sri Oetari2,3, M. Tozan Ajie3 Haviz Rachman Nursalim3 and Indah Noor Alita3 1Department of Environmental Health, Dian Nuswantoro University, Semarang, Indonesia.
2
Graduate School of Environmental Science, Diponegoro University, Semarang, Indonesia.
3Mitra Adi Pranata Company, Environmental Impact Assessment Consultants, Semarang, Indonesia.
Article Received on 20/03/2019 Article Revised on 10/04/2019 Article Accepted on 01/05/2019
A. INTRODUCTION
The Sea transportation is a means of connecting that is vital for island nations such as the Republic of Indonesia. This condition causes sea transportation facilities to be needed as a means of crossing to connect between islands to support regional potential in developing the national economy. To support sea transportation facilities and infrastructure, an adequate port is needed. (President of the Republic of Indonesia, 2009). Indonesia has many ports that must be developed, one of which is the port of Tegal. Tegal port is a city that belongs to the Central Java province which has the potential of port facilities and infrastructure that must be developed commercially. Based on the Decree of the Minister of Transportation Republic of Indonesia Number: KP. 414 of 2013 concerning determination of the national port master plan the development of Tegal Port in Central Java province is projected as a support for a large port under the coordination of PT. Pelindo (Persero) up to 2030. (Minister of Transportation, 2013)
Tegal Harbor is geographically located between the Port of Tanjung Emas in Semarang, which is the capital city of Central Java Province (in the East) and Cirebon Port which is a region of West Java Province (in the West) because it is very strategic as a buffer port and support for the economy Tegal Port Development is planned to be developed with the needs of a land area of 82.36 hectares and an area of 35.80 hectares of water with a Port of Environmental Interest Area of 12,360.8 hectares. Port development is planned to build docks, breakwaters, port pools, shipping lanes and port facilities and it is projected that the loading and unloading activities will be carried out with ships with a maximum weight of 5000 Deadweight Tonnage. Currently loading and unloading of goods in the Port of Tegal is not too much done because it is constrained by the depth of the shipping lane so that in and out of the port, the ship must wait for the tide first. Based on data obtained from the Tegal government, the potential of the hinterland area sent outside the area is actually very high, but because Tegal
wjpmr, 2019,5(5), 163-182 SJIF Impact Factor: 4.639
Research Article
ISSN 2455-3301
WJPMR
WORLD JOURNAL OF PHARMACEUTICAL
AND MEDICAL RESEARCH
www.wjpmr.com
*Corresponding Author: Slamet Isworo
Department of Environmental Health, Dian Nuswantoro University, Semarang, Indonesia.
ABSTRACT
Indonesia as an archipelagic country is very dependent on sea transportation, so it needs reliable port facilities and infrastructure. Tegal port is one of the commercial ports that has become a priority for port development in Indonesia. The study aims to be a frame of reference for the development plan for Tegal port. The research parameters are seawater quality using atomic absorption spectrophotometry, wind data based on windrose results, bathymetry base on Singlebeam Echosounder, ocean wave data using the ADCP SonTek Argonaut-XR, basic sediment sample data with Wentworth Scale classification. The results of sea water quality is TDS, pH, sulfide, Cd, Cu, Hydro Carbon, Surfactants and Zn that exceed the quality standard. Wind conditions indicate the dominant wind direction from the south (43.7%). The second dominant direction from the Southwest is 19.8 % with a dominant speed of 2 - 4 knots (63.7%). The average speed of the dominant direction is 4 knots. Overall water conditions are very gentle. Depth to - 5.0 m is found at a distance of 300-400 m from the coastline. The water area is affected by east wind and west wind which can cause high waves up to 1.0-1.5 meters. The tidal difference is estimated to be around 1.5-2.0 m, including the moderate tidal category, the water depth ranges from -2.00 to 2.50 mL MLWS. The type of tidal type is a predominantly semidiurnal mixture with a tidal mount value of 1,276 meters. Sedimentation of ± 2.00 meters has occurred. Biological parameters show damage to coral reef ecosystems. The index of plankton diversity > 2 is the good category. The research is expected to be used a reference framework for the development plan of Tegal ports
Slamet et al. World Journal of Pharmaceutical and Medical Research
Port experienced a silting problem which resulted in the ship being unable to dock in domestic shipping traffic, many goods sent out of the hinterland were hampered. This caused shipping to be carried out through the Cirebon port and the Tanjung Emas port in Semarang (Central Java Provincial Government, 2014). The support and develop the Port of Tegal, adequate port requirements are needed. Based on the port master plan of Tegal which is listed in the Minister of Transportation Regulation Number KP 928 of 2017, it is explained that to hold port activities must have adequate facilities and infrastructure. To fulfill these requirements, a land area of 82.36 ha is needed and the waters area is 35.80 hectares with an area of 12.360.8 hectares of the Port of Interest. Regulation of the Minister of Environment No. 05 of 2012 in the field of transportation, explains that the type of port development activities includes construction of a breakwater with a length of ≥ 200 meters, dredging of port ponds for shipping lanes, dredging activities at sea with a total volume of ≥ 500,000 m3, pier with length
≥ 200 m or area ≥ 6,000 m2, it must be completed with
an Environmental Impact Analysis study. (Minister of Transportation Republik of Indonesia, 2017).
Tegal port location is administratively located in Tegalsari Village (Tegal Barat District) and Mintaragen village (East Tegal district), Tegal city, Central Java province, located 165 km west of Semarang City or 329 km east of Jakarta. Tegal port has a strategic location as a liaison between the national and regional economic lines in the North Coast region as well as flanked by the Cirebon Port and Tanjung Emas Port (Semarang city). The boundary of Tegal port is north: Java Sea, south: population settlements and coastal highways north, East: population and west: fisheries port Tegalsari beach, Port Planning Tegal city includes general cargo pier located to the north of the existing dock, port facilities and infrastructure including the creation of access roads, breakwaters, dredging of port ponds and grooves shipping, dredge material placement activities, construction of the port association industry, office zones, trade business zones, logistics zone, docking zone and tourism zone. The development of the port city of Tegal is very important because the sedimentation problem causes sedimentation that is quite high in the lanes and ponds so that ships that can only stop ships with maximum screen depth are less than - 3 m LWS, so the port potential is not optimal, when facilities and infrastructure the port is sufficient. (Mayor of Tegal, Central of Java, 2012).
The Environmental Analysis Study on the development process of Tegal Port, a study of the baseline environment of the sea waters is needed in the tegal port development plan of PT. Pelindo III so that it is hoped that in-depth information can be obtained related to the implementation of activities that will be carried out since the pre-construction, construction and operation stages so as not to disrupt the environment at the Tegal port
development and development project site. This research concentrates more on the environmental status of the coastal waters of the ports of Tegal and surrounding areas that have the potential to support environmental change. Climatic conditions, currents and waves, seawater quality, shoreline change, coastal sedimentation are the subject of study and become the base line The existing condition of the port of Tegal and become the frame of reference for the development of Tegal port will come, (Japan International Cooperation Agency, 2011).
B. METHODOLOGY
Data collection and analysis methods will examine several types of data in the initial description of the environment at the research site, as follows:
1.Sea Water Quality a) Types of Data collected
The type of data collected is the quality of sea water including physical and chemical parameters.
b) Sampling Location Example
Slamet et al. World Journal of Pharmaceutical and Medical Research
Figure 1: Seawater Quality Sampling Location c) Sampling and Data Collection Methods
Sampling is done using a water sampler. The water samples of each depth are put together and put in a bucket. Water samples are then put in sample bottles which are labeled in the form of dates, hours and
sampling locations. The sample bottle is then inserted into the ice box and taken to the laboratory for analysis. Certain parameters are taken directly (directly). The method of measuring and analyzing water quality is presented in the following table:
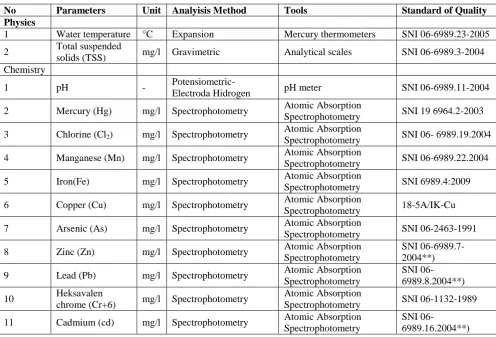
Table 1: Water Quality Analysis Methods (Minister of Environment of Republic Indonesia, 2003).
No Parameters Unit Analyisis Method Tools Standard of Quality
Physics
1 Water temperature °C Expansion Mercury thermometers SNI 06-6989.23-2005
2 Total suspended
solids (TSS) mg/l Gravimetric Analytical scales SNI 06-6989.3-2004
Chemistry
1 pH -
Potensiometric-Electroda Hidrogen pH meter SNI 06-6989.11-2004
2 Mercury (Hg) mg/l Spectrophotometry Atomic Absorption
Spectrophotometry SNI 19 6964.2-2003
3 Chlorine (Cl2) mg/l Spectrophotometry
Atomic Absorption
Spectrophotometry SNI 06- 6989.19.2004
4 Manganese (Mn) mg/l Spectrophotometry Atomic Absorption
Spectrophotometry SNI 06-6989.22.2004
5 Iron(Fe) mg/l Spectrophotometry Atomic Absorption
Spectrophotometry SNI 6989.4:2009
6 Copper (Cu) mg/l Spectrophotometry Atomic Absorption
Spectrophotometry 18-5A/IK-Cu
7 Arsenic (As) mg/l Spectrophotometry Atomic Absorption
Spectrophotometry SNI 06-2463-1991
8 Zinc (Zn) mg/l Spectrophotometry Atomic Absorption
Spectrophotometry
SNI 06-6989.7-2004**)
9 Lead (Pb) mg/l Spectrophotometry Atomic Absorption
Spectrophotometry
SNI
06-6989.8.2004**)
10 Heksavalen
chrome (Cr+6) mg/l Spectrophotometry
Atomic Absorption
Spectrophotometry SNI 06-1132-1989
11 Cadmium (cd) mg/l Spectrophotometry Atomic Absorption
Spectrophotometry
SNI 06-
Slamet et al. World Journal of Pharmaceutical and Medical Research
d) Methods of Analysis of Sea Water Quality
Parameters of seawater quality analyzed include physics, chemistry and biology. Certain parameters are directly measured, especially some physical parameters, while other parameters are examined in the laboratory. The results of the analysis of sea water quality were analyzed compared to the quality standards of seawater quality, referring to the Decree of the Minister of Environment No. 179 of 2004, and Decree of the Minister of Environment No. 51 of 2004 concerning Sea Water Quality Standards in Indonesia as follows
Table 2: Sea Water Quality Standards for Marine (Minister of Environment, 2004).
Parameters Unit Standar
Physics
Brightness m >3
Turbidity NTU
Suspended
Solid mg/L 80
Temperature ℃ Natural (< +2℃)
Chemistry
pH 6.5 - 8.5
Salinity Natural(< +5)
DO mg/L -
BOD5 mg/L -
Hydrocarbon mg/L 1
Oil and fat mg/L 5
Microorganism
Faecal Coliform /100ml -
Total Coliform /100ml 1,000
Bacteria /100ml -
Plankton /100ml -
2. Oceanography
The phenomenon and dynamics in the waters of the sea is one of the important things that must be considered in various activities in the sea waters. The movement of dynamic seawater masses over time has an influence on water dynamics, (Robert H. Stewart, 2008).
a) Types of Data collected
The hydro-oceanographic parameters observed in this study include bathymetry, tides, ocean currents and sedimentation conditions.
b) Location of sampling and data collection
Oceanographic sampling locations were taken in waters near the project site location including primary data in the form of: wind conditions, existing coastline ground check, watershed sediment data, sediment transport data, current data, wave data, tidal data and secondary data derived from research in the tegal port area.
c) Sampling and Data Collection Methods Types of Data collected
The hydro-oceanographic parameters observed in this study include bathymetry, tides, ocean currents and sedimentation conditions.
Location of sampling and data collection
Oceanographic sampling locations were taken in waters near the project site location including primary data in the form of: wind conditions, existing coastline ground check, watershed sediment data, sediment transport data, current data, wave data, tidal data and secondary data derived from research in the Tegal port area.
Sampling and Data Collection Methods
Wind data, referring to the windrose results that have been calculated previously, the data collection of wind conditions in the coastal area around Tegal Harbor is done through secondary data obtained from wind recording data at the BMKG-Maritime Meteorological Station of Tegal. Wind data obtained include: in the form of maximum daily wind speed and direction data every month for 10 years.
Bathymetry, bathymetry maps in Tegal waters using maps obtained from the Navy's Hydro-Oceanographic Center Referring to SNI 7646: 2010 concerning the Hydrographic Survey using Singlebeam Echosounder that in general the taking of bathymetry data is done by surveys using GPS devices and depth recorders in the form of Singlebeam Echosounder with accuracy level a = 0.5 m and b = 0.013 (a and b are variables used to calculate accuracy of depth). GPS functions to determine the position of a location point, while the Singlebeam Echosounder serves as a measuring device for the depth of the seabed against the surface of the water at that time. (National Standardization Agency, 2010)
Tidal. Tides are carried out directly every hour for 30 days. Then the tidal data is done by harmonic analysis using either the Least Square Method or the Admiralty Method. Tidal harmonic constants produce mean sea level (MSL). (Foreman, MGG., 1996). The results of the measurements analyzed are calculated as the resultant value, then the current rose is drawn to determine the dominant speed and direction. In general, current measurements are carried out using an automatic data recorder in the form of ADCP SonTek Argonaut-XR. Primary data retrieval will be carried out for 3 days at a representative observation station around the waters of Tegal Harbor. Next refers to Emery, W.J. & R.E Thomson (1998), that these measurements were carried out by the Euler method and carried out in a fixed or silent manner.
Slamet et al. World Journal of Pharmaceutical and Medical Research
Figure 2: Current and wave data recording equipment (ADCP) coastline change.
Coastline data is obtained by groundcheck using GPS (Global Positioning System). While the secondary data needed is a minimum of 10 years wind data, bathymetry and tides.
Data Analysis Method 1) Wind
Wind data that has been obtained from the results of
recording winds at BMKG - The Maritime
Meteorological Station of Tegal will then be analyzed and modeling of windrose roses and statistical analyzes performed to obtain data on the direction of the dominant wind, the average wind speed of each wind direction, and overall average wind speed. Analysis of windrose roses using windrose software issued by Enviroware.
b) Bathymetry
Bathymetry maps in Tegal waters that have been obtained from Dishidros Navy will then be analyzed using the spatial method of the 1995 Geographic Information System (GIS) and National Geodetic Datum (DGN 95) which refers to the WGS-84 international datum system (World Geodetic System 1984). (National Standardization Agency, 2010) In general, the software used for bathymetric map analysis is ArcGIS with a geometry correction level of about 0.5 pixels. Furthermore, the lay out of Tegal port development will be overlapped with bathymetry maps so that the bathymetry conditions can be identified at the location of the planned business and / or activity.
c) Tides
Analysis of tidal data will be carried out using harmonic analysis using either the Least Square Method or The Admiralty Method. The tidal harmonic constants produced by mean sea level (MSL), (Pariwono, J.I., A.G. Ilahude, and M. Hutomo. 2005.)
d) Flow
The current data that has been obtained will be analyzed to obtain the resultant value then the rose current modeling is done to determine the current velocity and the dominant direction.
e) Waves
Waves will be analyzed by forecasting from wind data using the Svendrup-Munk-Bretcheider (SMB) method so that wave heights and wave periods are significant. This data will be used to verify the modeling results. The wave direction observation is then performed waverose modeling to find out the dominant direction. (Ingmanson, D.E. and W.J. Wallace. 1985).
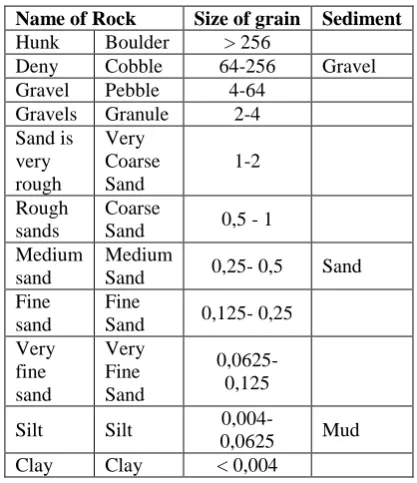
f) Water base sediments
Sedimentation in coastal waters is strongly influenced by oceanographic factors and river water flow which empties into the waters concerned. The table below shows the classification of grain size of basic sediments, as follows:
Table 3: Basic sediment grain size classification (Wentworth, 1922).
Name of Rock Size of grain Sediment
Hunk Boulder > 256
Deny Cobble 64-256 Gravel
Gravel Pebble 4-64
Gravels Granule 2-4
Sand is very rough
Very Coarse Sand
1-2
Rough sands
Coarse
Sand 0,5 - 1
Medium sand
Medium
Sand 0,25- 0,5 Sand
Fine sand
Fine
Sand 0,125- 0,25
Very fine sand
Very Fine Sand
0,0625- 0,125
Silt Silt 0,004-
0,0625 Mud
Clay Clay < 0,004
Slamet et al. World Journal of Pharmaceutical and Medical Research
Gambar 3: Sediment sampling location (Tegal Harbor Design Investigation Survey). Coastline Change
The forecast of the impact of shoreline changes (abrasion and accretion) on dredging activities is done through a modeling approach. The type of sediment at the measurement site, is used as one of the modeling parameters in addition to currents, wind, river discharge, tides and bathymetry. Modeling is carried out for conditions before the development of Tegal Port and after the development of Tegal Port, so that the impact of the Tegal Port Development on the sedimentation process will occur.
C. RESULTS AND DISCUSSION
Tegal Harbor has facilities that consist of a port pool, a wave barrier, a shipping channel and a pier. Current conditions, the port facilities owned by Tegal Port are as follows (1) Port ponds, the existing port pool area of around 100,000 m2, with depths ranging from - 3.5 m LWS. The depth condition is that the ship that can be anchored measures dead weight of no more than 500 DWT. (2). Waveguide Existing Tegal Port has been built breakwater with details as follows: west side breakwater with a length of 695 m, 1.8 m high Lws and 1.4 m wide, east side Breakwater with a length of 526 m high 1.8 m LWS and width 1 , 4 m and 250 m wave retaining. (3) Shipping flow. The flow of shipping owned by Tegal port has a length of 1,000 m, a width of 50 m, an area of 50,000 m2 and a water depth of -3 m LWS. (4) Three Pier. Pier 1 with a length of 132 m, width 10 m, area 1,320 m2 and depth of depth of -3.5 m LWS. Dock 2 with a length of 260 m, a width of 10 m, an area of 2,600 m2 and a depth of -3.5 m LWS. Dock 3 with a length of 50 m, width @ 10 m, area of 1,000 m2 and depth of -3.5 mLWS. The Tegal port also has a talud with a length of
1,680 m, a height of 1.80 m with a depth of -3.5 mLWS, a commercial warehouse with an area of 840 m2, a docking industrial area located in Tegal port with an area of ± 15 Ha, and other facilities, besides 30,717 m2. The environmental conditions in and around the location of activities are needed as a basis for predicting the possibility of impacts on environmental components caused by the planned activities of the Tegal port - PT. Pelindo III Development Plan - Indonesia. Therefore, a preliminary study of the environment is needed as a base line and a reference framework for Tegal city port development. To get an initial picture of the condition and environmental status at the location of the study area, research and assessment are conducted. Based on the results of research on various environmental parameters that have been measured, the following results are obtained.
1.Climate conditions at the study site
Slamet et al. World Journal of Pharmaceutical and Medical Research
the end of the year. In addition, a similar pattern also occurs in rainy day data in the study area which shows the number of rainy days at the beginning of the year then declines in the middle of the year and will increase again at the end of the year. The average temperature based on the data from the Tegal City Central Bureau of
Statistics in 2017 shows that the average air temperature per month reaches 28.3 0 C with a minimum temperature reaching 25.5 0 C and a maximum temperature of 31.8 0 C. Data on climate conditions in the study area during the year 2007-2017 in full is presented in the data below.
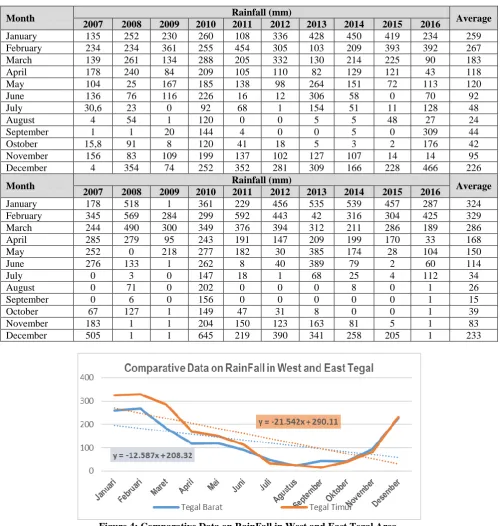
Table 4: Monthly Rainfall Data for 10 Years in West Tegal District and East Tegal.
Month Rainfall (mm) Average
2007 2008 2009 2010 2011 2012 2013 2014 2015 2016
January 135 252 230 260 108 336 428 450 419 234 259
February 234 234 361 255 454 305 103 209 393 392 267
March 139 261 134 288 205 332 130 214 225 90 183
April 178 240 84 209 105 110 82 129 121 43 118
May 104 25 167 185 138 98 264 151 72 113 120
June 136 76 116 226 16 12 306 58 0 70 92
July 30,6 23 0 92 68 1 154 51 11 128 48
August 4 54 1 120 0 0 5 5 48 27 24
September 1 1 20 144 4 0 0 5 0 309 44
Ostober 15,8 91 8 120 41 18 5 3 2 176 42
November 156 83 109 199 137 102 127 107 14 14 95
December 4 354 74 252 352 281 309 166 228 466 226
Month Rainfall (mm) Average
2007 2008 2009 2010 2011 2012 2013 2014 2015 2016
January 178 518 1 361 229 456 535 539 457 287 324
February 345 569 284 299 592 443 42 316 304 425 329
March 244 490 300 349 376 394 312 211 286 189 286
April 285 279 95 243 191 147 209 199 170 33 168
May 252 0 218 277 182 30 385 174 28 104 150
June 276 133 1 262 8 40 389 79 2 60 114
July 0 3 0 147 18 1 68 25 4 112 34
August 0 71 0 202 0 0 0 8 0 1 26
September 0 6 0 156 0 0 0 0 0 1 15
October 67 127 1 149 47 31 8 0 0 1 39
November 183 1 1 204 150 123 163 81 5 1 83
December 505 1 1 645 219 390 341 258 205 1 233
Figure 4: Comparative Data on RainFall in West and East Tegal Area. Based on the data above, the rainfall data in the Eastern
Tegal area is greater than the western tegal area, but when viewed in the linear modeling the rainfall trend in the Eastern Tegal area is lower based on the equation model y = -21,542 x + 290.11 compared to the Tegal
Slamet et al. World Journal of Pharmaceutical and Medical Research
Monthly rainfall data from 2007 to 2017 above, classification of wet months and dry months according to Schmidt-Ferguson obtained as that in the District of West Tegal the number of dry months was 43 times and wet months were 75 times. As for the Tegal Timur Subdistrict area there were 36 times the number of dry months and 65 wet months. Here is presented the type of climate according to Schmidt-Ferguson.
Tabel 5: Type of Climate (Schmidt, F. H. and J. H. A. Ferguson. 1951).
Climate
Type Q Value Information
A 0 < Q < 0,143 Very wet B 0,.143 < Q < 0,333 wet C 0,333 < Q < 0,600 a bit wet D 0,600 < Q < 1,000 Moderate E 1,000 < Q < 1,670 Aa Bit Dry F 1,670 < Q < 3,000 Dry G 3,000 < Q < 7,000 Very dry
H 7,000 < Q Extraordinary Dry
Calculation of Q value found that in the district of West Tegal has a Q value of 0.573 and in Tegal Timur District has a Q value of 0.553, so according to the climate type of Schmidt-Ferguson it has a rather wet climate type. Wind direction and wind speed data taken from the point of the Tegal Meteorological Station with conditions high 3 m above sea level with coordinates 06.51 LS; 109.09 BT. Wind direction and speed data will be presented in three (3) different scenario ways. First scenario. all data from the Tegal meteorological station were calculated from 2006 - 2016. the second scenario was only calculated data in the western season. The data will be taken every year from October to March and the third scenario is the calculation of data in the east season. The annual conditions are taken from data from April to September. The following is a calculation of wind direction and wind speed data from 2006 – 2016.
Gambar 5: The Windrose Tegal Area in 2006-2016 (Agency for Meteorology, Climatology and Geophysics. Tegal. 2016).
Figure 6: Windrose Tegal in West Season (October - March) Year 2006-2016 (Tegal Climatology and Geophysical Meteorology Agency, 2016).
The wind conditions can be seen in the windrose in the picture above showing the direction of the dominant wind is from the south, which is as much as 43.7%. the second dominant direction from the Southwest is 19.8%. The most dominant speed is 2-4 knots as much as 63.7% and the average speed in the dominant direction is 4 knots.
Figure 7: Windrose Tegal in East Season (October - March) Year 2006-2016 (Tegal Climatology and Geophysical Meteorology Agency, 2016).
Slamet et al. World Journal of Pharmaceutical and Medical Research
Table 6: The Dominant Wind Direction Data and Wind Speed in East and West Seasons. Direction
(East)
Dominant Wind Direction
(%)
Speed Dominant Wind Direction
(Knot)
Direction (West)
Dominant Wind Direction
(%)
Speed Dominant Wind Direction
(Knot)
North 5.318 3.224 North 10.196 3.449
Northeast 7.058 4.007 Northeast 1.905 3.757
East 1.392 4.714 East 0.257 3.2
southeast 1.441 3.103 southeast 0.566 3.182
South 55.119 4.071 South 31.874 3.893
Southwest 20.726 4.014 Southwest 18.898 4.237
West 0.944 3.211 West 10.556 4.302
Northwest 0.795 2.813 Northwest 17.302 4.461
Speed
(Knot) Total Wind Speed (%)
Speed
(Knot) Total Wind Speed (%)
0 – 2 152 7.555 0 – 2 148 7.621
2 – 4 1296 64.414 2 – 4 1225 63.079
4 – 6 510 25.348 4 – 6 445 22.915
6 – 8 40 1.988 6 – 8 100 5.149
8 – 10 6 0.298 8 – 10 16 0.824
>10 8 0.398 >10 8 0.412
Jumlah 2012 100% Jumlah 1942 100%
1. Sea Water Quality
Sampling of sea water quality is carried out at Tegal Port Pier. The table below shows the results of seawater quality analysis, as follows.
Table 7: Water Quality Measurement Results at the Port Pier.
No Parameters Result Standard Unit
Physic
1 Temperature 31 natural 0C
2 Suspended Solids 112 80 mg/l
3 Brightness 0.3 1.3 m
4 Smell smells smells -
5 Rubbish detected nill -
6 Oil Layer detected nill -
Chemistry
1 pH 7,0 6,5-8,5 mg/l
2 Salinity 0,90 natural mg/l
3 Total of Amonia 86,025 0,3 mg/l
4 Sulfida 0,0899 0,03 mg/l
5 Total of hdrogen 0,051 1 mg/l
6 Total phenol ompounds <0,01 0,002 mg/l
7 Surfaktan (detergen) <0,02 1 mg/l
8 Minyak dan Lemak 0,27 5 mg/l
Dissolved Metal mg/l
1 Hg - 0,003
2 Cd 0,0150 0,01 mg/l
3 Cu 0,0704 0,05 mg/l
4 Pb 0,0125 0,05 mg/l
5 Zinc 0,0187 0,1 mg/l
The measurement results of secondary data indicate that seawater quality at the Tegal port dock sampling point has Total Disolved Solid, pH, ammonia, sulfide, cadmium, copper and zinc values that exceed the quality standard according to the Minister of Environment
Slamet et al. World Journal of Pharmaceutical and Medical Research
flammable and foul-smelling gas. This gas can arise from the biological activity of bacteria decomposing organic matter in anaerobic conditions, such as on the coast. The flow of Java sea waters that are located in the port of Tegal, which is strong in bringing deep sea water that is rich in nutrients to the surface. The sea water provides organic ingredients for phytoplankton and zooplankton. When the organism dies, it will decompose by the effectiveness of anaerobic bacteria to produce Hydrogen Sulfide (H2S) compounds. Hydrogen sulfide is a
dangerous chemical compound in marine waters, H2S
content in the waters can cause ecological disturbances like other organisms. Standard H2S concentrations in
coastal waters are <0.002 ppm. This condition will be good if there is dilution in the waters such as the intake of rain water so that it can increase the pH of the waters (Van Wyk & Scarpa, 1999).
Therefore, because the planning for tegal port development is required, a waste treatment plant is required so that the H2S concentration of money goes to
the sea level below the specified standard.
2. Oceanography
The condition of the sea waters in the Java Sea in the study area plan is generally relatively calm in terms of ocean dynamics such as low waves, relatively small wave frequencies and short wavelengths. The overall condition of the waters in Tegal Harbor is very gentle. Depth to - 5.0 m is found at a distance of 300-400 m from the coastline. These waters are affected by east winds which usually occur in the period from July to September and west wind (September-December) which can cause high waves up to 1.0 m -1.5 m in the waters. The tidal difference is estimated to be around 1.5 m - 2.0 m, so it belongs to the medium tidal category.
In the analysis of the angina factor is very decisive, winds cause ocean waves, therefore wind data can be used to estimate the height and direction of waves at the study site. Given that the wave data from field measurements are not carried out and there are only small and short notes, so that the data does not reflect the overall wave conditions, the wave prediction results will be used based on wind data. Wind data is needed as input data in wave forecasting so that a wave height plan is obtained. The maximum daily direction and wind speed will be used to predict the height and maximum wave period that the wind can generate in a given period of time. (Bauer, S., & Hasselmann, K, 1996)
Figure 8: The Windrose Tegal Area - Wind Direction and Wind Speed Data From 2006 - 2016: (Tegal Climatology and Geophysical Meteorology Agency, 2016).
From the results of the above calculation, a significant planned wave height is taken according to the 50-year return period of 2.50 meters. According to the Meteorology and Geophysics Agency the wave height 2.5 - 4 meters (dangerous), wave height of 1.25-2.5 meters (very alert) and wave height of 0.5 - 1.25 meters (light alert) therefore adequate break water is needed. (Meteorology, Climatology and Geophysics Agency, 2016).
Bathymetry
The bathymetry survey based on the Survey Investigation document was carried out on July 3, 2015 until July 8, 2015 using 2 (two) boats and 2 (two) survey tools namely Singlebeam Echosounder Hi Target Type D370 High Frequency. The survey conducted on an area of 300 ha using a survey interval of 25 meters and as a rinse using a 100 meter survey interval. Based on the hssil analysis, Tegal Port is classified as shallow. the depth range is -2.00 to 2.50 mLWS (Mean Low Water Spring). This is considered insufficient because the expected depth is -3.50 mLWS. considering the depth needed for the channel and port pool in the planned development of Tegal Port ranges from -7.00 mLWS.
In the development of Tegal Port, the pier is planned to accommodate vessels with a maximum capacity of 5000 DWT, so that it is necessary to support several facilities such as adequate shipping lanes. The shipping flow that will be planned is a new shipping channel with water bathimetry conditions on the project site ± 3 m LWS. To meet the standard as the main port according to Government Regulation Number 61 of 2009, dredging of port ponds and shipping lines will be carried out to a depth of - 7 m LWS for existing ports and new ports.
Slamet et al. World Journal of Pharmaceutical and Medical Research
shipping lane at a new port of 1,970,000 m3. Dredging strength can potentially cause significant impacts on the hydrological and ecological systems, changes in bathymetry, ecosystems, and disrupts natural processes in marine waters. Dredging area of port ponds and shipping lanes based on survey data Tegal Port's design investigation has a length of 2.7 km with 2 starting points, namely in the existing port pond and in the planned pond for Tegal Port development with slope slope 1: 4. The dredge equipment used is Cutter type suction hopper dredger (CSHD) and or dredger trailing suction hopper dredger with a production capacity of 2,000 m3 / hour and clamshell dredger with a minimum grab capacity of 5 m 3 to 8 m3. (President of the Republic of Indonesia, 2009 and Marks, K. M., and Smith, W. H. F., 2008).
Figure 9: Layout Plan for Dredging Depth of Tegal Harbor Pool (Tegal Harbor Design and Investigation Survey).
Referring to the Minister of Transportation Regulation number 52 of 2011 concerning dredging and reclamation Article 5 paragraph 1 states that the technical requirements for dredging work include: (a) technical design, (b) dredging equipment, (c) work methods, and (d) location of disposal results dumping area. Therefore the study of the initial description can be used as a baseline at the construction stage of Tegal port development.
Tidal
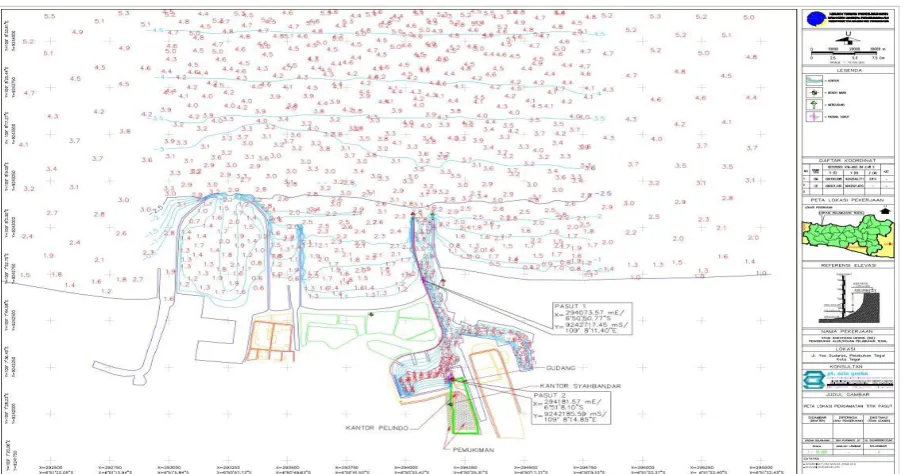
Tidal observations on the Tegal Port Dedign Survey survey document for 15 days starting on July 1, 2015 until July 15, 2015 with observations of water levels every one (1) hour. Placement of tidal observation stations based on conditions on the field that meet the requirements. where the observation location must be in the bathimetric measurement area, easy access and uninterrupted community activities during observation. Tidal observations were carried out in two observation locations. the first location is in the shipping channel (tidal sampling station) and the second position is at the existing location tidal measurement Tegal Port (tidal sampling station 2). This aims to correct the results of each other so that the tides in Tegal port can be ascertained the value of tides and lows. These observations produce a type of tidal with a mixed type with a semidiurnal predominance. meaning that in general in 1 day there are 2 times the tide and 2 times the tides with different heights and periods, but sometimes there is one tide and ebb in one day. Whereas tidal mounts in Tegal port amount to 1,276 m LWS. (Low Water Springs). (Foreman, MGG., 1996). The map below shows the conditions of the bathrimetry as follows:
Slamet et al. World Journal of Pharmaceutical and Medical Research
Figure 11: Tidal Conditions in the Shipping Channel of Tegal Exiting Port (Station Tides 1).
Figure 12: Tidal Chart at Tegal Exiting Harbor Pool (Tidal station 2 of Tegal Harbor). The graph of the comparison of tidal data in Tegal harbor
with almost no different models with the results of the survey and the results of the modeling so that the tidal
data is very thorough and can be used. Besides that, there are tidal morbidity in Tegal port as follows.
Grafik Probabilitas Pasang Surut di Tegal
-0.6 -0.4 -0.2 0.0 0.2 0.4 0.6
0 10 20 30 40 50 60 70 80 90 100 Probabilitas (%)
Elevas
i
M
uk
a Air
thd M
SL
(m
)
HHWL MHWS MHWL MSL MLWL MLWS LLWL
Slamet et al. World Journal of Pharmaceutical and Medical Research
From tidal modeling obtained tidal mounts of 1,276 meters. with correction of a tidal model compared to the results of a field survey with a review location in Tegal
Port. The tidal levels obtained from tidal observations from secondary data at Tegal port are as follows.
Tabel 8: Tidal elevation at Station 1 of Tegal Port.
Reference elevations Peilschaal (cm) MSL (cm) LLWL (cm)
Highest Water Spring (HWS) 112.99 57.55 119.88
Mean High Water Spring (MHWS) 94.33 38.89 101.22
Mean High Water Level (MHWL) 75.65 20.21 82.54
Mean Sea Level (MSL) 55.44 0 62.33
Mean Low Water Level (MLWL) 34.73 -20.71 41.62
Mean Low Water Spring (MLWS) 14.5 -40.94 21.39
Lowest Water Spring (LWS) -6.89 -62.33 0
Tunggang pasang (cm) 119.88
Tabel 9: Tidal elevation at Tidal Surround Station 2, Tegal Port.
Reference elevations Peilschaal (cm) MSL (cm) LLWL (cm)
Highest Water Spring (HWS) 112.99 66.85 135.39
Mean High Water Spring (MHWS) 94.33 46.76 115.3
Mean High Water Level (MHWL) 75.65 26.78 95.32
Mean Sea Level (MSL) 55.44 0 68.54
Mean Low Water Level (MLWL) 34.73 -27.27 41.27
Mean Low Water Spring (MLWS) 14.5 -46.93 21.61
Lowest Water Spring (LWS) -6.89 -68.54 0
Ride tide (cm) 135.39
Modeling Results
In tidal modeling tidal values are calibrated around the location and tidal value of Dishidros in Tegal Port. From tidal modeling obtained tidal mounts of 1,276 meters.
Wave Modeling
Based on the Tegal Port SID data, there are wave models obtained from wind data as the main data taken from
2005 to 2014. Following are wave models that occur in Tegal Port which are distinguished based on the direction of arrival. - North Wave Wave Modeling The wave modeling that takes place in Tegal Port has the direction of waves coming from the north. The figure below shows the wave direction from the North (Global) for the 5 year return period (Survey Iinvestigation Design – Tegal Port).
Slamet et al. World Journal of Pharmaceutical and Medical Research
Figure 15: The Waves from the North West (Port Area) (Survey Investigation Design – Tegal Port). The waves that occur in the northwest are with global
coverage on the high seas as high as 2.00 meters / second. Waves in the high seas are as high as 2 meters / second and waves in the port area are 0.60 meters /
second to 1.00 meters / second northwest. Resume Wave events that occur at the study location can be seen in the table below
Table 10: Resume of High Waves Each Direction in Tegal Harbor.
No Wave Direction Large Wave (Global) period of 5 years Wave Size (port area)
1 North 2.25 meters/second 0.80 - 1.20 meters/second
2 Northeast 2.75 meters/second 0.60 - 1.20 meters/second
3 East 2.50 meters/second 0.40 - 0.80 meters/second
4 Northwest 2.00 meters/second 0.60 - 1.00 meters/second
Wave direction and wave height categories are included in the alert category (Tegal Climatology and Geophysical Meteorology Agency, 2016)
Current
Current conditions at Tegal Waters are based on the Tegal Port Design Investigation Survey document carried out in 6 (six) stations and at three different depths namely 0.2 D. 0.6 D and 0.8 D. Continuous measurements are carried out for 1 x 24 hours. The equipment used for current data collection is the current OTT brand meter that uses mechanical principles. This tool uses a propeller that will spin when there is a current passing through it. The results of current measurements obtained in the form of the number of turns of the propeller for 52 seconds. On the other hand. to determine the direction of flow used floating bottles which are weighted and tied to the ship. The bottle weight is
Slamet et al. World Journal of Pharmaceutical and Medical Research
Figure 16. Tidal Chart of Tegal Port Flow (Survey Investigation Design Port of Tegal) Tidal Properties: Double Daily.
The nature of tidal waves is the nature of the Daily Double with a water ride, the average full moon water is 102 cm, and the tide is 12 cm dead. During the rainy season and full moon, the velocity of the current in the intra-Tegal port intra-channel reaches 3.25 m / s and when normal is 0.31 m / s Technically, the port's operational and shipping safety means that the existing conditions of Tegal port are classified as having a high risk because of the large currents in the grooves and shipping ponds during the rainy season and high sedimentation.
Therefore more comprehensive planning is needed from various fields of science so that the construction of the Tegal port can meet the requirements and technically feasible port and shipping safety operations (International Hydrographic Bureau, 2008).
Sedimentation
Sedimentation is a process of deposition of material through water media in a basin, in this case it is what happens on the coast of Tegal waters mainly due to the planned development of Tegal port. The sedimentation process can cause the balance of the coastal ecosystem to change so that it becomes ecologically bad. Therefore a preliminary study is needed which can be used as a baseline for developing Tegal's development. Sedimentation data obtained from the Survey Investigation Design document in the coastal port of Tegal is detailed as follows:
Sediment Distribution Pattern
From the data obtained from the Investigation Survey Design area domain model of sediment distribution (Lincoln F. Pratson and Margo H. Edwards, 1998). Tegal port has an area of 59,734,647.5 m2 or equivalent to 5,973 Ha. this area is taken so that in sedimentation modeling in other areas can be calculated as follows.
Slamet et al. World Journal of Pharmaceutical and Medical Research
Figure 18: The Initial Depth of Sedimentation Pattern (1st year). The flow condition of the Tegal Harbor cruise in the first
year immediately experienced sedimentation in the area
around the shipping channel. Sediment distribution in the area of about 0.40 meters.
Figure 19: The Initial Depth of Sedimentation Pattern (2nd year). The condition of the shipping lane of Tegal port in the
second year continued to experience high sedimentation. as seen in the picture above the sedimentation that
Slamet et al. World Journal of Pharmaceutical and Medical Research
Figure 20: Initial Depth of Sedimentation Pattern (3rd year). The condition of the shipping lane of Tegal port in the
third year continues to experience siltation until the depth of the runway of Tegal port has a depth of ± 4 to -5 meters, from the simulation of the sedimentation journey, it is seen that siltation in the shipping lanes of Tegal port is very high. proven for 3 years after silt dredging which occurred at ± 2.00 meters.
Deposits on Ponds and Sailing Routes
The sediment model in the Tegal Port channel modeled from the Old Port and Shipyard area to the shipping channel of the commercial port of Tegal Port, which continued to the end of the Tegal Port shipping line. The model besides is the flow position of Tegal Port. After modeling the sediment that occurs in the flow of Tegal port is more influenced by the condition of the outside port. One of the contributors to the sedimentation that occurred was from the Kali Gung river which is to the east and south of Tegal Port. This is due to the occurrence of currents at the location originating from the east and northeast which triggers the carrying of materials that cause sedimentation. After being modeled. the sediment that occurs in the flow of Tegal port is influenced by waves that occur in Tegal port, siltation occurs 35 centimeters per year. This is needed as a base line for port development plans that will be implemented and must be prevented so that the sedimentation process does not continue. These problems must be coordinated between institutions as stake holders. Based on spatial suitability based on Law Number 23 Year 2014 concerning regional government, which states that the authority of the sea area from the coastline to 12 nautical miles is the authority of the Provincial Government. Therefore, the suitability of the spatial plan for the sea refers to the Central Java Provincial Regulation Number 4 of 2014 concerning the Zoning Plan for the Coastal Areas and Small Islands of Central Java Province 2014-2034, in Article 19 concerning the direction of
development of public port networks, letters b which states that the collecting port includes Juwana port in Pati regency, Batang port in Batang Regency and Tegal port in Tegal. The suitability of the spatial layout for the land dimension refers to the Regional Regulation of Tegal number 4 of 2012 concerning Tegal Spatial Planning for 2011-2031, and is specifically stated in article 62 letter b, planned for collection ports. The location of Tegal port development activities is in accordance with the Tegal Spatial Plan and the Zoning Plan for Coastal Areas and Small Islands in Central Java Province.
3. Biological Components
Biological components are environmental components consisting of biological elements such as flora and fauna as indicators of environmental quality in the study area.
Flora
Flora which is very important to be considered is the condition of mangrove on the coast. Mangrove plants are one of the plant communities that live in coastal areas. Mangrove ecosystem. both as natural resources and as environmental protectors from coastal repair. also has a very important role in the economic and ecological aspects of the surrounding environment. The mangrove plants that were found around the study site were found in the pond area which is currently not used by the surrounding community. As for around the location of the pond, mangroves such as Casuarina sp. (Sea Pine). Rhizopora mucronata. Avecennia marina and Terminalia catappa. (Beny Harjadi, 2017). These plants can be used as indigenous plants that have the ability to adjust to the conditions at the research site. Reforestation needs to be done using the indigenous plant Casuarina sp. (Sea
Pine), Rhizopora mucronata. Avecennia marina and
Slamet et al. World Journal of Pharmaceutical and Medical Research
location (Giyanto et al, 2017). Other baseline data is taken from data originating from Pantai Indah Indah, which is located east of Tegal harbor. The Alam Indah Beach is included in the tourism zone in the planned development of Tegal Port. Some of the mangroves in the Alam Indah Beach location are artificial mangroves or planted. The types of mangroves found at Alam Indah Beach consist of mangroves api-api (Avicinea marina). Rhizopora mucronata, Cemara Laut (Casuarina sp.) and Terminalia catappa. The overall mangrove in the study area is not a mangrove conservation area, but reduced mangrove conservation can cause an abrasion process on the coastline on the coast of the sea tegal. Therefore, it is necessary to protect and rehabilitate mangroves on the coast around the tegal port by involving stakeholders by involving the surrounding community
Marine biota
Plankton is a group of tiny organisms that float in a body of water and are unable to move against the current. The plankton consists of two groups, namely phytoplankton and zooplankton. The role of phytoplankton in the waters is quite large. which functions as a primary producer of aquatic ecosystems and is an indicator of productivity of a waters. Based on the comparative research from Mulatsih (2004) which was carried out in the Karang Jeruk waters which were ± 6 km to the east from Tegal port explained that the abundance of phytoplankton found in the Jeruk Karang waters was 38 taxa. In the study. Mulatsih divided the sampling into 3 different locations. As for the results of the study are presented as follows.
Tabel 11: Results of Phytoplankton Analysis in Karang Jeruk Waters, Tegal Regency. Station Taxa
Number
Number of individuals
(individual / ltr) Diversity Index
Uniformity Index
Indeks Kemerataan
(H’) (e) (d)
I 29 2.851 2.8461 0.2362 0.7638
II 28 1.804 2.6109 0.225 0.7748
III 23 587 2.1502 0.2054 0.7946
Lee et al (1978) classify water quality criteria based on the phytoplankton diversity index which states that if the diversity index ≥ 2 then the quality criteria for a non-polluted or non-polluted waters are very mild. If the diversity index is between 2.0 to 1.6 the quality criteria for a waters are declared to be lightly polluted. and if the diversity index ≤ 1, the quality criteria for a waters are declared to be heavily polluted. Pielou (1975) continued. states that the smaller (near zero) uniformity index value can be interpreted that the spread of individual numbers of each species is not the same or there is no tendency for a species to dominate a community. on the contrary if the greater (close to one) uniformity index value can be interpreted that the number of individuals each species is the same or almost the same.
Plankton is a group of tiny organisms that float in a body of water and are unable to move against the current. Plankton consists of two groups, namely phytoplankton and zooplankton. The role of phytoplankton in waters is quite large, which functions as a primary producer of ecosystems in the waters and is an indicator of productivity of a waters. The zooplankton in Tegal port waters on average found 1 type of zooplankton at the location of the observation station with the dominant type being westella, whereas in coastal waters on average there were 4 types of phytoplankton at the location of the observation station with the dominant type was Fragilaria. (Zdenek Hubada Zdenek Hubálek, 2000)
The impact on plankton, benthos and nekton on land maturation activities is a derivative impact derived from changes in water quality, namely an increase in the concentration of suspended solids. Therefore, the estimated magnitude of the impact on plankton will be
based on the magnitude of the impact on the water quality. Each species has a sensitivity to environmental changes that are not the same. So, the method of forecasting the magnitude of the impact on plankton will be done using an analogy with similar activities, namely the activities of the existing port and through literature studies including the results of research published in scientific journals.
D. CONCLUSION
Study On The Initial Environmental Description as A Reference Framework for Tegal Port Development Plan - PT. PELINDO III Tanjung Emas – Indonesia is a research on the general description of the environmental aspects surrounding the Tegal port development plan, the results of the research are expected to be used as environmental baselines and terms of reference in the construction of Tegal port for the next stage so that the ecosystem balance in the research site is sustainable. Research can be used as a guide for conservation and rehabilitation steps around the Tegal port development plan.
ACKNOWLEDGMENTS
Slamet et al. World Journal of Pharmaceutical and Medical Research
Competing interests: The author has stated that no competing interests exist and are in accordance with the ethical code of writing applicable in the Republic of Indonesia
Data availability: The data presented in this article is in accordance with the working paper and supporting information files that have been stated by the author that there is no interest in competing and in accordance with the code of ethics.
REFERENCE
1. Central Java Provincial Government, Central Java Provincial Regulation Number 4 of Concerning Zoning Plans For Coastal Areas and Small Islands of Central Java Province, 2014; 2014-2034.
2. Bauer, E., Hasselmann, S., & Hasselmann, K An Operational Wave Forecast System Using Wind and Wave Data. ERS Applications, Proceedings of The Second International Workshop Held December 6-8, 1995 In London. Edited By T.-D. Guyenne. ESA SP - 383, European Space Agency, 1996; 309.
3. Emery, W. J. and R.E. Thomson. Data Analysis Methods In Physical Oceanography. Pergamon, USA, 1998.
4. Foreman, M. G. G., Manual for Tidal Heights Analysis and Prediction, Institute of Ocean Sciences, Sydney, Pacific Marine Science Report, 1996; 77-10.
5. Giyanto et al Status of Indonesian Coral Reefs COREMAP-CTI Oceanographic Research Center – Lembaga Ilmu Pengetahuan Indonesia. Jakarta, 2017.
6. Ingmanson, D. E. And W. J. Wallace. An Introduction To Oceanography. Wadsworth Pub Co, California, USA, 1985.
7. International Hydrographic Bureau IHO Standards For Hydrographic Surveys, International Hydrographic Bureau, Monaco, 2008.
8. Japan International Cooperation Agency Project Study Of The Port Development And Logistics Master Plan In The Greater Jakarta Metropolitan Area In The Republic Of Indonesia. Republic of Indonesia Directorate General Of Sea Transportation Ministry of Transportation of The Overseas Coastal Area Development Institute Of Japan (OCDI) Oriental Consultants Co., Ltd. (Oc), 2011.
9. Minister Of Transportation Minister Of Transportation Regulation Number KP 414 Of Concerning Determination Of National Master Plans. Jakarta, 2013.
10. Lincoln F. Pratsonmargo H. Edwards Introduction to Adaptation Mapping Using Sidescan Sonar And Multibeam Bathymetry Data. Marine Geophysical Researches, 1998; 18(6): 601-605. DOI: 10.1007 / BF00313876.
11. Lucky Kristi, Siddhi Saputro, Hariadi Hariadi Changes to Larangan Beach Line, Tegal Regency Through The Approach of The Genesis Model
(Generalized Model For Simulating Shoreline Change Journal of Oceanography, 2014; 3(1). 12. Mayor of Tegal Cetral Java Regional Regulation of
Tegal City Number 4 of Concerning City Tegal Spatial Planning For Tegal City Government, Central Java Indonesia, 2012; 2011–2031.
13. Minister of Environment Republic of Indonesia Decree of The State Minister Of Environment No. 37 Of Concerning Surface Water Quality Analysis Methods and Sampling of Surface Water. Jakarta, 2003.
14. Minister of Environment Republic of Indonesia Decree of The State Minister Of Environment Number 179 Of Concerning Errors in The Decree of The State Minister Of Environment Number 51 of 2004 Concerning Standard Jakarta Sea Water Quality, 2004.
15. Meteorology, Climatology And Geophysics Agency Forecast Wave Height Map. Center For Maritime Meteorology. Jl. Angkasa I No.2, Kemayoran, Jakarta Pusat - Indonesia, 2016.
16. Marks, K. M., and Smith, W. H. F., An Uncertainty Model For Deep Ocean Singlebeam And Multibeam Echosounder Data. Mar Geophys Res. doi 10.1007 / S11001-008-9060-Y, 2008.
17. Mulatsih, Sri Effects of The Presence Of Artificial Coral Reefs On The Controversy Of Biological Resources in Karan Waters, 2004.
18. National Standardization Agency SNI 7646: Indonesian National Standard Hydrographic Survey Using Singlebeam Echosounder ICS 07.040 Jakarta, 2010.
19. President of The Republic of Indonesia Government Regulation Of The Republic Of Indonesia Number 61 Of, Concerning Port. Jakarta, 2009.
20. President of The Republic of Indonesia, Law of The Republic of Indonesia Number 23 Year 2014 Concerning Regional Government. Jakarta, 2014. 21. President of the Republic of Indonesia Republic of
Indonesia Government Regulation Number 61 of Concerning Kepelabuhanan, Jakarta, 2009.
22. Pariwono, J.I., A.G. Ilahude, and M. Hutomo. Progress Oceanography of The Indonesia Seas. The Oceanography Society, 2005; 18(4): 42-50.
23. Pielou, E.C., Ecological Diversity. John Wiley & Sons, Inc. New York, 1975.
24. Regent of Tegal Regional Regulation of Tegal Regency Number 5 Of Concerning Regional Medium-Term Development Plans for Tegal Regency 2014-2019. Tegal. Indonesia, 2014. 25. Robert H. Stewart Introduction to Physical
Oceanography of The Department Of
Oceanography, Texas A & M University, September Edition. USA, 2008.
26. Skinner, B. J. & Porter, S. C. The Dynamic Earth. An Introduction to Physical Geology, 4th Ed. American Museum Of Natural History Edition. New York, 2000.
Slamet et al. World Journal of Pharmaceutical and Medical Research
Indonesia With Western New Guinea. Jakarta: Djawatan Meteorology and Geophysics, 1951. 28. Stewart, Robert H. Introduction to Pysical
Oceanography. Texas A & M University, 2008. 29. Van Wyk P. And J. Scarpa. Water Quality
Requirements and Management. Chapter 8 in Farming Marine Shrimp in Recirculating Freshwater Systems. Prepared by Peter Van Wyk, Megan Davis-Hodgkins, Rolland Laramore, Kevan L. Main, Joe Mountain, John Scarpa. Florida Department of Agriculture and Consumers Services. Harbor Branch Oceanographic Institution, 1999.