The alteration of intra-ligand donor-acceptor interactions
through torsional connectivity in substituted Re-dppz
com-plexes
Bethany Adams
2, Georgina E. Shillito
1, Holly van der Salm
1, Raphael Horvath
2, Christopher B.
Larsen
1, Nigel T. Lucas
*1, Michael W. George
*2, Keith C. Gordon
*1.
1Department of Chemistry, University of Otago, P.O. Box 56, Dunedin, New Zealand
2School of Chemistry, University of Nottingham, University Park, Nottingham, NG7 2RD, U.K.
ABSTRACT: The ground and excited properties of a series of [ReCl(CO)3(dppz)] complexes with substituted donor groups
have been investigated. Alteration of donor-acceptor communication through modulation of torsional angle and the number and nature of the donor substituent allowed the effects on the photophysical properties to be characterized though both computational and spectroscopic techniques, including TD-DFT, resonance Raman and time resolved infra-red. The ground state optical properties show significant variation as a result of donor group modulation, with increased angle between the donor and acceptor blue-shifting and depleting the intensity of the lowest energy transition, which was consistently ILCT in nature. However, across all complexes studied there was minimal perturbation to the excited state properties and dynamics. Three excited states on the picosecond, nanosecond and microsecond time scales were observed in all cases, corresponding to 1ILCT, ππ* and 3ILCT respectively.
Introduction.
There is a large amount of activity in fundamental and applied research in trying to ultilise solar photons to drive chemistry, which ultimately relies on understanding and controlling molecular excited states. Transition metal diimine complexes such as [Ru(bpy)3]2+ have been widely
exploited because of their long-lived 3MLCT excited
states and this has led to many applications including the recent resurgence in photo-redox catalysis.1 The
incorpo-ration of organic and inorganic components to synthesise metal−organic chromophores without forming a met-al−carbon bonds is a promising approach to producing new photofunctional molecules.2-3 The outstanding
[image:1.612.58.178.634.731.2]prop-erties of metal-dppz (dppz = dipyrido[3,2-a:2′,3′ -c]phenazine)) complexes have been exploited to produce long-lived charge separated excited states. Dppz (Figure 1) has been a previously studied system because of the nature of its electronic structure in which the unoccupied MOs show a level of segregation over differing sections of the ring system.
Figure 1. Structure of dipyrido[3,2-a:2′,3′-c]Phenazine (dppz).
One of the MOs is based on the phenazine (phz) rings (B, D and E) and the other on the phenanthroline (phen) rings (A, B, and C ). In metal complexes the low energy absorption properties are dominated by the M →
dppz(phen) MLCT transition as there is no overlap be-tween the metal d orbitals and the dppz(phz) MO.4-5
However the dppz(phz) MO is occupied after photoexci-tation.6-10 This electronic structure leads to a number of
interesting properties, for example both ruthenium(II)5, 11-12, platinum(II)13 and rhenium(I)8 complexes show
differ-ing photophysics on godiffer-ing from a protic solvent to an aqueous solvent with DNA present, with the MLCT(phz) being a dark state and the MLCT(phen) a bright, emissive, state.11, 14 In the later mixture, strong emission is observed
as the dppz intercalates into the DNA.15 This is due to the
interplay between the lowest lying excited states in these compounds. These can be MLCT(phz), MLCT(phen) or ligand-centered in nature.11, 14 For [Ru(bpy)
2(dppz)]2+ it has
been shown that the MLCT(phz) is enthalpically favoured and the MLCT(phen) entropically. In dppz the unoccu-pied MOs lie close in energy but they can be tuned by suitable substitution, commonly at the 10, 11, 12, 13 tions (ring E to tune the phz MO) or at the 3,6 or 2,7 posi-tions on ring A to tune the phen MO. A number of stud-ies have investigated the effects of placing electron with-drawing groups at these positions.16
transitions with these types of groups.17-20 Carbazole
elec-tron donating groups have been used at 10, 13 positions to also create strong ILCT bands that involve the donor group and the dppz(phz) MO.21 Pt complexes with these ligands show deep red emission and such ligands them-selves showed a wide range of emission wavelengths based on the type of substituent used. In a comprehen-sive study of dppz with TPA group or TPA-thiophene group substitution at the 3, 6 and/or 10, 13 positions Wang et al22 showed that the optical transitions could be tuned
by 1 eV and the Stokes shift (ν̃abs – ν̃em) from 3500 to 10500 cm-1. The use of π-conjugated donor groups has
changed the range of energies for the dppz MOs but also introduced new MOs that affect in a direct way the elec-tronic structure. These types of donor-acceptor systems provide opportunities to manipulate properties because of the nature of the acceptor MOs on the dppz ligand. Ra-man, time-resolved Raman and IR spectroscopic tech-niques are very powerful techtech-niques for use in unravelling the complex photophysics of metal-dppz complexes.23
We used such approaches to investigate how the photo-physics of substitution of dppz by TPA in the 11-position resulted in both the ligand and Re(CO)3Cl complex hav-ing near identical absorbhav-ing and emitthav-ing states.24 These
were both 3ILCT in nature i.e. TPA → dppz(phz)
charge-transfer. This finding was supported by the resonance Raman spectra which showed identical resonance en-hancement patterns form ligand to complex meaning that the absorbing state was dominated by an ILCT chromo-phore, the emitting states showed solvatochromic behav-iour with similar Stokes shifts as a function of solvent. Time-resolved infrared spectra showed the shift in ν(CO)
bands of the complex on going from the ground to the excited state was consistent with a ligand-centred excited states and two close lying states with the same electronic nature were identified. Substituting the TPA with CN and OMe substituents at the phenyl para positions of the TPA it was possible to tune the emission across the entire visi-ble spectrum by using the substituents and solvent.25
However in all cases the dominant absorbing and emit-ting states were ILCT in nature. It is also possible to alter the interaction between the dppz and TPA via differing linking groups. This has been done for [Ru(bpy)2(dppz-linker-TPA)]2+ complexes.26 In this study the resonance
Raman spectra at wavelengths towards the blue edge of the lowest energy absorption band, show enhancements of bpy and dppz-linker-TPA modes as the Ru → bpy MLCT transitions are intense and complicate the absorb-ing chromophores present. TD-DFT calculations on these systems reveal that the lowest energy transition is TPA →
dppz(phz) irrespective of the linker of the complexation to the metal. Furthermore the lowest excited state is shown to be the same for dppz-TPA, [ReCl(CO)3
(dppz-TPA)] and [Ru(bpy)2(dppz-TPA)]2+ as the excited state
[image:2.612.318.545.42.311.2]resonance Raman spectra of all three of these materials are identical with distinct bands that may be attributed to TPA.+.26
Figure 2. Complexes investigated in this study; a) [ReCl(CO)3(dppz-(OMe)2TPA)], b) [ReCl(CO)3 (dppz-(TPA)2)], c) [ReCl(CO)3(dppz-NPh2)], d) [ReCl(CO)3 (dppz-TPA)].
In this study we have compared the interaction between NPh2 and TPA donors and dppz in a systematic fashion by
altering the steric interactions between the units.
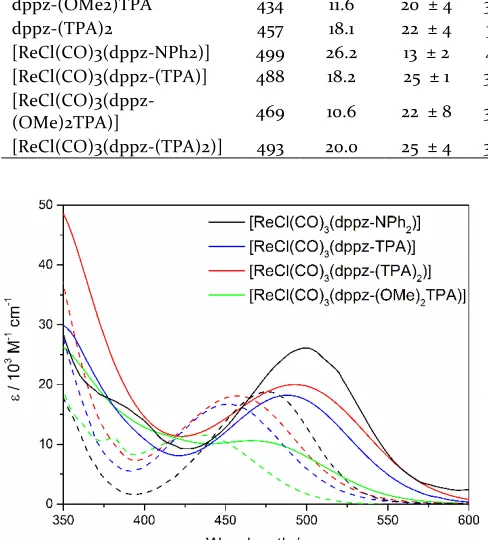
Electronic Absorption Spectroscopy and TD-DFT. The electronic absorption spectra of the ligands and their re-spective complexes in CH2Cl2 are presented in Figure 3.
Complexation to the ReCl(CO)3 centre results in a
red-shift in the absorption band but does not cause any signif-icant changes to the shape of the spectral profile. The absorbing and emitting states for all compounds studied show significant solvatochromic behavior with large Stokes shifts, suggestive of a significant change in dipole, ∆μ associated with the transition. This was explored fur-ther via conduction of a Lippert-Mataga analysis with the ∆μ values obtained presented in Table 1. The ∆μ values for the ligands and their respective complexes are similar. This is suggestive that the predominant charge transfer character is ligand based, with complexation to the metal centre resulting in minimal change. The ∆μ for the dppz-NPh2 ligand and its complex are significantly less than
Table 1. Experimental and TD-DFT (CAM-B3LYP/6-31g(d)) calculated data for the ligands and complexes in CH2Cl2.
Experimental Calculated
λ /
nm ε / 10 3
M-1 cm-1 ∆μ / D nm λ / f MO contribution angle D-A ∆μ / D
dppz-NPh2 476 18.8 10 ± 2 343 0.438 H→L (89%) 27.5 ˚ 7
dppz-TPA 457 16.9 22 ± 2 316 0.718 H→L (77%) 30.2 ˚ 3
dppz-(OMe2)TPA 434 11.6 20 ± 4 326 0.576 H→L (69%), H-2→L(19%) 40.3 ˚ 5 dppz-(TPA)2 457 18.1 22 ± 4 315 0.675 H→L (77%), H-3→L(16%) 46.3 ˚ 31 [ReCl(CO)3(dppz-NPh2)] 499 26.2 13 ± 2 412 0.562 H→L (87%) 22.8˚ 12 [ReCl(CO)3(dppz-(TPA)] 488 18.2 25 ± 1 390 0.780 H→L (75%), H-3→L (13%) 34.4˚ 26
[ReCl(CO)3(dppz-(OMe)2TPA)] 469 10.6 22 ± 8 386 0.586 H→L (70%), H-4→L (15%) 51.9˚ 21 [ReCl(CO)3(dppz-(TPA)2)] 493 20.0 25 ± 4 398 0.868 H→L (76%), H-4→L (10%) 49.6˚ 30
Figure 3. Electronic absorption spectra, measured in CH2Cl2 of the ligands (dashed) and complexes (solid) studied.
[ReCl(CO)3(dppz-NPh2)] displays both the greatest
red-shift and highest oscillator strength for the lowest energy transition, followed by that of [ReCl(CO)3(dppz-(TPA)]
and [ReCl(CO)3(dppz-(TPA)2)]. The addition of sterically
bulky OMe groups to the TPA unit alters the angle be-tween the TPA donor and the dppz acceptor from 34.4 to 51.9 i.e. by 17.5˚, disrupting the D-A conjugation, thereby increasing the transition energy. This drop in oscillator strength is likely also attributed to the increase in D-A angle as a result of poorer overlap of the frontier molecu-lar orbitals involved in the lowest energy transition. This is supported by TD-DFT calculations (Table 1), which rep-licate the observed trend in the relative absorption ener-gies. The addition of a second TPA donor group, causes a slight red shift and increase in oscillator strength for the lowest energy transition. Although the addition of a sec-ondary TPA group causes an increase in the D-A torsional angles for [ReCl(CO)3(dppz-(TPA)2)], the complex
exhib-its an absorption that is slightly red-shifted and increased in intensity relative to that of the single donor complex, [ReCl(CO)3(dppz-(TPA)]. It is suggested that the
disrup-tion in D-A conjugadisrup-tion caused by the increased D-A an-gle is compensated for by the addition of a secondary do-nor group. The TD-DFT calculations predict that the low-est energy state is consistently ILCT in nature, with the HOMO is predicted to lie on the TPA/NPh2 donor
sub-stituent and the LUMO is predominantly dppz(phz) based. However, the calculations also indicate that the lowest energy transition is not entirely H→L in nature. The differences in the relative contribution of configura-tion interacconfigura-tions to the transiconfigura-tion are manifested in the electronic absorption spectra, with an increasing contri-bution from the more delocalized H-3 or H-4 MOs to the transition, coinciding with an increase in transition ener-gy. Likewise, the involvement of the H-3 and H-4 MOs suggest a minor contribution from the ReCl(CO)3 centre,
which can be observed through slight enhancement of the CO based vibrational modes at blue excitation wave-lengths in the complexes’ resonance Raman spectra.
Figure 4. TD-DFT calculated (CAM-B3LYP, 6-31g(d), in a CH2Cl2 solvent field) frontier molecular orbitals of the com-plexes studied.
Resonance Raman Spectroscopy. The electronic nature of the Franck-Condon state can be probed using reso-nance Raman spectroscopy. Raman spectra of the ligands and respective complexes where measured at various exci-tation wavelengths across the lowest energy absorption band. The relative enhancement of characteristic vibra-tional modes compared to that on the non-resonant spec-trum taken at 1064 nm, provide an indication of the na-ture of the electronic transition occurring in that region.27-28 The resonance Raman spectra of
[ReCl(CO)3(dppz-TPA)] has been reported previously24
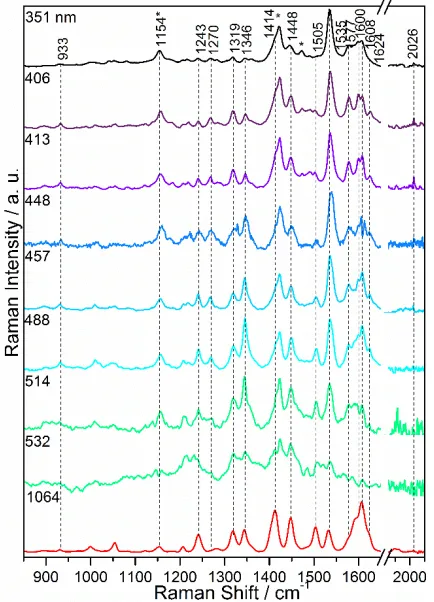
[image:3.612.318.544.365.535.2]en-ergy absorption band, with the spectra dominated by TPA modes and dppz(phz) modes, indicating that the Franck-Condon state was dominated by a single ILCT transition from the TPA donor to the dppz acceptor, with very min-imal indication of metal involvement in the blue region of the absorption band. The resonance Raman spectra of [ReCl(CO)3(dppz-(OMe)2TPA)] are presented in Figure5.
[image:4.612.60.277.122.423.2]
Figure 5. Resonance Raman spectra of [ReCl(CO)3 (dppz-(OMe)2TPA)] at various excitation wavelengths. CH2Cl2 sol-vent bands marked with *.
Between 351 and 457 nm excitation, the spectra are domi-nated by the 1535 cm-1 dppz(phz) based mode and there is
a slight enhancement of the totally symmetric carbonyl stretching mode at 2026 cm-1 which is visible up to 457
nm. In contrast, the bands at 1270, 1600 and 1608 cm-1,
predominantly associated with vibration of the TPA moie-ty are diminished in intensimoie-ty relative to that of the non-resonant spectrum. This suggests a lack of involvement of the TPA unit in this region, with the transition likely being ππ* in nature, shown by enhancement of dppz based modes, with a minor MLCT contribution indicated by slight enhancement of the 2026 cm-1 CO band. As the
λex increases to 488 nm, the enhancement pattern
chang-es, with the 1270, 1600 and 1608 cm-1 TPA modes
increas-ing in intensity as well as more delocalized dppz-TPA vibrations at 1243 and 1346 cm-1 and dppz(phz) modes at
1448 and 1624 cm-1. The 1535 cm-1 dppz(phz) band also
maintains intensity in this region. The 1154 cm-1 band is also enhanced and is likely associated with vibration of the TPA unit however it is also coincident with a CH2Cl2
solvent band. The bands decrease in intensity as λex
ex-tends to the tail end of the electronic absorption band.
The pattern of relative enhancement of both TPA and dppz(phz) modes is consistent with the presence of a dominant ILCT state across the lowest energy absorption band, with the higher energy tail end likely composed of a ππ* state, with a minor MLCT contribution, which is con-sistent with that predicted by TD-DFT.
The resonance Raman spectra of [ReCl(CO)3
(dppz-(TPA)2)] shows similar features (see ESI) to that of
[ReCl(CO)3(dppz-(OMe)2TPA)], with the lowest energy
transition being ILCT in nature, with a higher energy MLCT also present. The bands at 1601 and 1608 cm-1 in the
resonance Raman spectra of [ReCl(CO)3(dppz-NPh2)] (see
ESI) were weaker compared to the other complexes, likely due to lack of a complete TPA group, with the vibrations involving only the two nitrogen coordinated phenyl groups. The 2035 cm-1 CO band is no longer visible at λ
ex >
406 nm. Comparison between the resonance Raman spec-tra of [ReCl(CO)3(dppz-(OMe)2TPA)] and the previously
reported [ReCl(CO)3(dppz-TPA)],29 suggests that as the
D-A angle is increased, there is an increased MLCT con-tribution to the transition, indicated by enhancement of CO vibrations at longer excitation wavelengths. Further-more, the ILCT state is increased in energy, with TPA mode enhancement occurring at shorter wavelengths. This is consistent with both the electronic absorption spectra and TD-DFT calculations. Nonetheless, the domi-nant, lowest energy transition in all complexes is ILCT in nature.
Transient Absorption Spectroscopy. Transient absorp-tion maps of the [ReCl(CO)3(dppz-R)] complexes
record-ed are presentrecord-ed in Figure 6. The TA maps are recordrecord-ed 250 ns after initial excitation and other than a reduction in intensity, show no significant change to their spectral shape over time. The kinetic traces show monoexponen-tial decay to the ground state, with excited state lifetimes on the microsecond timescale observed. These data sug-gest that a single, long-lived state is being measured.
Figure 6. Transient absorption maps of the complexes stud-ied using 355 nm excitation. Spectra were taken 250 ns after excitation and recorded in CH2Cl2.
[image:4.612.318.555.474.649.2]substit-uent coordinated to the dppz ligand.30 The primary
differ-ence being the presdiffer-ence of a positive transient signal be-tween ca. 550-700 nm observed in the studied complexes which is not present in the unsubstituted species, thereby indicating involvement of the electron donating moiety to the long lived excited state measured. This is most clearly observed for [ReCl(CO)3(dppz-(OMe)2TPA)] and
[ReCl(CO)3(dppz-(TPA)2)] which display a prominent
positive transient signal at λs > ca. 500 nm and 525 nm
respectively, similar to that observed in the previously reported compounds containing a TPA substituted dppz moiety and has been attributed to the presence of TPA•+.24, 26 As discussed previously, [ReCl(CO)
3
(dppz-NPh2)] lacks a full TPA donor group, however it still
dis-plays positive features towards the red, suggesting likely involvement of the NPh2 substituent to the transition.
The excited state probed in the TA measurements is as-signed as a long lived 3ILCT state for all complexes. The
presence of other, shorter lived states were unable to be detected through TA measurements due to convolution with the laser pulse. However the presence of other, shorter lived species was able to be detected and charac-terized through the use of TRIR spectroscopy.
Time-resolved Infrared Spectroscopy. The photophys-ical properties of [ReCl(CO)3(dppz-NPh2)],
[ReCl(CO)3(dppz-(OMe)2TPA)] and [ReCl(CO)3
(dppz-(TPA)2)] were probed on the picosecond and nanosecond
time scales using time-resolved infrared spectroscopy (TR-IR). Across all the complexes, the TRIR data revealed the presence of three electronic excited states, which pos-sess excited state lifetimes on the picosecond, nanosec-ond and microsecnanosec-ond timescales respectively. The life-time of the latter state is consistent with the TA meas-urements above and is assigned to 3ILCT.
The TRIR spectra of [ReCl(CO)3(dppz-NPh2)] obtained
[image:5.612.321.567.33.527.2]after 355 nm photoexcitation at several time delays are presented in Figure 7.
Figure 7. TRIR spectra of [Re(CO)3Cl(dppzNPh2)] acquired in CH2Cl2 in in the ν(CO) stretching region (a) and in the fingerprint region (b). Kinetics of relevant bands are shown on the picosecond timescale (c) and nanosecond timescale (d).
The TRIR spectra obtained 1 ps after photoexcitation clearly show that the parent bands are bleached (2027, 1925, 1899 cm-1) and transient peaks are formed at 2016, 2006 and 1888 cm-1, which subsequently shift to slightly
higher energies. There is a prominent shoulder at ca. 2006 cm-1 which decays at the same time {τ = 37 (± 2) ps} as a
band is formed at 2019 cm-1 {τ = 40 (± 2) ps}. The lower
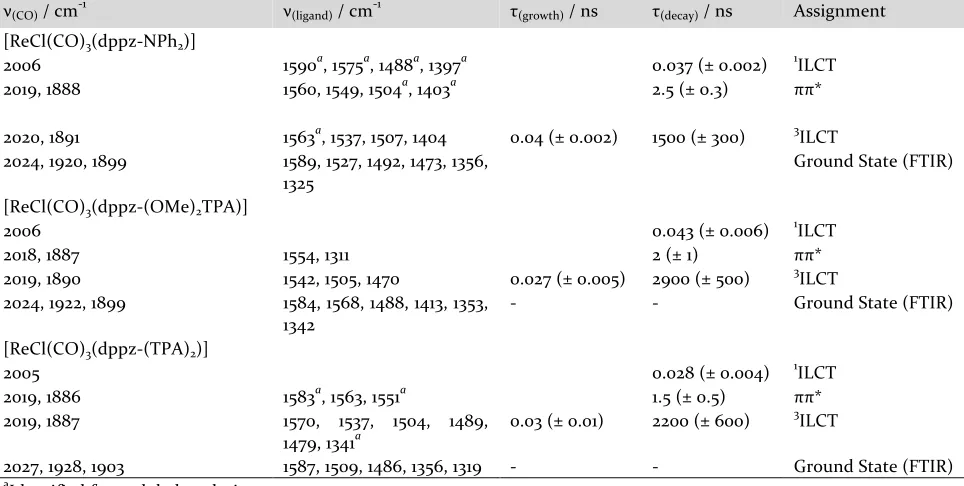
Table 2. Summary of the exited state TRIR bands observed after photoexcitation at 355 nm.
ν(CO) / cm-1 ν(ligand) / cm-1 τ(growth) / ns τ(decay) / ns Assignment [ReCl(CO)3(dppz-NPh2)]
2006 1590a, 1575a, 1488a, 1397a 0.037 (± 0.002) 1ILCT
2019, 1888 1560, 1549, 1504a, 1403a 2.5 (± 0.3) ππ*
2020, 1891 1563a, 1537, 1507, 1404 0.04 (± 0.002) 1500 (± 300) 3ILCT 2024, 1920, 1899 1589, 1527, 1492, 1473, 1356,
1325
Ground State (FTIR)
[ReCl(CO)3(dppz-(OMe)2TPA)]
2006 0.043 (± 0.006) 1ILCT
2018, 1887 1554, 1311 2 (± 1) ππ*
2019, 1890 1542, 1505, 1470 0.027 (± 0.005) 2900 (± 500) 3ILCT 2024, 1922, 1899 1584, 1568, 1488, 1413, 1353,
1342 - - Ground State (FTIR)
[ReCl(CO)3(dppz-(TPA)2)]
2005 0.028 (± 0.004) 1ILCT
2019, 1886 1583a, 1563, 1551a 1.5 (± 0.5) ππ*
2019, 1887 1570, 1537, 1504, 1489, 1479, 1341a
0.03 (± 0.01) 2200 (± 600) 3ILCT
2027, 1928, 1903 1587, 1509, 1486, 1356, 1319 - - Ground State (FTIR) aIdentified from global analysis.
across the parent bleach. More detailed analysis and band fitting suggest that a band decays at 1888 cm-1 to
form a band at 1891 cm-1 with an additional decay and
growth occurring around 1920 cm-1. The initial transient
with a band at 2006 cm-1 and the secondary product
char-acterised by an absorption at 2019 cm-1 are assigned to
different states and this is further confirmed using global analysis (see ESI). The behaviour and inter-conversion between these two states is similar to that of a recent re-port on rhenium complexes based on a number of 3-R-1-(2-pyridyle)-imidazol[1,5-α]pyridine (dmpy) ligands by Blanco-Rodrgiuez et al31, wherein two new vibrational
bands were found at lower energy with respect to the par-ent. They observed that on the timescale of tens of pico-seconds there was conversion of two states, where the lowest energy ν(CO) band decreased in intensity as the higher energy band drew in and this process was attribut-ed to an unusually slow ISC from S1 to T1 of ligand centred
states of a metal complex. This unusual observation of slow ISC of a metal based Re-diimine excited states was explained by symmetry constraints on the spin-orbit cou-pling, whereby the Re metal was thought of as isolated from the ligand moiety.
The TRIR data, in conjunction with the resonance Raman, Lippert-Mataga and transient absorption data suggests assignment of the picosecond and microsecond states as
1ILCT and 3ILCT respectively, where there is little
interac-tion with the metal centre in these states. The precise nature of the ligand based excited states is difficult to
glean from the ν(CO) bands alone. This has been explored further by correlating these results with measurements in the IR fingerprint region. On the nanosecond timescale, the TRIR bands at 2019 and 1888 cm-1 exhibit a
bi-exponential decay {τ = 2.2 (± 0.2) ns and 1800 (± 100) ns}, as shown in Figure 4. The lifetimes are in good agree-ment with the parent recovery {2.3 (± 0.5) ns and 2200 (± 500) ns} where the latter corresponds to 3ILCT decaying
back to the ground state. We tentatively assign the nano-second transient to a ππ* state but the dynamic interplay between these states is unclear. From the ν(CO) TRIR kinetics alone it is difficult to unambiguously assign, however unlikely, whether: (i) 1ILCT decays to the 3ILCT
and ππ* excited states; (ii) 1ILCT decays to the ππ*
excit-ed state which subsequently decays to 3ILCT excited state;
or (iii) 1ILCT and ππ* are formed simultaneously and 1ILCT decays to 3ILCT. The spectral shifts in the ν(CO)
bands to lower energies exhibited by all observed states are indicative of an increase in electron density in the carbonyl antibonding orbitals. This is consistent with presence of both dppz-centred ππ* and ILCT states.30, 32-33
The data in the fingerprint region should inform on both the natures of the ligand-based excited states and their kinetics.
In the fingerprint region a number of bleaches corre-sponding to the ground state spectra are observed after photoexcitation at 355 nm (Figure 7), together with a number of excited state features, which are summarised in
Table 2. At early times there are many subtle changes but there are clear bands at 1537, 1507, and 1404 cm-1, which
are formed at similar times {40 (± 10) ps} as the shoulder at 2006 cm-1 decays {37 (± 2) ps} and these are marker
bands for formation of 3ILCT state. There is also evidence
for two overlapping bands around the 1550 cm-1 region,
consistent with the decay of the 1ILCT state to the 3ILCT
state. The bands at 1537, 1507, and 1404 cm-1 decay on the
microsecond timescale as the parent bands fully reform {2.3 (± 0.5) µs}. There is a distinct band at ca. 1549 cm-1
The photophysics of [Re(CO)3Cl(dppzNPh2)] have been
investigated further by performing global analyses on the TRIR data and the results are shown in the ESI. The glob-al anglob-alyses show the presence of three states, with life-times of 30 ps, 2.2 ns and 1400 ns which is consistent with the single point kinetics described above. Furthermore, the initial state possesses peaks at 2009 and 1879 cm-1,
which are consistent with the observed features at 2006 and 1880 cm-1 at early times and are assigned above to 1ILCT. The global analysis predicts additional states to
possess very similar IR spectra to those observed for the
3ILCT and ππ* states, with excited state bands at 2018,
1916 and 1892 cm-1. It is also evident from these data that 3ILCT and ππ* are indistinguishable by analysis of the
ν(CO) region. However, significant differences exist in the fingerprint region. The initial process is predicted to show
decay of bands at 1575, 1488 and 1397 cm-1, with
simulta-neous growth of features at 1559, 1549, 1534, 1506, and 1404 cm-1, assigned to the conversion of 1ILCT to 3ILCT. For ππ*
the above-mentioned band at 1549 cm-1 as well as bands at 1560, 1504 and 1403 cm-1 are present, while 3ILCT is most
prominently characterised by bands at 1537 and 1507 cm-1.
In summary we interpret our results to show that we ini-tially form 1ILCT and ππ*, where 1ILCT decays to 3ILCT
and states 3ILCT and ππ* independently decay back to the
ground state.
The TRIR spectra of [ReCl(CO)3(dppz-(OMe)2TPA)] and
[ReCl(CO)3(dppz-(TPA)2)] are presented in ESI, with the
respective band positions and lifetimes summarised in
Table 2. Similar excited state behaviours to that of [Re(CO)3Cl(dppz-NPh2)] are observed, with both
com-plexes showing three distinct states, to which analogous assignments can be made. Marker bands for ππ* are ob-served at 1554 and 1551 cm-1 for [ReCl(CO)
3
(dppz-(OMe)2TPA)]and [ReCl(CO)3(dppz-(TPA)2)] respectively,
however, for the latter an even stronger additional band at 1563 cm-1 is present. As this complex possesses two TPA
donor units it is reasonable to assume that changes in bonding on this part of the complex differs significantly compared to the complexes containing only a single TPA donor or a NPh2 group. Finally, the 3ILCT state shows
ad-ditional unique bands for [ReCl(CO)3
(dppz-(OMe)2TPA)]and [ReCl(CO)3(dppz-(TPA)2)] at 1470 and
1570 cm-1 respectively, indicating the differences in
bond-ing that exist for these complexes. Common bands for
3ILCT for all three complexes exist at ca. 1540 and 1505 cm -1.
Conclusion.
We have shown that for a range of dppz complexes with differing donor groups there are distinct changes in the optical properties of the ground state. Substitution of methoxy groups to the TPA substituent increase torsional angle between the donor and acceptor, resulting in a de-crease in the extinction coefficient for the lowest energy transition and a blue shift in that absorption. However for each of these complexes there are common excited state properties with three distinct states namely a 1ILCT,
3ILCT and ππ* observed on the picosecond, microsecond
and nanosecond timescales respectively. Photoexcitation populates the 1ILCT and ππ* states. The 1ILCT
intercon-verts to the 3ILCT state. The ππ*state is independent of
the ILCT states. Changing the nature of the donor group from NPh2 to substituted TPA produces qualitatively
similar results both in terms of the nature of the excited states and their subsequent dynamics but the limited range of compounds studied means that it is difficult to generate generic conclusions on such trends and further studies are ongoing to elucidate fully the effects of the nature and number of donor groups together with the coupling (torsional angle and distance) on the dynamics of these long-lived charge separated states.
ASSOCIATED CONTENT
Supporting Information. Resonance Raman spectra, TRIR spectra, experimental de-tails, X-ray crystallography, syn-thetic scheme. This material is available free of charge via the Internet at http://pubs.acs.org.
AUTHOR INFORMATION
Corresponding Author
Prof Keith C. Gordon
Email: [email protected] Prof Michael W. George
Email: [email protected] Dr Nigel T. Lucas
Email: [email protected]
Author Contributions
of the manuscript. / ‡These authors contributed equally. (match statement to author names with a symbol)
Funding Sources
Support from the University of Otago and the MacDiarmid Institute for Advanced Materials and Nanotechnology
Notes
Any additional relevant notes should be placed here.
ACKNOWLEDGMENT
(Word Style "TD_Acknowledgments"). Generally the last paragraph of the paper is the place to acknowledge people (dedications), places, and financing (you may state grant
numbers and sponsors here). Follow the journal’s guidelines on what to include in the Acknowledgement section.
ABBREVIATIONS
CCR2, CC chemokine receptor 2; CCL2, CC chemokine ligand 2; CCR5, CC chemokine receptor 5; TLC, thin layer chroma-tography.
REFERENCES
(Word Style "TF_References_Section"). References are placed at the end of the manuscript. Authors are responsible for the accuracy and completeness of all references. Examples of the recommended formats for the various reference types can be found at http://pubs.acs.org/page/4authors/index.html.
1.
Stephenson, C.; Yoon, T.
Acc. Chem. Res.
2016,
49
, 2059-2060.
2.
Schanze, K. S.; Walters, K. A.
Mol. Supramol. Photochem.
1998,
2
, 75-128.
3.
Castellano, F. N.
Acc. Chem. Res.
2015,
48
, 828-839.
4.
Amouyal, E.; Homsi, A.; Chambron, J.-C.; Sauvage, J.-P.
J. Chem. Soc., Dalton Trans.
1990,
1841-1845.
5.
Friedman, A. E.; Chambron, J. C.; Sauvage, J. P.; Turro, N. J.; Barton, J. K.
J. Am. Chem. Soc.
1990,
112
, 4960-4962.
6.
van der Salm, H.; Fraser, M. G.; Horvath, R.; Cameron, S. A.; Barnsley, J. E.; Sun, X. Z.;
George, M. W.; Gordon, K. C.
Inorg. Chem.
2014,
53
, 3126-40.
7.
van der Salm, H.; Larsen, C. B.; McLay, J. R.; Fraser, M. G.; Lucas, N. T.; Gordon, K. C.
Dalton Trans
2014,
43
, 17775-85.
8.
Cao, Q.; Creely, C. M.; Davies, E. S.; Dyer, J.; Easun, T. L.; Grills, D. C.; McGovern, D. A.;
McMaster, J.; Pitchford, J.; Smith, J. A.; Sun, X.-Z.; Kelly, J. M.; George, M. W.
Photochem.
Photobiol. Sci.
2011,
10
, 1355-1364.
9.
Kuimova, M. K.; Alsindi, W. Z.; Blake, A. J.; Davies, E. S.; Lampus, D. J.; Matousek, P.;
McMaster, J.; Parker, A. W.; Towrie, M.; Sun, X.-Z.; Wilson, C.; George, M. W.
Inorg. Chem.
2008,
47
, 9857-9869.
10.
Walsh, P. J.; Gordon, K. C.; Lundin, N. J.; Blackman, A. G.
J. Phys. Chem. A
2005,
109
,
5933-5942.
11.
Brennaman, M. K.; Alstrum-Acevedo, J. H.; Fleming, C. N.; Jang, P.; Meyer, T. J.; Papanikolas,
J. M.
J. Am. Chem. Soc.
2002,
124
, 15094-15098.
12.
Olson, E. J. C.; Hu, D.; Hörmann, A.; Jonkman, A. M.; Arkin, M. R.; Stemp, E. D. A.; Barton, J.
K.; Barbara, P. F.
J. Am. Chem. Soc.
1997,
119
, 11458-11467.
13.
Ma, D.-L.; Che, C.-M.; Yan, S.-C.
J. Am. Chem. Soc.
2009,
131
, 1835-1846.
14.
Brennaman, M. K.; Meyer, T. J.; Papanikolas, J. M.
J. Phys. Chem. A
2004,
108
, 9938-9944.
15.
Song, H.; Kaiser, J. T.; Barton, J. K.
Nat Chem
2012,
4
, 615-620.
16.
van der Salm, H.; Elliott, A. B. S.; Gordon, K. C.
Coord. Chem. Rev.
2015,
282–283
, 33-49.
17.
Jia, C.; Liu, S. X.; Tanner, C.; Leiggener, C.; Neels, A.; Sanguinet, L.; Levillain, E.; Leutwyler,
S.; Hauser, A.; Decurtins, S.
Chem. Eur. J.
2007,
13
, 3804-12.
18.
Goze, C.; Leiggener, C.; Liu, S. X.; Sanguinet, L.; Levillain, E.; Hauser, A.; Decurtins, S.
ChemPhysChem
2007,
8
, 1504-12.
19.
Dupont, N.; Ran, Y. F.; Jia, H. P.; Grilj, J.; Ding, J.; Liu, S. X.; Decurtins, S.; Hauser, A.
Inorg.
Chem.
2011,
50
, 3295-303.
20.
Dupont, N.; Ran, Y. F.; Liu, S. X.; Grilj, J.; Vauthey, E.; Decurtins, S.; Hauser, A.
Inorg. Chem.
2013,
52
, 306-12.
9
22.
Cao, K.; Lu, J.; Cui, J.; Shen, Y.; Chen, W.; Alemu, G.; Wang, Z.; Yuan, H.; Xu, J.; Wang, M.;
Cheng, Y.
Journal of Materials Chemistry A
2014,
2
, 4945-4953.
23.
Horvath, R.; Huff, G. S.; Gordon, K. C.; George, M. W.
Coord. Chem. Rev.
2016,
325
, 41-58.
24.
Larsen, C. B.; van der Salm, H.; Clark, C. A.; Elliott, A. B. S.; Fraser, M. G.; Horvath, R.;
Lucas, N. T.; Sun, X.-Z.; George, M. W.; Gordon, K. C.
Inorg. Chem.
2014,
53
, 1339-1354.
25.
Larsen, C. B.; van der Salm, H.; Shillito, G. E.; Lucas, N. T.; Gordon, K. C.
Inorg. Chem.
2016
.
26.
Shillito, G. E.; Larsen, C. B.; McLay, J. R. W.; Lucas, N. T.; Gordon, K. C.
Inorg. Chem.
2016,
55
, 11170-11184.
27.
Hirakawa, A. Y.; Tsuboi, M.
Science
1975,
188
, 359-361.
28.
Clark, R. J. H.; Dines, T. J.
Angew. Chem. Int. Ed.
1986,
25
, 131-158.
29.
van der Salm, H.; Larsen, C. B.; McLay, J. R. W.; Huff, G. S.; Gordon, K. C.
Inorg. Chim. Acta
2015,
428
, 1-7.
30.
Dyer, J.; Blau, W. J.; Coates, C. G.; Creely, C. M.; Gavey, J. D.; George, M. W.; Grills, D. C.;
Hudson, S.; Kelly, J. M.; Matousek, P.; McGarvey, J. J.; McMaster, J.; Parker, A. W.; Towrie, M.;
Weinstein, J. A.
Photochem. Photobiol. Sci.
2003,
2
, 542.
31.
Blanco-Rodríguez, A. M.; Kvapilová, H.; S
ý
kora, J.; Towrie, M.; Nervi, C.; Volpi, G.; Záli
š
, S.;
Vl
č
ek, A.
J. Am. Chem. Soc.
2014,
136
, 5963-5973.
32.
Kuimova, M. K.; Alsindi, W. Z.; Dyer, J.; Grills, D. C.; Jina, O. S.; Matousek, P.; Parker, A. W.;
Portius, P.; Zhong Sun, X.; Towrie, M.; Wilson, C.; Yang, J.; George, M. W.
Dalton transactions
2003,
3996-4006.
10
The alteration of intra-ligand donor-acceptor interactions through torsional connectivity in
sub-stituted Re-dppz complexes
Supporting Information
Bethany Adams
2, Georgina E. Shillito
1, Holly van der Salm
1, Raphael Horvath
2, Christopher B.
Larsen
1, Nigel T. Lucas
*1, Michael W. George
*2, Keith C. Gordon
*1.
1Department of Chemistry, University of Otago, P.O. Box 56, Dunedin, New Zealand. Email: [email protected]
2School of Chemistry, University of Nottingham, University Park, Nottingham, NG7 2RD, U.K. Email:
SI Figure 8. Resonance Raman spectra of [ReCl(CO)3(dppz-NPh2)] (left) and [ReCl(CO)3(dppz-(TPA)2)] (right), in
11
PHYSICAL MEASUREMENTS
Spectroscopic grade solvents (Sigma-Aldrich) were used for all spectroscopic measurements.
Raman
Spectra were processed using GRAMS AI v8.00 (Thermo Scientific) and OriginPro v8.0
(Origin-Lab Corporation) software. Electronic absorption spectra were recorded in dichloromethane at
room temperature, with concentration typically 1×10
−4M, on a Perkin Elmer Lambda950
Instru-ment. Raman spectroscopy FT-Raman spectra were recorded on powder samples at room
tem-perature using a Bruker Equinox-55 interferometer with a FRA 106/5 Raman accessory. A
Nd:YAG excitation source was used with 1064 nm excitation wavelength. Raman photons were
detected with a D418T liquid nitrogen cooled Ge diode detector. Spectra were measured with
typically 64 scans and 80 mW power, with spectral resolution of 4 cm
-1using the Bruker OPUS
v5.5 software package. Resonance Raman spectra were recorded using a previously described
setup
1-4on CH2Cl2 solutions with concentrations typically 1 - 5 mM. Excitation wavelengths
350.7, 356.4, 406.7 and 413.1 nm were provided by a krypton ion laser (Innova I-302, Coherent
Inc.), 457.9 nm was provided by an argon ion laser (Innova Sabre, Coherent Inc.) and 444.0 nm
by a solid state diode laser (CrystaLaser).
Transient absorption and emission
Transient absorption and emission spectra were recorded on CH2Cl2 solutions with
concentra-tions typically 1×10
−5M, which were degassed under argon for 10 minutes prior to measurement.
Transients were acquired using a LP920K TA system (Edinburgh Instruments), with excitation
at 355 nm from pulsed third-harmonic radiation from a Brilliant (Quantel) Nd:YAG laser at 1 Hz,
and a Xe900 450 W xenon arc lamp controlled by a xP920 pulser as the probe source in TA
mode. Photons were dispersed using a TMS300-A Czerny-Turner monochromator with 1800
grooves mm
-1grating, recorded on a R928 (Hamamatsu) photomultiplier and transcribed on a
TDS3012C (Tektronix) digital oscilloscope.
Computational methods
Calculations were performed using the Gaussian09 package.
5Geometry optimisations and
harmonic vibrational frequency calculations were obtained using density functional theory
(DFT), employing the CAM-B3LYP functional and a CH2Cl2 solvent field, using the polarisable
continuum model (PCM). The LANL2DZ effective core potential and associated basis set was
used for the rhenium atoms, while the 6-31G(d) basis set was used for all other atoms.
Time-dependent density functional theory (TD-DFT) calculations were also performed using these
parameters.
X-ray Crystallography
Single crystals of suitable for X-ray diffraction studies were obtained from diffusion of hexane
into a CHCl3 solution of dppz-(TPA)
2. A crystal was attached with Paratone N to a fiber loop
12
article. These data can be obtained free of charge from The Cambridge Crystallographic Data
Centre via www.ccdc.cam.ac.uk/data_request/cif.
Crystal data for dppz-(TPA)
2·2CHCl3: C56H38Cl6N6,
M
= 1007.62, orange needle, 0.43 × 0.05 ×
0.04 mm
3, triclinic,
a
= 11.6651(3) Å,
b
= 12.0175(3) Å,
c
= 18.5253(5) Å,
α
= 95.615(2)°,
β
=
[image:12.612.60.356.179.370.2]101.960(2)°,
γ
= 109.776(2)°, V = 2350.64(9) Å
3, space group
P
-1 (#2), Z = 2,
μ
(Cu-
K
α) = 3.704 mm–1,
2θmax = 153.62°, 23927 reflections measured, 9760 independent reflections (Rint = 0.0338). The
fi-nal R1(
F
) = 0.0441 (I > 2
σ
(I)); 0.0509 (all data). The final wR2(
F
2) = 0.1182 (I > 2
σ
(I)); 0.1250 (all
data). GoF = 1.046.
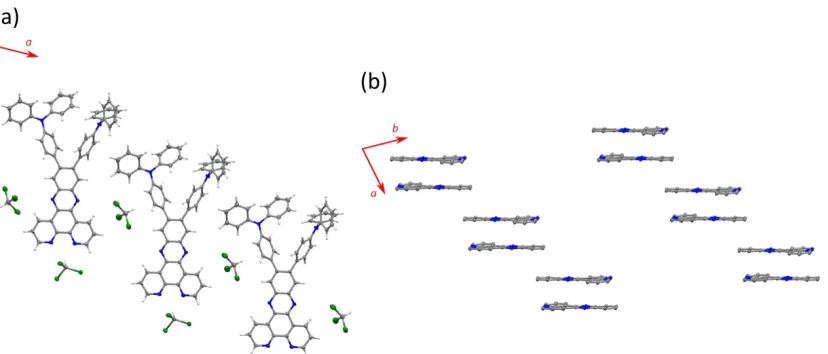
Figure S2. X-ray crystal structure of dppz-(TPA)
2. Ellipsoids are shown at 50% probability level.
Figure S3. Crystal packing of dppz-(TPA)
2, showing (a) edge-to-edge head-to-head packing
ar-rangement, and (b) face-to-face head-to-tail dimers. The TPA units are omitted for clarity.
Dppz-(TPA)
2crystallised in the P-1 space group, co-crystallising with two molecules of CHCl3
per molecule of dppz-(TPA)
2(Figure S2). The dppz skeleton is virtually planar, with a maximum
[image:12.612.63.477.424.601.2]13
bridging phenylenes. One molecule of CHCl3 hydrogen-bonds with the phen-type nitrogens
(2.29 Å from N1 and 2.28 Å from N2), whilst the proton of the second CHCl3 interacts with the
π
-system of a bridging phenylene (3.14 Å from the centre of the ring defined by C37, C38, C39, C40,
C41 and C42).
Crystal packing of dppz-(TPA)
2is presented in Figure S3. Two packing arrangements can be
ob-served: (a) an edge-to-edge head-to-head packing arrangement interspersed with CHCl3
clath-rate, and (b) face-to-face head-to-tail dimers that exist in a “step” arrangement (3.37 Å between
dppz planes in the dimers, and 3.94 Å between steps).
Scheme S1. Synthesis of the dppz ligands and ReCl(CO)3 complexes. Reagents and conditions:
(i) Diphenylamine,
tBuOK, Pd2(dba)3, [
tBu3PH]BF4, toluene, reflux, overnight; (ii) [ReCl(CO)5],
EtOH, reflux, overnight; (iii) 4-diphenylaminophenylboronic acid, K2CO3, PdCl2(dppf), toluene,
H2O, EtOH, reflux, overnight.
General conditions and materials. 11-Bromodipyrido[3,2-
a
:2',3'-
c
]phenazine
10,
11,12-dibromodipyrido[3,2-
a
:2
ʹ
,3
ʹ
-
c
]phenazine
11,
5-(4-diphenylamino-2,6-dimethoxyphenyl)benzo[
c
][1,2,5]thiadiazole
12and
11-(4-diphenylamino-2,6-dimethoxyphenyl)dipyrido[3,2-
a
:2
ʹ
,3
ʹ
-
c
]phenazine (dppz-(OMe)2TPA)
13were synthesised
accord-ing to literature procedures (or minor variations thereof). All other chemicals were
commercial-ly purchased and used as received unless otherwise stated. Dry solvents were obtained from a
Pure-Solv MD-6 Solvent Purification system; all other solvents were AR grade.
1H NMR (500
MHz) and
13C NMR (126 MHz) spectra were recorded on a Varian 500 AR spectrometer at 25 °C,
and are referenced to residual CHCl3 (7.26 ppm) and CDCl3 (77.16 ppm), respectively.
1H and
13C
(i) (ii)
N
N N
N Br N
N N
N N N
N N
N N
Re
OC OC
Cl
CO
N
N N
N Br
Br
(iii) N
N N
N
N
N
N
N N
N
Re
OC OC
Cl
CO
N
N (ii)
N O
O N
N N
N N
N N
N
Re
OC OC
Cl
CO
N O
O (ii)
dppz-NPh2
dppz-(TPA)2
14
NMR spectra were assigned using 2D spectroscopies (COSY, NOESY,
1H,
13C-HSQC and
1H,
13C-HMBC). ESI mass spectra were recorded on a Bruker MicrOTOF-Q mass spectrometer.
Microa-nalyses were performed at the Campbell Microanalytical Laboratory, University of Otago,
Dune-din, New Zealand.
11-Diphenylaminodipyrido[3,2-
a
:2
′
,3
′
-
c
]phenazine (dppz-NPh2)
A mixture of 11-bromodipyrido[3,2-
a
:2',3'-
c
]phenazine (0.212 g, 0.59
mmol), diphenylamine (0.211 g, 1.25 mmol) and
tBuOK (0.346 g, 3.08
mmol) in toluene (20 mL) was bubbled with argon for 15 min.
[
tBu3PH]BF4 (0.022 g, 0.076 mmol) and Pd2(dba)3 (0.031 g, 0.034 mmol)
were added and the reaction mixture heated at reflux overnight under an
argon atmosphere. The reaction mixture was allowed to cool to rt, the
product extracted into CHCl3, and washed with NH4Cl solution (sat.), then water. The organic
extract was dried over MgSO4, and the solvent removed under reduced pressure. The residue
was purified using preparative column chromatography (basic Al2O3, CH2Cl2) to afford
dppz-NPh2 (0.027 g, 10%) as an orange solid. The
1H NMR and ESI-MS data were consistent with those
previously reported.
31
H NMR (500 MHz, CDCl3): δ 9.54 (dd,
J
= 8.1, 1.8 Hz, 1H, H1/8), 9.48 (dd,
J
= 8.1, 1.8 Hz, 1H, H1/8),
9.21 (m, 2H, H3,6), 8.09 (dd,
J
= 9.3, 0.4 Hz, 1H, H13), 7.74 (dd,
J
= 8.1, 4.4, 1H, H2/7), 7.70 (dd,
J
=
8.1, 4.5, 1H, H2/7), 7.68 (dd,
J
= 9.2, 2.6 Hz, 1H, H12), 7.64 (dd,
J
= 2.6, 0.4 Hz, 1H, H10), 7.40 (dd,
J
=
8.5, 7.5 Hz, 4H, H3
′), 7.29 (dd,
J
= 8.5, 1.1 Hz, 4H, H2
′), 7.22 (tt,
J
= 7.4, 1.2 Hz, 2H, H4
′) ppm. HRMS
(ESI) calcd for C30H19N5Na ([M+Na]
+): m/z 472.153. Found: m/z 472.152.
fac
-Chlorotricarbonyl(11-diphenylaminodipyrido-[3,2-
a
:2
′
,3
′
-
c
]phenazine)rhenium(I)
([ReCl(CO)3(dppz-NPh2)])
A mixture of dppz-NPh2 (0.101g, 0.225 mmol) and [ReCl(CO)5] (0.081 g,
0.225 mmol) in EtOH (100 mL) was heated at reflux overnight. The
re-action was allowed to cool to rt, and the resultant precipitate filtered
and washed with EtOH to afford [ReCl(CO)3(dppz-NPh2)] (0.154 g,
91%) as a purple solid.
15
([M+Na]
+): m/z 778.062. Found: 778.066. Elemental analysis calcd for C33H19ClN5O3Re·0.5H2O:
C, 51.86; H, 2.64; N, 9.16. Found: C, 51.93; H, 2.60; N, 9.02.
11,12-Di(4-diphenylaminophenyl)dipyrido[3,2-
a
:2
ʹ
,3
ʹ
-
c
]phenazine (dppz-(TPA)2)
A mixture of 11,12-dibromodipyrido[3,2-
a
:2
ʹ
,3
ʹ
-
c
]phenazine (0.417 g,
0.947 mmol), 4-diphenylaminophenylboronic acid (1.17 g, 4.04 mmol)
and K2CO3 (1.30 g, 9.41 mmol) in toluene (20 mL), H2O (10 mL) and
EtOH (5 mL) was bubbled with argon for 15 min. PdCl2(dppf) (0.160 g,
0.195 mmol) was added and the reaction mixture heated at reflux
over-night under an argon atmosphere. The reaction mixture was allowed to
cool, and the product extracted into CHCl3, and washed with NH4Cl
so-lution (sat.), then water. The organic extract was dried over MgSO4, and
the solvent removed under reduced pressure. The residue was purified using preparative column
chromatography (basic Al2O3, 5% MeOH in CHCl3) to afford dppz-(TPA)2 (0.568 g, 78%) as an
orange solid.
1
![Figure 1. Structure of dipyrido[3,2-a:2′,3′-c]Phenazine (dppz).](https://thumb-us.123doks.com/thumbv2/123dok_us/8564369.366617/1.612.58.178.634.731/figure-structure-of-dipyrido-a-c-phenazine-dppz.webp)
![Figure 2. Complexes investigated in this study; a) [ReCl(CO)3(dppz-(OMe)2TPA)], b) [ReCl(CO)3(dppz-(TPA)2)], c) [ReCl(CO)3(dppz-NPh2)], d) [ReCl(CO)3(dppz-TPA)]](https://thumb-us.123doks.com/thumbv2/123dok_us/8564369.366617/2.612.318.545.42.311/figure-complexes-investigated-study-recl-recl-recl-recl.webp)
![Figure 7. TRIR spectra of [Re(CO)3Cl(dppzNPh2)] acquired in CH2Cl2 in in the ν(CO) stretching region (a) and in the fingerprint region (b)](https://thumb-us.123doks.com/thumbv2/123dok_us/8564369.366617/5.612.321.567.33.527/figure-spectra-dppznph-acquired-stretching-region-fingerprint-region.webp)