Comparative study of 13 candidate genes
applying multi-reference normalization to
detect the expression of different fineness in
skin tissues of wool sheep
Y.Z. Tian1,2*, T. Usman3*, K.C. Tian2, J. Di2, X.X. Huang1, X.M. Xu2, H. Tulafu2, W.W. Wu2, X.F. Fu2, Y. Bai1, M. Tuerxun1 and A. Maimaiti1
1College of Animal Science, Xinjiang Agricultural University, Urumqi, China 2Xinjiang Academy of Animal Science, Urumqi, China
3College of Veterinary Sciences and Animal Husbandry, Abdul Wali Khan University Mardan, Pakistan
*These authors contributed equally to this study. Corresponding authors: X.X. Huang / K.C. Tian
E-mail: [email protected] / [email protected] Genet. Mol. Res. 16 (1): gmr16018905
Received June 21, 2016 Accepted October 14, 2016 Published February 16, 2017
DOI http://dx.doi.org/10.4238/gmr16018905
Copyright © 2017 The Authors. This is an open-access article distributed under the terms of the Creative Commons Attribution ShareAlike (CC BY-SA) 4.0 License.
fine-type wool sheep; the corresponding expression ratios of super-fine to super-fine wool sheep were 1.45, 1.57, and 2.55, respectively. The expression levels of PIK3CA, ADAM9, and FZD3 genes were lower in super-fine wool sheep compared with fine-type wool sheep; the corresponding expression ratios were 0.61, 0.65, and 0.52, respectively. The other genes tested (RPS6KA, ABCG2, GSTA1, PTPN13, GJB3, PPARD, and LAMB1) were similarly expressed in both types of wool sheep. These results infer that lower expression of PIK3CA, ADAM9, and FZD3 genes was associated with lower fiber diameter, whereas lower expression of TXNIP, TFDP1, and FAIM genes was associated with higher fiber diameter.
Key words: Candidate genes; Gene expression; Fiber diameter; Multi-reference; Wool sheep
INTRODUCTION
In fine-wool sheep breeding, wool fiber diameter is considered a trait of primary interest because it determines the economic value of wool. Thus, it is important to elucidate the underlying mechanisms that determine fiber characteristics (Wang et al., 2014). Wool growth is a relatively complex process, which involves the aggregation and expression of keratin, which is both space and time dependent (Bawden et al., 1998). Numerous studies have focused on the biological characteristics of wool and the quantitative trait loci (QTL) associated with wool economic traits (Cockett et al., 2001; Fang et al., 2010; Liu et al., 2014). According to the latest data, reported in 2014, 34 QTLs for wool traits have been discovered (http://www.animalgenome.org/cgi-bin/QTLdb/OA/summary), which refer to fibers and both sides of fleece. Pathway genes, as well as the keratin family genes, appear to be regulated at the transcription level.
Di et al. (2013) have screened differentially expressed genes in skin tissue of fine-wool sheep with different fiber diameter using the Affymetrix GeneChip bovine genome array, and Agilent sheep oligo microarray. In total, 267 genes were revealed to be differentially expressed in these two microarrays, including 106 upregulated and 161 downregulated genes. From these data, 13 candidate genes were selected to detect the expression of different levels of fineness in skin tissues of wool sheep by applying the real-time fluorescence quantitative PCR (RT-PCR)-SYBR Green I method based on multi-reference genes (Tian et al., 2013). Other studies have shown there is no association between the diameter of the embryonic hair follicle precursor and wool fiber diameter (Reddy et al., 2004; Wang et al., 2014). It is, therefore, possible that fiber diameter is determined by specific genes that are expressed when the follicle is formed and during its growth.
MATERIAL AND METHODS
Samples
All experimental procedures were performed by trained technicians according to the animal care guidelines of the People’s Republic of China and were approved and supervised by the relevant authorities of the ethics committee of the Xinjiang Agricultural University, Urumqi, China. Seventeen-skin tissue samples (2 cm2) were obtained under local anesthesia from the shoulders of 1-year-old wool sheep (8 super-fine and 9 fine type). Mean fiber diameter from super-fine type sheep was 15.79 ± 0.367 µm (range: 15.63 to 16.40 mm), whereas in fine-type sheep mean fiber diameter was 20.55 ± 1.185 µm (range: 19.46 to 23.09 mm).
All animals used were obtained from the original breeding stock of Chinese Merino sheep (Xinjiang type) located in Xinyuan County, Yili Province, P.R. China. All animals were fed under similar conditions in a Xinjiang Gong-naisi breeding sheep field, which was located at 43°01'-43°40'N, 82°28'-84°57'E, 792-4261 m in altitude (sunshine duration 4442 h year-1). Tissue samples were frozen in liquid nitrogen for RNA extraction and for later use.
Primer design
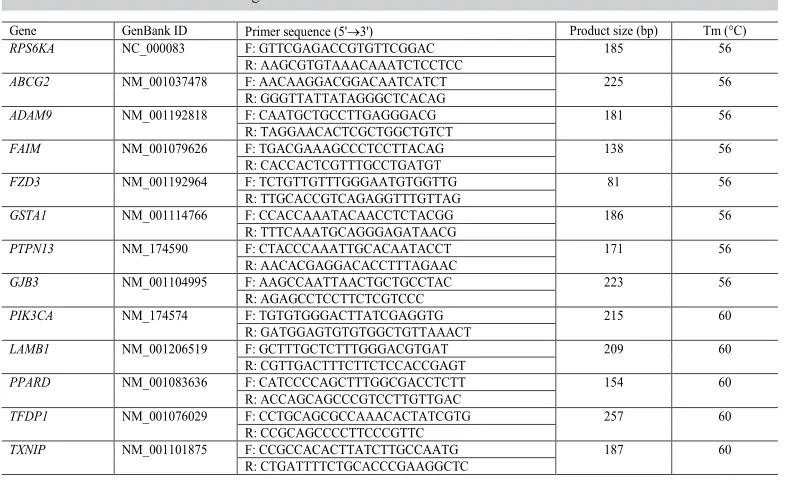
Reference gene primer pairs used for the amplification of 18SrRNA, β-actin, and GAPDH have been previously described (Tian et al., 2013). Primers of candidate genes were used to amplify the sequences, whose GenBank accession numbers, product size, and annealing temperatures are shown in Table 1.
F, forward primer; R, reverse primer.
Table 1. Reference and candidate genes used for real-time PCR.
Gene GenBank ID Primer sequence (5'3') Product size (bp) Tm (°C)
RPS6KA NC_000083 F: GTTCGAGACCGTGTTCGGAC 185 56
R: AAGCGTGTAAACAAATCTCCTCC
ABCG2 NM_001037478 F: AACAAGGACGGACAATCATCT 225 56
R: GGGTTATTATAGGGCTCACAG
ADAM9 NM_001192818 F: CAATGCTGCCTTGAGGGACG 181 56
R: TAGGAACACTCGCTGGCTGTCT
FAIM NM_001079626 F: TGACGAAAGCCCTCCTTACAG 138 56
R: CACCACTCGTTTGCCTGATGT
FZD3 NM_001192964 F: TCTGTTGTTTGGGAATGTGGTTG 81 56
R: TTGCACCGTCAGAGGTTTGTTAG
GSTA1 NM_001114766 F: CCACCAAATACAACCTCTACGG 186 56
R: TTTCAAATGCAGGGAGATAACG
PTPN13 NM_174590 F: CTACCCAAATTGCACAATACCT 171 56
R: AACACGAGGACACCTTTAGAAC
GJB3 NM_001104995 F: AAGCCAATTAACTGCTGCCTAC 223 56
R: AGAGCCTCCTTCTCGTCCC
PIK3CA NM_174574 F: TGTGTGGGACTTATCGAGGTG 215 60
R: GATGGAGTGTGTGGCTGTTAAACT
LAMB1 NM_001206519 F: GCTTTGCTCTTTGGGACGTGAT 209 60
R: CGTTGACTTTCTTCTCCACCGAGT
PPARD NM_001083636 F: CATCCCCAGCTTTGGCGACCTCTT 154 60
R: ACCAGCAGCCCGTCCTTGTTGAC
TFDP1 NM_001076029 F: CCTGCAGCGCCAAACACTATCGTG 257 60
R: CCGCAGCCCCTTCCCGTTC
TXNIP NM_001101875 F: CCGCCACACTTATCTTGCCAATG 187 60
The conserved sequences of cattle genes in GenBank were used to design primers with Primer 5.0 software. The primers were synthesized by Shanghai Sangon Biological Engineering Technology & Service Co., Ltd (Shanghai, China).
Total RNA extraction and quality control
Total RNA Kit, HiScript Reverse Transcriptase, SYBR Green I, DL2000, and Marker I were supplied by Tiangen Co., Ltd. Total RNA was extracted from sheep skin tissues following the manufacturer’s instructions of the commercially available RNApure Tissue Kit (Tiangen, catalog no. DP431). Isolated total RNA was dissolved in 30 mL RNase-free ddH2O and stored at -80°C until further use. The quantity and quality of total RNA was analyzed with a spectrophotometer (SmartSpecTM plus; America, BIO-RAD) by measuring absorbance at 260 and 280 nm. The optical density (OD) of the OD260/OD280 ratio of all the total RNA samples ranged from 1.8 to 2.0, indicating high purity without protein contamination. RNA integrity was assessed by agarose gel electrophoresis in a subset of random samples. The quality of the isolated RNA was high, as indicated by the OD ratio of 28S to 18S, which was consistently greater than 1 for each sample checked.
Two step RT-PCR
Total RNA was converted to cDNA using Quant reverse transcriptase in a reaction volume of 20 µL containing 2 µL 10X RT mixture, 2 µL dNTP mixture (0.25 mM each), 2 µL oligo-dT 15, 1 µL Quant reverse transcriptase, and 1 ng DNA-free RNA. RT-PCR was performed in a total reaction volume of 20 µL, including 9 µL of SYBR Green I real master mix from the RT-PCR kit Tiangen (catalog no. FP202), 3 µL (10 ng) cDNA working solution, and 1 µM of each forward and reverse primer. The reaction was performed in a Cycler Light 2.0 System (Roche) under the following conditions: 1 cycle of 95°C for 2 min, 45 cycles of 95°C for 20 s, 60°C for 20 s, and 68°C for 30 s. Each reaction was performed in triplicate with non-templates as negative controls.
Data acquisition and statistical analysis
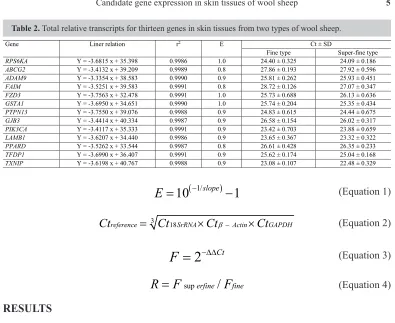
Relative expression levels for each candidate gene were calculated for super-fine type and fine-type wool sheep groups. The crossing point of the amplification curve with the threshold represents the cycle threshold (Ct), which is shown in Table 2. Data were exported to Microsoft Excel for further analysis. Different amplification efficiencies for the individual genes were taken into account.
Roche Light Cycler 2.0 fluorescent quantitative PCR system program was used to calculate amplification efficiency with (Equation 1). Standard and melting curves were then drawn. The expression of candidate genes was normalized by three reference genes (18SrRNA, β-Actin, and GAPDH) using Equation 2 and calculated by the relative quantification method with Equation 3.
Table 2. Total relative transcripts for thirteen genes in skin tissues from two types of wool sheep.
Gene Liner relation r2 E Ct ± SD
Fine type Super-fine type
RPS6KA Y = -3.6815 x + 35.398 0.9986 1.0 24.40 ± 0.325 24.09 ± 0.186
ABCG2 Y = -3.4132 x + 39.209 0.9989 0.8 27.86 ± 0.193 27.92 ± 0.596
ADAM9 Y = -3.3354 x + 38.583 0.9990 0.9 25.81 ± 0.262 25.93 ± 0.451
FAIM Y = -3.5251 x + 39.583 0.9991 0.8 28.72 ± 0.126 27.07 ± 0.347
FZD3 Y = -3.7563 x + 32.478 0.9991 1.0 25.73 ± 0.688 26.13 ± 0.636
GSTA1 Y = -3.6950 x + 34.651 0.9990 1.0 25.74 ± 0.204 25.35 ± 0.434
PTPN13 Y = -3.7550 x + 39.076 0.9988 0.9 24.83 ± 0.615 24.44 ± 0.675
GJB3 Y = -3.4414 x + 40.334 0.9987 0.9 26.58 ± 0.154 26.02 ± 0.317
PIK3CA Y = -3.4117 x + 35.333 0.9991 0.9 23.42 ± 0.703 23.88 ± 0.659
LAMB1 Y = -3.6207 x + 34.440 0.9986 0.9 23.65 ± 0.367 23.32 ± 0.322
PPARD Y = -3.5262 x + 33.544 0.9987 0.8 26.61 ± 0.428 26.35 ± 0.233
TFDP1 Y = -3.6990 x + 36.407 0.9991 0.9 25.62 ± 0.174 25.04 ± 0.168
TXNIP Y = -3.6198 x + 40.767 0.9988 0.9 23.08 ± 0.107 22.48 ± 0.329
RESULTS
Amplification efficiency
The slopes and amplification efficiencies of the standard curves in all RT-PCRs had efficiencies between 0.8 and 1.0 (Table 2). The linear correlation coefficient (r2) for the
selected candidate genes ranged from 0.998 to 0.999. The Ct of all of the candidate genes in the samples was covered by the range of the standard curves.
Candidate genes expression
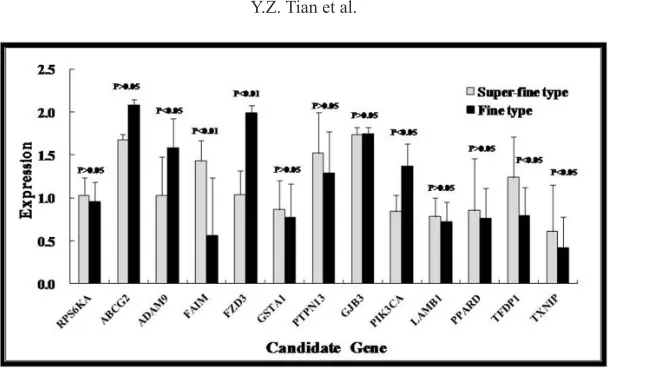
The Ct value of the standard curves revealed a good linear relationship with the concentrations of standard cDNA within a certain range. The 18SrRNA, β-Actin, and GAPDH were normalized as reference genes using the established RT-PCR protocol. In total, 13 expressed genes were identified in the super-fine type and fine-type groups of fine-wool sheep skin tissues. A set of three genes were upregulated, and three other genes were downregulated in the super-fine type sheep compared with the super-fine-type sheep. The expression ratios were 2.55 for FAIM, 1.57 for TFDP1, 1.45 for TXNIP, 0.65 for ADAM9, 0.61 for PIK3CA, and 0.52 for FZD3 (Figure 1). TXNIP, TFDP1, and FAIM genes exhibited significantly higher expression levels in the skin tissues of super-fine type wool sheep (P < 0.05) whereas, the expression of PIK3CA, ADAM9, and FZD3 genes was significantly lower in the fine-type wool sheep (P < 0.05). No significant differences between these two wool types were showed by the other seven candidate genes.
superfine
/
fineR F
=
F
(Equation 4)2
CtF
=
−DD (Equation 3)3 18
reference SrRNA Actin GAPDH
Ct
=
Ct
×
Ct
β−×
Ct
(Equation 2)( 1/ )
10
slope1
Figure 1. Expression of candidate genes in the skin of sheep with super-fine or fine wool. Expression levels of the candidate genes in super-fine type and fine-type mRNA were investigated by RT-PCR. All 13 selected genes were expressed at different levels in skin tissues of wool sheep. The expression levels (presented on the Y-axis) were calculated using 2-DDCt and are reported as means ± standard error (SE). Each bar represents one type group and each
pair of bars illustrates difference in the expression levels in the fine-type and super-fine type group samples for each candidate gene.
Correlation coefficient of differentially expressed genes
According to the known signaling pathway information, all the selected genes were from different pathways, expect for FZD3 and PPARD genes, which both played a role in the same WNT pathway. As shown in Table 3, the Pearson correlation coefficients ranged from -0.68 to 0.65 and the P values were statistically significant for some genes. These findings suggest a potential relationship between wool quality and certain genes, which is mediated via different pathways.
Below diagonal on the left represents the Pearson correlation coefficient (r); above diagonal on the right represents the corresponding significance value (P). **P < 0.01; *P < 0.05.
Table 3. The Pearson correlation coefficient (R) and the corresponding significance value (P) among these thirteen candidate genes.
Gene TXNIP PIK3CA PPARD LAMB1 RPS6KA TFDP1 ADAM9 FAIM FZD3 GSTA1 PTPN13 GJB3 ABCG2
TXNIP -0.13 0.65 0.62 0.26 0.61 -0.07 0.30 -0.24 -0.15 0.33 -0.03 -0.24
PIK3CA 0.62 - -0.02 0.05 -0.06 -0.22 0.16 -0.68 0.37 0.11 -0.20 -0.24 0.39
PPARD 0.01** 0.94 - 0.17 0.14 0.61 -0.19 0.00 0.19 -0.33 -0.11 -0.27 -0.35
LAMB1 0.01** 0.86 0.52 - 0.24 0.51 0.10 0.22 -0.04 -0.09 0.36 0.53 -0.07
RPS6KA 0.31 0.83 0.58 0.36 - 0.54 -0.17 0.15 -0.42 -0.06 0.48 0.10 -0.14
TFDP1 0.01** 0.41 0.01** 0.04* 0.03* - -0.07 0.32 -0.26 -0.14 0.39 0.20 -0.23
ADAM9 0.78 0.55 0.46 0.69 0.52 0.78 - -0.23 -0.28 0.36 -0.16 0.12 0.53
FAIM 0.25 0.00** 0.99 0.40 0.56 0.21 0.38 - -0.25 -0.28 0.24 0.17 -0.08
FZD3 0.35 0.14 0.46 0.88 0.09 0.30 0.28 0.33 - -0.43 -0.40 -0.04 -0.11
GSTA1 0.57 0.68 0.20 0.72 0.81 0.60 0.15 0.28 0.09 - -0.02 -0.29 0.45
PTPN13 0.19 0.45 0.66 0.15 0.05* 0.12 0.54 0.35 0.11 0.94 - 0.41 -0.20
GJB3 0.90 0.35 0.30 0.03* 0.71 0.45 0.64 0.50 0.88 0.26 0.11 - -0.07
DISCUSSION
Multiple internal normalization factors improve quantitative accuracy
A common practice of using a single reference gene for normalization is associated with possible errors (Vandesompele et al., 2002). The ratio of two control genes was calculated in two different samples collected from the same tissue panel and was termed the signal control normalization error (E). The average 75th and 90th percentiles for E values were estimated to be 3.0 and 6.4, respectively (Vandesompele et al., 2002). It was reported that there are 575 reference genes for human beings, but not all of them were expressed consistently in any given environment (Eisenberg and Levanon, 2013). Thus, applying a multi-reference approach to minimize deviation, by the use of accurate quantitative genes, enables subtle expression differences to be identified and this is of significant importance (Vorachek et al., 2013).
Using different algorithm results to determine reliability
Both arithmetic and geometric means are used to evaluate Ct values of the reference genes (Langnaese et al., 2008; Lakics et al., 2010). Hellemans et al. (2007) reported different results with these different parameters. Studies using geometric means were associated with smaller standard errors, possibly caused by the reduced numerical range and more concentrated distribution. Geometric means of Ct values of reference genes should therefore be used to reduce error when normalizing target gene expression levels.
Comparative analysis of quantitative and chip results
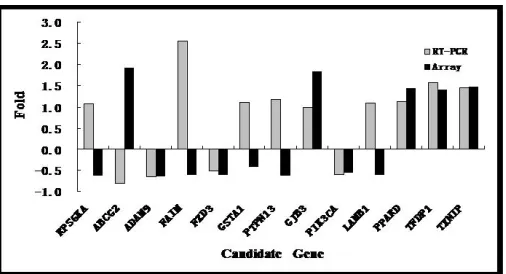
As shown in Figure 2, six candidate genes identified using RT-PCR showed similar expression levels to those in a previous study using a microarray for evaluation of the same candidate genes (Di et al., 2013). The inconsistency with other genes might be caused by the more accurate quantitation provided by RT-PCR as compared to that of microarrays because of the quite different and dynamic range of the two methods, and the issues with specificity of the primers designed to discriminate gene family members by DNA arrays (Chen et al., 2009).
The upregulated genes are mainly involved in cell nucleus factor NF-kB cascade control, transcription, lipid metabolism, and the transmembrane receptor protein tyrosine kinase signaling pathway (Radonić et al., 2004). The downregulated genes are mainly involved in protein biosynthesis, phosphorylation, hydrolysis, transport, regulation of cell differentiation and proliferation, Wnt receptor signaling pathways, hydrogen peroxide and oxidative emergency response, and the development of biological processes. The downregulated genes involved in biological processes reflect the decrease in wool fineness, its corresponding protein metabolism, and cell differentiation and proliferation. Finer wool has shorter fibers and is correspondingly less abundant (Di et al., 2013). Thus, fine-wool structure requires fewer components, and shows good consistency with the biological processes of downregulated genes.
Relationship between candidate genes and wool traits
In the present study, most of the differentially expressed genes were involved in biological processes that included too few additional genes to establish a complete genetic regulatory network or a detailed analysis of biological function. Although extensive molecular research has been conducted on hair biology, it is mainly focused on the origin of hair follicles, follicle development, and cyclic hair growth in humans and rats. Few studies have been conducted on the regulation of fiber diameter (Itenge et al., 2009). The differentially expressed genes in the present study are involved in several biological pathways relevant to the development of hair follicles and hair growth (WNT, adhesion effect) (Zhang et al., 1997; Yu et al., 2009). Previous studies have shown that lower gene enrichment in protein synthesis and altered biological functions, such as cell proliferation and apoptosis, result in reduced fiber diameter and the corresponding length of wool, and ultimately decrease wool production.
In the present study, the Pearson’s correlation coefficients among the upregulated genes (PPARD, TFDP1, and TXNIP) were equal or greater than 0.6 with an associated P < 0.01. The upregulated genes were expressed significantly higher in the super-fine type group than the fine-type group (P < 0.01), indicating that their expression might restrain the growth regulation of wool fineness.
FZD3 is one of the Wnt receptor proteins. Research has shown that Wnt5a combined with FZD3 triggered phosphatidyl inositol kinase (PI3K) mediated by protein kinase Akt phosphorylation, which promotes its downstream functions (Hung et al., 2001; Yu et al., 2009). PI3K is a member of the PI3K family and plays a crucial role in cell function, acting as an extracellular signal molecule. A study on mice reported that PIK3CA had a regulating effect on cell proliferation during embryonic development (Halilovic et al., 2010). In the present study, FZD3 and PIK3CA (r = 0.37) were both downregulated in the super-fine wool group, indicating an association with wool fineness.
disease (Shintani et al., 2004). Interestingly, FZD3 and ADAM9 are involved in similar disease processes, although their correlation coefficient was only 0.28 in the present study.
Previous studies have indicated that keratin family genes are involved in wool traits in sheep (Cockett et al., 2001; Purvis and Franklin, 2005; Di et al., 2013; Wang et al., 2014). These genes are the most important components of wool fiber. Wool fiber diameter is the main trait of hair type in different biological processes. Both the number of follicle progenitor cells and hair follicle proliferation rate are thought to influence hair diameter (Itenge et al., 2009; Ling et al., 2014). In species whose hair has a medulla layer, their fiber diameter is influenced by cell proliferation, and cell size or shape (Itenge, 2012). This is mediated by affecting the medulla structure. However, wool fiber does have a medulla layer. Thus, enrichment of super-fine wool involves genes that are differentially expressed in protein metabolism, cell differentiation, and proliferation of biological functions involved in hair growth.
CONCLUSION
In summary, the present study detected changes of gene expression in super-fine wool type and fine-type sheep. The results indicated that regulation of gene expression occurs within the same signaling pathways, and that adjustment across different pathways may be mediated by the genes that connect the pathways. Further research in this area is needed to enhance the understanding of the exact mechanisms of gene action. In addition, the potential molecular markers identified in the present study should be further investigated at the cellular level to elucidate the mechanism behind the control of wool-fiber type and other characteristics. Although the present experiments were limited to transcripts and to a single time point, the RT-PCR analysis provided new insights into the factors that govern the expression of different wool fiber types. Understanding the influence of cell proliferation, and cell size and shape on fiber diameter will further enhance the search for wool improvement in fine-type wool sheep.
Conflicts of interest
The authors declare no conflict of interest.
ACKNOWLEDGMENTS
Research financially supported by the National Natural Science Foundation of P.R. China (Grant #31360543, #31460593), the National Modern Agriculture Industrial System Project (Grant #CARS-40), and the major projects of 12th Five-Year Autonomous Region (Grant #201230116-6).
REFERENCES
Bawden CS, Powell BC, Walker SK and Rogers GE (1998). Expression of a wool intermediate filament keratin transgene in sheep fibre alters structure. Transgenic Res. 7: 273-287. http://dx.doi.org/10.1023/A:1008830314386
Bi L, Okabe I, Bernard DJ, Wynshaw-Boris A, et al. (1999). Proliferative defect and embryonic lethality in mice homozygous for a deletion in the p110alpha subunit of phosphoinositide 3-kinase. J. Biol. Chem. 274: 10963-10968.
http://dx.doi.org/10.1074/jbc.274.16.10963
Chen H, Li C, Fang M, Zhu M, et al. (2009). Understanding Haemophilus parasuis infection in porcine spleen through a transcriptomics approach. BMC Genomics 10: 64 http://dx.doi.org/10.1186/1471-2164-10-64.
Cockett NE, Shay TL and Smit M (2001). Analysis of the sheep genome. Physiol. Genomics 7: 69-78. http://dx.doi. org/10.1152/physiolgenomics.00051.2001
Di J, Lazati A, Xu XM, Zhang YH, et al. (2013). Genome Array on differentially expressed genes of skin tissue in fine wool sheep with different fiber diameter. Acta Veterinaria et Zootechnica Sinica 44: 681-689.
Eisenberg E and Levanon EY (2013). Human housekeeping genes, revisited. Trends Genet. 29: 569-574. http://dx.doi. org/10.1016/j.tig.2013.05.010
Fang Y, Liu WJ, Zhang FQ, Shao YG, et al. (2010). The polymorphism of a novel mutation of KAP13.1 gene and its associations with cashmere traits on Xinjiang local goat breed in China. Asian J. Anim. Vet. Adv. 5: 34-42. http:// dx.doi.org/10.3923/ajava.2010.34.42
Halilovic E, She QB, Ye Q, Pagliarini R, et al. (2010). PIK3CA mutation uncouples tumor growth and cyclin D1 regulation from MEK/ERK and mutant KRAS signaling. Cancer Res. 70: 6804-6814. http://dx.doi.org/10.1158/0008-5472. CAN-10-0409
Hellemans J, Mortier G, De Paepe A, Speleman F, et al. (2007). qBase relative quantification framework and software for management and automated analysis of real-time quantitative PCR data. Genome Biol. 8: R19 http://dx.doi.
org/10.1186/gb-2007-8-2-r19.
Hung BS, Wang XQ, Cam GR and Rothnagel JA (2001). Characterization of mouse Frizzled-3 expression in hair follicle development and identification of the human homolog in keratinocytes. J. Invest. Dermatol. 116: 940-946. http:// dx.doi.org/10.1046/j.1523-1747.2001.01336.x
Itenge T (2012). Identification of polymorphism in the keratin genes (KAP3.2, KAP6.1, KAP7, KAP8) and microsatellite BfMS in Merino sheep using polymerase chain reaction-single strand conformational polymorphism (PCR-SSCP).
Electroanalysis 54: 953-978.
Itenge T, Hickford J, Forrest R, McKenzie G, et al. (2009). Improving the quality of wool through the use of gene markers.
S. Afr. J. Anim. Sci. 39: 219-223.
Lakics V, Karran EH and Boess FG (2010). Quantitative comparison of phosphodiesterase mRNA distribution in human brain and peripheral tissues. Neuropharmacology 59: 367-374. http://dx.doi.org/10.1016/j.neuropharm.2010.05.004
Langnaese K, John R, Schweizer H, Ebmeyer U, et al. (2008). Selection of reference genes for quantitative real-time PCR in a rat asphyxial cardiac arrest model. BMC Mol. Biol. 9: 53 http://dx.doi.org/10.1186/1471-2199-9-53.
Ling YH, Xiang H, Zhang G, Ding JP, et al. (2014). Identification of complete linkage disequilibrium in the DSG4 gene and its association with wool length and crimp in Chinese indigenous sheep. Genet. Mol. Res. 13: 5617-5625. http:// dx.doi.org/10.4238/2014.July.25.17
Liu YX, Shi GQ, Wang HX, Wan PC, et al. (2014). Polymorphisms of KAP6, KAP7, and KAP8 genes in four Chinese sheep breeds. Genet. Mol. Res. 13: 3438-3445. http://dx.doi.org/10.4238/2014.April.30.5
Purvis IW and Franklin IR (2005). Major genes and QTL influencing wool production and quality: a review. Genet. Sel. Evol. 37 (Suppl 1): S97-S107. http://dx.doi.org/10.1186/1297-9686-37-S1-S97
Radonić A, Thulke S, Mackay IM, Landt O, et al. (2004). Guideline to reference gene selection for quantitative real-time PCR. Biochem. Biophys. Res. Commun. 313: 856-862. http://dx.doi.org/10.1016/j.bbrc.2003.11.177
Reddy ST, Andl T, Lu MM, Morrisey EE, et al. (2004). Expression of Frizzled genes in developing and postnatal hair follicles. J. Invest. Dermatol. 123: 275-282. http://dx.doi.org/10.1111/j.0022-202X.2004.23215.x
Shintani Y, Higashiyama S, Ohta M, Hirabayashi H, et al. (2004). Overexpression of ADAM9 in non-small cell lung cancer correlates with brain metastasis. Cancer Res. 64: 4190-4196. http://dx.doi.org/10.1158/0008-5472.CAN-03-3235
Tian YZ, Di J, Huang XX, Tian KC, et al. (2013). Selection of housekeeping genes for real time fluorescence quantitative RT-PCR in skin of fine wool sheep. Asian J. Anim. Vet. Adv. 8: 473-482. http://dx.doi.org/10.3923/ajava.2013.473.482
Vandesompele J, De Preter K, Pattyn F, Poppe B, et al. (2002). Accurate normalization of real-time quantitative RT-PCR data by geometric averaging of multiple internal control genes. Genome Biol. 3: H0034. http://dx.doi.org/10.1186/ gb-2002-3-7-research0034
Vorachek WR, Hugejiletu, Bobe G and Hall JA (2013). Reference gene selection for quantitative PCR studies in sheep neutrophils. Int. J. Mol. Sci. 14: 11484-11495. http://dx.doi.org/10.3390/ijms140611484
Wang Y, Guo N and Nathans J (2006). The role of Frizzled3 and Frizzled6 in neural tube closure and in the planar polarity of inner-ear sensory hair cells. J. Neurosci. 26: 2147-2156. http://dx.doi.org/10.1523/JNEUROSCI.4698-05.2005
Wang Z, Zhang H, Yang H, Wang S, et al. (2014). Genome-wide association study for wool production traits in a Chinese Merino sheep population. PLoS One 9: e107101. http://dx.doi.org/10.1371/journal.pone.0107101
Yu Z, Gordon SW, Nixon AJ, Bawden CS, et al. (2009). Expression patterns of keratin intermediate filament and keratin associated protein genes in wool follicles. Differentiation 77: 307-316. http://dx.doi.org/10.1016/j.diff.2008.10.009