In Pursuit of Excellence in Science
6OL.O$ECEMBERs)33.
ASM
Science Journal
4(2) 2010
ReSeARch ARticleS
Application of Statistical experimental Designs for Optimization of
Medium composition in Biodegradation of Procion Red MX-8B 103
Khadijah O., K.K. Lee and M.F.F. Abdullah
Physicochemical Properties of Margarines enriched with
Medium- and long-chain triacylglycerol 113
N. Arifin, L.Z. Cheong, S.P. Koh, K. Long, C.P. Tan, M.S.A. Yusoff and O.M. Lai
expression of Receptor-interacting Protein (RiP 140) in
Zebrafish Tissues and Embryonic Stages 123
P.H. Teoh, M.K. Kuah, P.S. Lim, T.S.T. Muhammand, N. Najimudin and A.S.C. Chien
Ambient Noise Reduction Using improved least Mean Square Adaptive Filtering 133 A.O.A. Noor, S.A. Samad and A. Hussain
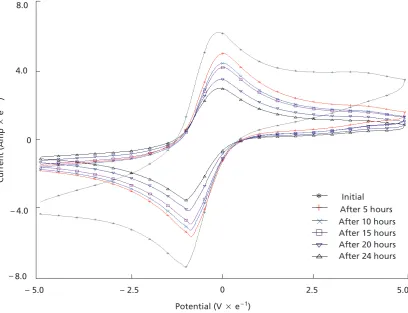
Preliminary characterization Study Based on cyclic Voltammetry and
Reliability of a Fabricated Au/Ti Microfluidic Three-electrode Sensor 142 I.H. Hamzah, A. Abd Manaf and O. Sidek
contents
ASM Sc. J. Volume 4(2), 2010
OS Continued on the inside of the back cover.
Price (2 Issues)
Malaysia: RM100 (Individual) RM200 (Institution) Other Countries: USD50 (Individual) USD100 (Institution)
INTERNATIONAL ADVISORY BOARD
Ahmed Zewail
Richard R. Ernst
John Sheppard Mackenzie
M.S. Swaminathan
EDITORIAL BOARD
Editor-in-Chief/Chairman: Md. Ikram Mohd Said
Abdul Latiff Mohamad
Chia Swee Ping
Ibrahim Komoo
Lam Sai Kit
Lee Chnoong Kheng
Looi Lai Meng
Mashkuri Yaacob
Mazlan Othman
Mohd Ali Hashim
Francis Ng
Radin Umar Radin Sohadi
Cover:
Researchers from the National University of Malaysia and the Masterskill University College of
Health Sciences Malaysia have discovered that during unilateral finger tapping, the contralateral
primary motor (M1) would act as the input center which in turn triggered the propagation of signals to supplementary motor area (SMA) in the same hemisphere and to M1 and SMA in the opposite hemisphere.
The two brain images were taken from Figure 2 (page 167) depicting statistical parametric maps obtained from random-effects analysis showing brain activation—in the article Intrinsic Couplings between the Primary Motor Area and Supplementary Motor Areas during Unilateral Finger Tapping Task (pages158–172).
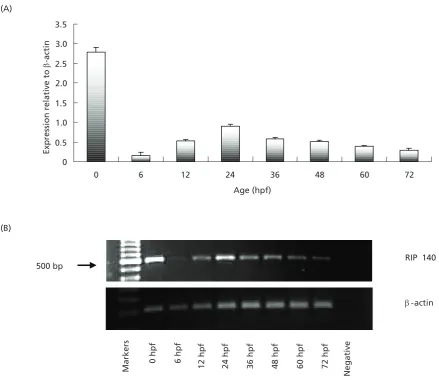
The lower image in the cover is the expression of receptor-interacting protein 140 in a developing
zebrafish embryo (72 hpf, lateral view)—Figure 7 (page 130) of article entitled Expression of Receptor-interacting Protein (RIP 140) in Zebrafish Tissues and Embryonic Stages (pages 123–132).
In Pursuit of Excellence in Science
6OL.O$ECEMBER s)33.
© Academy of Sciences Malaysia
All rights reserved. No part of this publication may be reproduced in any form or by any means without permission in writing from the Academy of Sciences Malaysia
The Editorial Board, in accepting contributions for publications, accepts no responsibility
for the views expressed by authors Published by the Academy of Sciences Malaysia
The Academy of Sciences
Malaysia (ASM)
The Academy of Sciences Malaysia (ASM) was established, under the Academy of Sciences Act 1994 which came into force on 1 February 1995, with the ultimate aim to pursue excellence in science. Thus the mission enshrined is to pursue, encourage and enhance excellence in the field of science, engineering and technology for the development of the nation and the benefit of mankind.
The functions of the Academy are as follows:
• To promote and foster the development of science, engineering and technology
• To provide a forum for the interchange of ideas among scientists, engineers and technologists • To promote national awareness, understanding and
appreciation of the role of science, engineering and technology in human progress
• To promote creativity among scientists, engineers and technologists
• To promote national self-reliance in the field of science, engineering and technology
• To act as a forum for maintaining awareness on the part of the Government of the significance of the role of science, engineering and technology in the development process of the nation and for bringing national development needs to the attention of the scientists, engineers and technologists
• To analyse particular national problems and identify where science, engineering and technology can contribute to their solution and accordingly to make recommendations to the Government • To keep in touch with developments in science,
engineering and technology and identify those developments which are relevant to national needs to bring such developments to the attention of the Government
• To prepare reports, papers or other documents relating to the national science, engineering and technology policy and make the necessary recommendations to the Government
• To initiate and sponsor multi-disciplinary studies related to and necessary for the better understanding of the social and economic implications of science, engineering and technology
• To encourage research and development and education and training of the appropriate scientific, engineering and technical man power
• To establish and maintain relations between the Academy and overseas bodies having the same or almost similar objectives in science, engineering and technology as the Academy
• To advise on matters related to science, engineering and technology as may be requested by the Government from time to time; and
• To carry out such other actions that are consistent with the 1994 Academy of Sciences Act as may be required in order to facilitate the advancement of science, engineering and technology in Malaysia, and the well being and status of the Academy.
The Academy is governed by a Council. Various Working Committees and Task Forces are charged with developing strategies, plans and programmes in line with the Academy’s objectives and functions.
The functions of the Council are:
• To formulate policy relating to the functions of the Academy
• To administer the affairs of the Academy
• To appoint such officers or servants of the Academy as are necessary for the due administration of the Academy
• To supervise and control its officers and servants • To administer the Fund; and
• To convene general meetings of the Academy to decide on matters which under this Act are required to be decided by the Academy.
The Academy has Fellows and Honorary Fellows. The Fellows comprise Foundation Fellows and Elected Fellows. The Academy Fellows are selected from the ranks of eminent Malaysian scientists, engineers and technocrats in the fields of medical sciences, engineering sciences, biological sciences, mathematical and physical sciences, chemical sciences, information technology and science and technology development and industry. The Future
Creativity and innovation are recognised the world over as the key measure of the competitiveness of a nation. Within the context of K-Economy and the framework of National Innovation System (NIS), ASM will continue to spearhead efforts that will take innovation and creativity to new heights in the fields of sciences, engineering and technology and work towards making Malaysia an intellectual force to be reckoned with.
OS
ReseaRch aRticles
application of statistical experimental Designs for Optimization of
Medium composition in Biodegradation of Procion Red MX-8B 103
Khadijah O., K.K. Lee and M.F.F. Abdullah
Physicochemical Properties of Margarines enriched with
Medium- and long-chain triacylglycerol 113
N. Arifin, L.Z. Cheong, S.P. Koh, K. Long, C.P. Tan, M.S.A. Yusoff and O.M. Lai
expression of Receptor-interacting Protein (RiP 140) in
Zebrafish Tissues and Embryonic Stages 123
P.H. Teoh, M.K. Kuah, P.S. Lim, T.S.T. Muhammand, N. Najimudin and A.S.C. Chien
ambient Noise Reduction Using improved least Mean square adaptive Filtering 133
A.O.A. Noor, S.A. Samad and A. Hussain
Preliminary characterization study Based on cyclic Voltammetry and
Reliability of a Fabricated Au/Ti Microfluidic Three-electrode Sensor 142
I.H. Hamzah, A. Abd Manaf and O. Sidek
Forced convection Boundary layer Flow over a Moving thin Needle 149
S. Ahmad, N.M. Arifin, R. Nazar and I. Pop
intrinsic couplings between the Primary Motor area and
supplementary Motor areas during Unilateral Finger tapping task 158
A.N. Yusoff, M. Mohamad, K.A. Hamid, A.I.A. Hamid, H.A. Manan and M.H. Hashim
contents
asM sc. J. Volume 4(2), 2010
ReView
Food Production from animals in asia: Priority
for expanding the Development Frontiers 173
C. Devendra
scieNce FORUM
Multivariate Regression in complex survey Design 185
G.M. Oyeyemi and A.A. Adewara
aNNOUNceMeNts
Mahathir Science Award 2011 (Invitation for Nomination) 191
ASM Publications 195
Colour elimination in wastewater is today the principal
problem concerning the textile industries. The inefficiency
in dyeing processes has resulted in 10%–15% of unused dyestuff entering the wastewater directly (Easton 1995). The major classes of synthetic dyes used include azo, anthraquinone and triarylmethane dyes. Azo dyes represent the largest group of all synthetic dyes and represent 70% of all organic dyes used by the textile industry (Zollinger 2003). On discharge to the environment, these azo dyes will eventually be reduced, in anoxic or anaerobic environments to aromatic amines. In the absence of oxygen to convert these products, they can cause toxic effects to the environment.
At present, the conventional biological wastewater
treatment to eliminate colour is inefficient due to the low
biodegradability of the dyes, while physical and chemical treatment processes are costly and have little adaptability to a wide range of dyes (Hao et al. 2000; Robinson et al. 2001). Micro-organisms have become a viable alternative to remediate the colour problem associated with reactive azo dyes due to their genetic diversity and metabolic versatility (Hao et al. 2000; Nigam et al. 1996a). Many studies on the decolorizing capability of micro-organisms especially fungi and bacteria have been reported and reviewed (Chang & Lin 2000; Kandelbauer & Guetbitz, 2005; Novotný et al. 2001).
Process improvements in the productivity of fermentation processes are generally ascribed to the development of
superior strains via mutation. However, other parameters such as the nutritional and physical environments to
which the organisms are exposed to also significantly alter
product yield. Classical medium optimization involves a single-dimensional search and does not examine the interactions between different parameters. More often, this method does not guarantee the determination of optimal conditions. Methods which utilize a full factorial search that would examine every possible combination of independent variables at appropriate levels can be used, but are laborious and time-consuming especially for a large number of variables. Alternatively, statistical methods based on fractional factorial searches are more practical approaches. Medium optimization using statistical designs was recently used for decolourisation studies (Annadurai et al. 2000; El-Sersy 2007).
In the present study, the improvement of processes focused on medium optimization and parameters which included the nutrients, pH and inoculum size. Two experimental designs were sequentially applied as tools for optimizing bacterial consortium decolourisation processes. The Plackett-Burman design was applied to screen the relative importance of various factors on the decolourisation of a mixture of azo dyes. In the following steps, the Box-Behnken design was applied for further
optimization of the most significant variables. The results
for batch study carried out on degradation of the reactive dye are presented.
Application of Statistical Experimental Designs
for Optimization of Medium Composition in
Biodegradation of Procion Red MX-8B
O. Khadijah1*, K.K. Lee1 and M.F.F. Abdullah1
Two sequential statistical experimental designs were used to screen and investigate the dependence of the amount of biodegradation of Procion Red MX-8B (PR-MX8B) on the fermentation variables. Fourteen factors
were screened using the Plackett-Burman design. Among these factors, the most significant variables which included yeast extract, corn steep solids and starch influencing PR-MX8B decolourisation were statistically
elucidated for optimization. The optimum concentrations of 5.00 g/l yeast extract, 2.99 g/l starch and 1.89 g/l corn steep solids were predicted by applying the Box-Behnken design to the second order polynomial model
fitted to the results obtained. The best predicted optimal conditions verified experimentally yielded 72.11%
while the predicted value from the polynomial model was 79.17%. The experimental values were in good agreement with the predicted values with a 90.81% degree of accuracy.
Key words: azo dyes; decolourisation; microbial consortium; medium optimization; Plackett-Burman design; Box-Behnken design; nutrient components
ASM Sci. J., 4(2), 103–112
1Faculty of Applied Sciences, Universiti Teknologi MARA, 40450 Shah Alam, Selangor, Malaysia
*Corresponding author (e-mail: [email protected])
103
ASM Science Journal, Volume 4(2), 2010
104
DESIGN OF EXPERIMENTS
Identification of Important Nutrient Components – The Plackett-Burman design
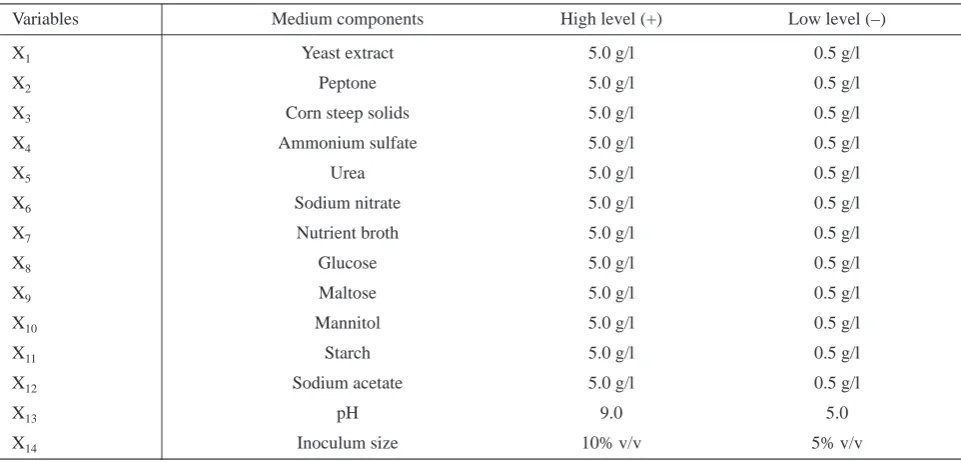
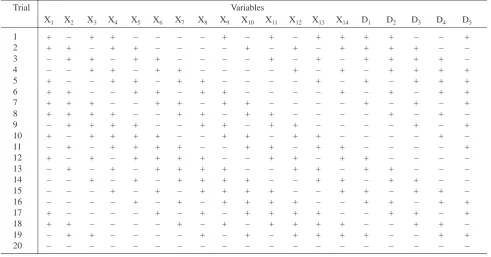
The Plackett-Burman experimental design (Plackett & Burman 1946) was used to screen and evaluate the relative importance of various nutrient and culture parameters for the decolourisation of Primazin Red MX-8B (PRMX-8B) by the bacterial consortium. This design, is a two-level fractional factorial design for studying k = N – 1 variables in N runs, where N is a multiple of four (Montgomery 1997). A total of 14 components (variables, k = 14) were selected for the study with each variable represented at two levels, (+) for high level and (–) for low level together with four dummy variables in 20 trials as shown in Tables 1 and 2, respectively.
The number of positive and negative signs per trial were (k + 1)/2 and (k–1)/2, respectively. Each column contained an equal number of positive signs. Each row represented a trial and each column represented an independent (assigned) or dummy (unassigned) variable. The effect of each variable was determined by the following Equation 1:
(1) where E(χi) is the concentration effect of the tested variables,
Mi+ and Mi– are the percentage of decolourisation from
the trials where the variable (χi) measured was present at low and high values, respectively; and N is the number of trials, 20.
Experimental error was estimated by calculating the variance among the dummy variables as in Equation 2 below:
(2) where Veff is the variance of the concentration effect, Ed is the concentration effect of the dummy variable and n is the number of dummy variables.
The standard error (S.E.) of the concentration effect was the square root of the variance of an effect and the
significance level (P-value) of each concentration effect
was determined using student’s t-test as in Equation 3:
(3) where E(χi) is the effect of variable.
This model does not describe interactions among variables and was used to screen and evaluate the important
variables that influenced the response. All experiments were
carried out in triplicate and the averages of the percentage dye decolourisation were taken as response. The variables
were screened at the confidence level of 99% based on their effect. If the variable displayed a significance level at or above 99% confidence level and its effect was positive,
it indicated that the variable was effective in decolorizing the dyes and a high level value (+) was required in the following optimization studies. However, if the effect was negative, a low level value (–) was required (Gohel et al. 2007).
i E
N M
Mi i
2
i
t
. .E S Ei
Y 0
k j i iX 1
ii Xi2
1 , 1 2 k j i j k j j i ijXX
Y= +
+ + + + = = = = + + + + + + + + 0
1X1 2X2 3X3 11X12 22X22 33X32 12X1X2 13X1X3 23X2X3
eff
V
d 2n E
i E
N M
Mi i
2
i
t
. .E S Ei
Y 0
k j i iX 1
ii Xi2
1 , 1 2 k j i j k j j i ijXX
Y= +
+ + + + = = = = + + + + + + + + 0
1X1 2X2 3X3 11X12 22X22 33X32 12X1X2 13X1X3 23X2X3
eff
V
d 2n E
i E
N M
Mi i
2
i
t
. .E S Ei
Y 0
k j i iX 1
ii Xi2
1 , 1 2 k j i j k j j i ijXX
Y= +
+ + + + = = = = + + + + + + + + 0
1X1 2X2 3X3 11X12 22X22 33X32 12X1X2 13X1X3 23X2X3
eff
V
d 2n E
Table 1. Variables showing medium components and conditions used in the Plackett-Burman design.
Variables Medium components High level (+) Low level (–)
X1 Yeast extract 5.0 g/l 0.5 g/l
X2 Peptone 5.0 g/l 0.5 g/l
X3 Corn steep solids 5.0 g/l 0.5 g/l
X4 Ammonium sulfate 5.0 g/l 0.5 g/l
X5 Urea 5.0 g/l 0.5 g/l
X6 Sodium nitrate 5.0 g/l 0.5 g/l
X7 Nutrient broth 5.0 g/l 0.5 g/l
X8 Glucose 5.0 g/l 0.5 g/l
X9 Maltose 5.0 g/l 0.5 g/l
X10 Mannitol 5.0 g/l 0.5 g/l
X11 Starch 5.0 g/l 0.5 g/l
X12 Sodium acetate 5.0 g/l 0.5 g/l
X13 pH 9.0 5.0
X14 Inoculum size 10% v/v 5% v/v
O. Khadijah et al.: Statistical Experimental Designs: Optimization of Medium Composition
105
Optimisation of Selected Components – The Box-Behnken Design
For optimisation of the media, response surface methodology (RSM) was used. RSM is a collection of mathematical and statistical techniques that is useful for the modelling and analysis of problems in which a response
of interest is influenced by a set of controlled experimental
variables. The objective of RSM is to optimise this response (Montgomery 1997). In general the optimisation design
experiments involve three major steps; firstly, performing
the statistically designed experiments, followed by
estimating the coefficients in the proposed mathematical model and finally predicting the response and checking
the adequacy of the model (Annadurai et al. 2000). The response surface is usually represented graphically and the shape of a response surface is often visualized in the form of contour plots. Each contour corresponds to a particular height of the response surface (Montgomery 1997).
For this study, a class of three-level complete factorial designs for the estimation of the parameters in a second order model developed by Box-Behnken was chosen. These designs are formed by combining 2k factorials with
incomplete block designs. The variables were selected at three levels: –1, 0, +1, and the response Y is given by a second order polynomial as in Equation 4:
(4)
where X1, X2, …. , X3 are the input variables which
influence the response Y ; β0βi(i = 1, 2, 3, …. , ) βiij (i = 1, 2, 3, …. , k ; j = 1, 2, 3, …. , k) are known parameters and
ε is a random error.
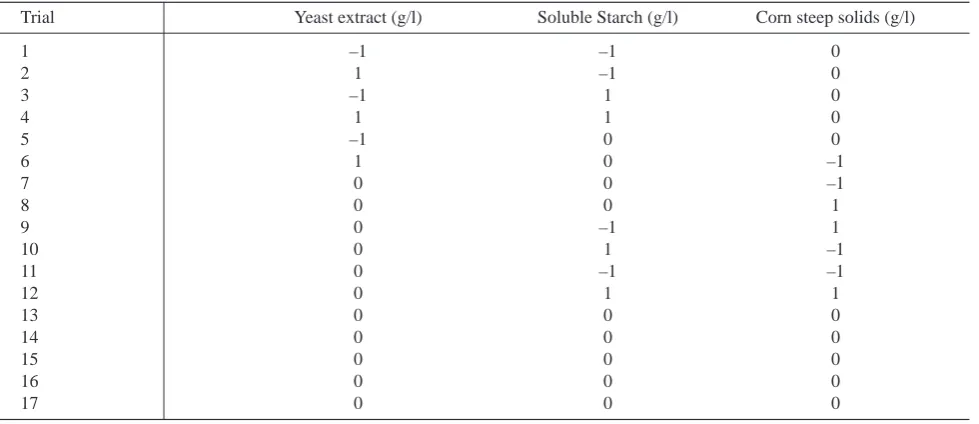
The effect of the concentration of yeast extract (g/l), soluble starch (g/l) and corn steep solids (g/l) on dye decolourisation were selected as the critical variables and designated as X1, X2, and X3, respectively. Other variables
with less significant or negative effects were omitted in the
optimisation experiments. This was decided after initial experiments with the addition of these variables at their minimum levels did not show any difference from the results obtained when the variables were not added. The low, middle and high level of each variable was designated as –1, 0, and +1 with values of 0.50 g/l, 2.75 g/l and 5.00 g/l respectively. The actual design of the experiments is tabulated in Table 3. Decolourisation was subjected to analysis of variance (ANOVA), appropriate to the design experiments.
The mathematical correlation between the decolourisa-tion of the dyes (Y) with the three variables was approximated by the quadratic model in Equation 5:
(5)
where Y = predicted response (% decolourisation), β0 = constant, X1 = yeast extract (g/l), X2 = soluble starch
Table 2. Plackett-Burman design matrix where X1, X2,....X14 are independent variables and D1, D2, D3, D4 and D5 are dummy
variables.
Trial Variables
X1 X2 X3 X4 X5 X6 X7 X8 X9 X10 X11 X12 X13 X14 D1 D2 D3 D4 D5
1 + – + + – – – – + – + – + + + + – – +
2 + + – + + – – – – + – + – + + + + – –
3 – + + – + + – – – – + – + – + + + + –
4 – – + + – + + – – – – + – + – + + + +
5 + – – + + – + + – – – – + – + – + + +
6 + + – – + + – + + – – – – + – + – + +
7 + + + – – + + – + + – – – – + – + – +
8 + + + + – – + + – + + – – – – + – + –
9 – + + + + – – + + – + + – – – – + – +
10 + – + + + + – – + + – + + – – – – + –
11 – + – + + + + – – + + – + + – – – – +
12 + – + – + + + + – – + + – + + – – – –
13 – + – + – + + + + – – + + – + + – – –
14 – – + – + – + + + + – – + + – + + – –
15 – – – + – + – + + + + – – + + – + + –
16 – – – – + – + – + + + + – – + + – + +
17 + – – – – + – + – + + + + – – + + – +
18 + + – – – – + – + – + + + + – – + + –
19 – + + – – – – + – + – + + + + – – + +
20 – – – – – – – – – – – – – – – – – – –
i
E
N M
Mi i
2
i
t
. .E S Ei
Y 0
k j i iX 1
ii Xi2
1 , 1 2 k j i j k j j i ijXX
Y= +
+ + + + = = = = + + + + + + + + 0
1X1 2X2 3X3 11X12 22X22 33X32 12X1X2 13X1X3 23X2X3
eff
V
d 2n E
i E
N M
Mi i
2
i
t
. .E S Ei
Y 0
k j i iX 1
ii Xi2
1 , 1 2 k j i j k j j i ijXX
Y= +
+ + + + = = = = + + + + + + + + 0
1X1 2X2 3X3 11X12 22X22 33X32 12X1X2 13X1X3 23X2X3
eff
V
d 2n E
i
E
N M
Mi i
2
i
t
. .E S Ei
Y 0
k j i iX 1
ii Xi2
1 , 1 2 k j i j k j j i ijXX
Y= +
+ + + + = = = = + + + + + + + + 0
1X1 2X2 3X3 11X12 22X22 33X32 12X1X2 13X1X3 23X2X3
eff
V
d 2n E
ASM Science Journal, Volume 4(2), 2010
106
(mg/l), X3 = corn steep solids (mg/l), β1, β2, and β3 = linear
coefficients, β12, β13, and β23 = cross product coefficients.
Analysis of the design experiments were carried out using statistical software package Design Expert (Stat-Ease Inc. Statistics Made Easy, Minneapolis, MN ver. 6, 1999).
A total of 17 trials with five replicates at the centre point were employed to fit a second-order response surface. All
experiments were done in triplicates and the mean response values were used in the computation.
Verification and Confirmation of the Proposed RSM Model
Five out of the ten optimal conditions computed from the
optimization experiments were verified experimentally and
compared with the calculated data from the model. Similar general media was used with addition of yeast extract, starch and corn steep solids as indicated by the proposed model. A triplicate set of experiments were conducted and the average of the three datasets was used to attain the optimized point. The observed percentage decolourisation was then compared to the predicted one as generated by the software.
MATERIALS AND METHODS
Micro-organisms and Culture Conditions
The selected bacterial consortium consist of three isolates
identified as Chryseobacterium and Flavobacterium genus and was prepared by inoculating the individual strains grown overnight on nutrient agar plates in an Erlenmeyer
flask containing 100 ml nutrient broth (NB). The culture
media was shaken at 150 r.p.m. at room temperature and left for 24 h.
Media and Components
Nutrient broth, yeast extract (YE), peptone, nutrient agar (NA), soluble starch, yeast extract peptone dextrose (YEPD) and yeast nitrogen base (YNB) were purchased from Difco and corn steep solids was purchased from Sigma laboratory supplies. Media for the decolourisation experiments contained (g/l): NaCl (2.0), MgSO4.7H2O (0.4), CaCl2.2H2O (0.5), MgCl2.6H2O (0.7), K2HPO4 (0.3), and KH2PO4 (0.3). The other variables were added and adjusted accordingly as listed in Table 1, 2 and 3.
Chemicals
All the general chemicals used were purchased from Sigma (USA), Merck (Germany) and BDH (England). Commercial test kits for the determination of some of the environmental parameters were purchased from HACH Company (USA). Depending upon the use, all chemicals were of Analar, HPLC or equivalent grade. PR-MX8B, a reactive azo dye was obtained from the Textile Technology Laboratory, Faculty of Applied Sciences, Universiti Teknologi MARA, Shah Alam, Selangor.
Decolourisation Assay
Decolourisation of the individual dyes was determined at their respective maximum absorption wavelength in the culture supernatants using a spectrophotometer. A sample of culture broth was withdrawn daily and about 1 ml was centrifuged at 10 000 r.p.m. for 15 min (Eppendorf Centrifuge 5415), before its optical density was measured.
Table 3. The actual Box-Behnken design for the three independent variables.
Trial Yeast extract (g/l) Soluble Starch (g/l) Corn steep solids (g/l)
1 –1 –1 0
2 1 –1 0
3 –1 1 0
4 1 1 0
5 –1 0 0
6 1 0 –1
7 0 0 –1
8 0 0 1
9 0 –1 1
10 0 1 –1
11 0 –1 –1
12 0 1 1
13 0 0 0
14 0 0 0
15 0 0 0
16 0 0 0
17 0 0 0
O. Khadijah et al.: Statistical Experimental Designs: Optimization of Medium Composition
107
The optical densities (OD) measured were then converted to the dye concentrations using the respective standard
curves. The efficiency of colour removal was expressed as
the percentage ratio of the decolorized dye concentration to that of initial one based on the following Equation 6 (Chen et al. 2003),
Colour removal (%) = Dye (i) – Dye (r) Dye (i) 100% (6)
where Dye (i) = initial dye concentration (mg/l), Dye (r) = residual dye concentration (mg/l).
RESULTS AND DISCUSSION
Screening of Variables Required for Decolourisation of PR-MX8B by Plackett-Burman Design
The results of the Plackett-Burman design experiments are shown in Table 4. The table shows the magnitude of effect, its standard error (S.E.), the t-test (t(5)) and its
associated P-value and percentage confidence level. The t-test estimates the probability of finding an observed
effect on decolourisation (the measured output) if P < 0.01
i.e. confidence level >99%. A positive effect value, E (Xi)
indicates that the growth factor i exert a beneficial effect on
decolourisation when present at a high amount, and vice versa.
Of the various organic and inorganic nitrogen sources
tested, yeast extract had the most significant positive
effect on the decolourisation of all dyes. This result was in
accordance to findings in other studies (Chen et al. 2003; Khehra et al. 2005; Moosvi et al. 2007). Yeast extract has been widely reported as the most effective carbon-nitrogen source (Nigam et al. 1996; Kapdan et al. 2000), where complete decolourisation of several dyes was
obtained in 24 h. In addition to yeast extract, peptone and
corn steep solids also showed significant positive effects
on decolourisation. Contrasting results however, were obtained by several researchers with regards to the peptone effect on decolourisation. A positive effect of peptone was reported in stimulating biodecolourisation of Reactive Brilliant Blue KN-R (Nam & Renganathan 2000), while for Remazol Violet 5R, poor decolourisation was observed in its presence (Moosvi et al. 2007). The positive effect of corn steep solids on decolourisation was an advantage in terms of cost since corn steep solids were much cheaper compared to yeast extract and peptone. The addition of organic nitrogen sources were considered essential medium supplements for the regeneration of nicotinamide adenine dinucleotide (NADH) that act as electron donor for the reduction of azo dyes by microorganisms (Nam & Renganathan 2000).
The decolourisation of dyes by bacteria has been reported to have been attained in synthetic media containing various extra carbon sources (Nigam et al. 1996a; 1996b). Of all the carbon sources tested, starch
and glucose gave the most significant positive effects on
dye decolourisation. A similar observation was obtained based on decolourisation of Reactive Turquoise Blue (RTB) and it was suggested that glucose is a readily
biodegradable carbon and energy source and sufficient
glucose promotes microbial proliferation, thus producing more bacterial cells capable of removing RTB (Fu et al. 2002). However, contrasting results where the addition
of glucose reduced the decolourisation efficiency of
various dyes had also been observed and in addition, lactose and sucrose had caused nearly complete decolourisation of the dyes (Kapdan et al. 2000). These observations suggest that the suitability of the carbon sources varied according to the consortium since different types of micro-organisms required different nutrients to support growth.
Table 4. Statistical analysis of the effect of medium components on decolourisation of PR-MX8B based on Plackett-Burman design results.
Variables Medium component Effect S.E. t(5) P-value Confidence level (%)
X1 Yeast extract 11.55 0.9168 12.60 6 × 10⁻⁵ 99.99
X2 Peptone 6.45 0.9168 7.035 0.0009 99.91
X3 Corn steep solids 7.25 0.9168 7.906 0.0001 99.94
X4 Ammonium sulfate 1.35 0.9168 1.473 0.2009 79.91
X5 Urea –1.55 0.9168 1.691 0.1517 84.83
X6 Sodium nitrate –3.45 0.9168 3.763 0.00232 46.29
X7 Nutrient broth –0.65 0.9168 0.709 0.5100 49.00
X8 Glucose –0.95 0.9168 1.036 0.3476 65.24
X9 Maltose 1.05 0.9168 1.145 0.3039 69.61
X10 Mannitol –0.85 0.9168 0.9272 0.3964 60.36
X11 Starch 6.65 0.9168 7.254 0.0008 99.92
X12 Sodium acetate 0.65 0.9168 0.709 0.5100 48.99
X13 pH 0.65 0.9168 0.709 0.5100 49.00
X14 Inoculum size 8.75 0.9168 9.544 0.0002 99.98
ASM Science Journal, Volume 4(2), 2010
108
The effects of other components such as the pH and inoculum size on the majority of the dyes were found to be not
statistically significant (confidence level < 99%), although
some dyes displayed improved decolourisation with increase in inoculum size and decrease in pH. pH within the range
of 6–8 was favourable for efficient decolourisation (Çetin & Dönmez 2006) and pH 7 was identified as the optimum pH for fast and efficient decolourisation of Reactive Red
22 (Chang & Kuo 2000) and Reactive Violet 5R (Moosvi et al. 2007). Thus, for further optimization experiments, yeast extract, corn steep solids and starch were chosen as part of the general culture medium. These substrates were chosen on the basis of the calculated t-values and also after
the decolourisation efficiency and economical factors were
considered. In addition, the initial pH of the medium was maintained at 7 and the culture was inoculated with 10%
inoculum size since smooth efficient decolourisation was
obtained with 10% inoculum size (Assadi et al. 2001).
Optimisation of Screened Medium Components for Decolourisation of PR-MX8B
In order to approach the optimum response region for
decolourisation efficiency, the significant independent
variables (yeast extract, X1; starch, X2; and corn steep solids, X3) were further explored, each at three levels. A second order quadratic model was used to explain the mathematical relationship between the controllable variables and the response since the estimated response seemed to have a functional relationship only on a local region or near the centre points of the model. Contour plots were then obtained when the data were fed into the design
expert software and analyzed by it. Each contour plot represented the effect of two medium components at their
studied concentration range and at a fixed concentration
of the third medium component. The value of the third medium component was varied for that situation with the software and the optimum value was obtained. For the
PR-MX8B, the final mathematical expression in terms of
coded variables relating to the percentage decolourisation of the dyes with the above variables like X1, X2 and X3 is given in the following Equation 7, where Y is the predicted response.
Y = 53.41 + 18.24 X1 – 0.56 X2 + 4.82 X3 + 7.80 X2
1 – 3.22 X22 – 2.51 X23
+ 0.64 X1 X2 – 5.86 X1 X3 + 0.40 X2 X3 (7) The percentage decolourisation of DM from the model at each experimental point is summarized in Table 5 together with the experimental and theoretical predicted values. The summary of the analysis of variance (ANOVA) is shown in Table 6. Based on the analysis, the multiple
correlation coefficient, R2 for biodecolourisation of the dye
obtained is 0.9976 while the coefficient of determination
(Adj. R2) is 0.9945. These values relatively indicate that the
experimental data obtained fitted well with the predicted
model. The model F-value of 325.10 implies the model is
significant and the lack of fit F-value of 5.90 implies the lack of fit was not significant relative to the pure error.
Surface plots representing the experimental results are shown in Figures 1 to 3, respectively. From Figure 1 the maximum predicted percentage dye decolourisation
Table 5. Experimental and theoretical values for percent decolourisation of PR-MX8B.
Trial Actual value (%) Predicted value (%)
1 41.11 41.19
2 75.02 76.13
3 39.90 38.81
4 76.40 76.30
5 29.88 29.96
6 78.90 77.98
7 50.20 51.13
8 75.99 75.91
9 44.54 44.35
10 41.43 42.46
11 53.95 52.93
12 52.45 52.63
13 54.05 53.91
14 54.21 53.91
15 54.41 53.91
16 54.01 53.91
17 52.88 53.91
O. Khadijah et al.: Statistical Experimental Designs: Optimization of Medium Composition
109
between 0.50 g/l to 5.00 g/l of yeast extract and starch is 79.17%. The optimisation level of dye decolourisation was 79.17% at 5.00 g/l yeast extracts and 2.99 g/l starch. Yeast extract has been widely reported as the most effective carbon-nitrogen source where complete decolourisation of several dyes was obtained in 24 h (Nigam et al. 1996a; Kapdan et al. 2000). Efficient decolourisation was also
observed based on decolourisation of RTB, and it was
suggested that sufficient carbon source promotes microbial
proliferation, thus producing more bacterial cells capable of decolorizing the dye (Fu et al. 2002). An increase in yeast extract and starch concentrations resulted in increased decolourisation, but addition of too much yeast extract was costly while increased amount of starch would contribute to higher COD.
The effect of yeast extract and corn steep solids can be clearly seen in Figure 2. Optimum level of dye decolourisation was 79.17% at 5.00 g/l yeast extract and 1.89 g/l corn steep solids. With increasing corn steep solids
concentration there was no effect on dye decolourisation.
However, sufficient levels of corn steep solids, with a
gradual increase in yeast extract concentration resulted in maximum dye decolourisation. The positive effect of corn steep solids on decolourisation was an advantage in terms of cost since corn steep solids were much cheaper compared to yeast extract.
The maximum percentage of dye decolourisation was found to occur with increasing starch (0.500 g/l to 2.75 g/l) and corn steep solids (0.50 g/l to 2.99 g/l) at 5.00 g/l yeast extract as shown in Figure 3. An optimum level of starch of 2.99 g/l with corn steep solid concentration of 1.89 g/l showed a maximum percentage dye decolourisation of 79.17%. With further increase of starch and corn steep solids, dye decolourisation was decreased. Overall, the analysis of the surface plots in the optimization experiments results indicated that the presence of yeast extract in the culture medium was essential for decolourisation of the dye; with increasing amount of Table 6. Regression analysis for the decolourisation of PR-MX8B (quadratic response surface model fitting).
Source Sum of squares Degree of freedom Mean square F value Prob > F
Model 3244.40 9 360.49 325.10 <0.0001
Residual 7.76 7 1.11
Lack of fit 6.33 3 2.11 5.90 0.0596
Pure error 1.43 4 0.36
Correlation total 3252.17 16
Coefficient of correlation (R2) = 0.9976; coefficient of determination (Adj R2) = 0.9945
Figure 1. Surface plot showing the effect of starch and yeast extract on percentage decolourisation of PR-MX8B.
33.99 45.36 56.74 68.11 79.49
Decolourisation (%)
0.50 1.63
2.75 3.88
5.00
0.50 1.63 2.75 3.88 5.00
B: Starch (g/l) A: Yeast extract
29.58 42.06 54.55 67.04 79.53
Decolourisation (%)
0.50 1.63
2.75 3.88
5.00
0.5 1.625 2.75 3.875 5
C: Corn steep solid (g/l) A: Yeast extract (g/l)
33.99 45.36 56.74 68.11 79.49
Decolourisation (%)
0.50 1.63
2.75 3.88
5.00
0.50 1.63 2.75 3.88 5.00
B: Starch (g/l) A: Yeast extract
29.58 42.06 54.55 67.04 79.53
Decolourisation (%)
0.50 1.63
2.75 3.88
5.00
0.5 1.625 2.75 3.875 5
C: Corn steep solid (g/l) A: Yeast extract (g/l)
72.20 74.04 75.88 77.72 79.56
D
ec
o
lo
u
ri
sa
ti
o
n
(%
)
0.50 1.63
2.75 3.88
5.00
0.50 1.63 2.75 3.88 5.00
B: Starch (g/l) C: Corn steep solid (g/l)
Figure 2. Surface plot showing the effect of yeast extract corn steep solids on percentage decolourisation of PR-MX8B.
Figure 3. Surface plot showing the effect of corn steep solids and starch on percentage decolourisation of PR-MX8B.
O. Khadijah et al.: Statistical Experimental Designs: Optimization of Medium Composition
111
yeast extract (from 0.5 g/l – 5 g/l), there was an increase in dye decolourisation. Several studies have reported similar
findings (Chen et al. 2003; Asad et al. 2007) and in addition it was also found that the decolourisation increased only slightly in the range of 5 g/l – 10 g/l of yeast extract (Chen et al. 2003).
Verification of the Model
The optimal conditions obtained from the optimization
experiments were verified experimentally and compared
to those of calculated data from the model. Five out of 10 proposed calculated optimal culture compositions for the yeast extract, starch and corn steep solids were selected at random and the results are shown in Table 7. In general, the experimental percentage decolourisations were lower than those of the predicted values. Those are common observations as found by other experimental design studies (El-Sersy 2007; Abdel-Fattah & Olama 2002). The highest estimated percentage decolourisation was 72.11 obtained from the proposed solution V (5.00 g/l yeast extract; 2.99 g/l starch; 1.89 g/l corn steep solids) while the predicted value from the polynomial model was 79.17%. The result
of the verification experiment revealed a 90.81% degree of
accuracy for the model.
CONCLUSION
The two-factorial Plackett-Burman design chosen for the study allowed the investigation of 14 independent variables at two different levels. Based on the analysis, three critical variables: yeast extract; starch and corn steep solids were
identified and tested further in the optimisation experiments.
In the optimization process, analysis of the Box-Behnken results showed that 5.00 g/l yeast extract, 2.99 g/l starch and 1. 89 g/l corn solids were the best combination for treating PR-MX8B. In conclusion, the result indicated that the methodology of Plackett-Burman and Box-Behnken
designs had proved efficient and the use of these techniques
had helped to identify the important medium components
which had significant effects on dye and textile wastewater
decolourisation. Further studies are being conducted on applying the techniques in a bioreactor.
ACKNOWLEDGEMENT
The author would like to thank Universiti Teknologi MARA, Shah Alam, Selangor, Malaysia for funding the research.
Date of submission: November 2008 Date of acceptance: May 2010
REFERENCES
Abdel-Fattah, YR & Olama, ZA 2002, ‘L-asparaginase production by pseudomonas aeruginosa in solid-state culture: evaluation and optimization of culture conditions using factorial designs’, Process Biochemistry, vol. 38, pp. 115–122.
Annadurai, G, Sivakumar, T & Babu, SR 2000, ‘Photocatalytic decolourisation of congo red over ZnO powder using Box-Behnken design of experiments’, Bioprocess Engineering, vol. 23, pp. 167–173.
Asad, S, Amoozegar, MA, Pourbabaee, AA, Sarbolouki, MN & Dastgheib, SMM 2007, ‘Decolorization of textile azo dyes by newly isolated halophilic and halotolerant bacteria’, Bioresource Technology, vol. 11, pp. 2082–2088.
Assadi, MM, Rostami, K, Shahvali, M & Azin, MA 2001, ‘Decolorization of textile wastewater by Phanerochaete chrysosporium’, Desalination, vol. 141, pp. 331–336.
Çetin, D & Dönmez, G 2006, ‘Decolorization of reactive dyes by mixed cultures isolated from textile effluent under anaerobic conditions’, Enzyme Microbial Technol. vol. 30, pp. 926–930.
Chang, J & Kuo, T 2000, ‘Kinetics of bacterial decolorization of azo dye with Escherichia coli NO3’, Biores Technology, vol. 75, pp. 107–111.
Chang, JS & Lin, YC 2003, ‘Fed batch bioreactor strategies for microbial decolorization of azo dye using Pseudomonas luteola strain’, Biotechnol Progress, vol. 16, pp. 979– 985.
Chen, K, Wu, J, Liou, D & Hwang, SJ 2003, ‘Decolorization of the textile dyes by newly isolated bacterial strains’, J. of Biotechnology. vol.101, pp. 57–68.
Dong, X, Zhou, J & Ying, L 2003, ‘Peptone-induced biodecolourisation of Reactive Brilliant Blue (KN-R) by
Table 7. Theoretical and actual values for percentage decolourisation of PR-MX8B based on the proposed optimised media combinations. Proposed solutions Yeast extract (g/l) Starch (g/l) Corn steep solids (g/l) % Decolourisation
Predicted value Actual valuea
I 4.98 3.11 3.02 51.06 40.11 ± 1.12
II 5.00 0.78 2.96 79.00 70.10 ± 2.71
III 4.97 2.92 1.75 78.91 69.68 ± 3.55
IV 4.99 3.02 2.84 78.47 68.97 ± 1.85
V 5.00 2.99 1.89 79.17 72.11 ± 0.50
aNote: Results represent an average of three independent experiments
ASM Science Journal, Volume 4(2), 2010
112 Rhodocyclus gelatinosus XL-1’, Process Biochemistry, vol. 39, pp. 89–94.
Easton, J 1995, ‘The dye maker’s view’, in Colour in dyehouse effluent, ed P Cooper, Society of Dyers and Colourists, Bradford.
El-Sersy, NA 2007, ‘Bioremediation of Methylene Blue by Bacillus thuringiensis 4 G1: application of statistical designs and surface plots for optimization’, Biotechnology, vol. 6, no.1, pp. 34–39.
Fu, L, Wen, X & Qian, Y 2002, ‘Removal of copper-phthalocyanine dye from wastewater by acclimated sludge under anaerobic or aerobic conditions’, Process Biochemistry, vol. 37, pp. 1151–1156.
Gohel, V, Chaudhary, T, Vyas, P & Chhatpar, HS 2006, ‘Statistical screening of medium components for the production of chitanase by the marine isolate Phantoea dispersa’, Biochem Eng J., vol. 28, pp. 50–56.
Hao, OJ, Kim, H, Chiang, P 2000, ‘Decolorization of wastewater’, Crit. Rev. Environ. Sci. Technol., vol. 30, no. 4, pp. 449–5051.
Kandelbauer, A & Guebitz, GM 2005, ‘Bioremediation for the decolorization of textile dyes — a Review’,
in Environmental chemistry — green chemistry and
pollutants in ecosystem, eds E Lichtfouse, J Schwarzbauer and D Robert, Berlin: Springer Berlin Heidelberg.
Kapdan, IK, Kargi, F, McMullan, G & Marchant, R 2000, ‘Effect of environmental conditions on biological decolorization of textile dyestuff by C. versicolor’, Enzyme & Microbial Technol., vol. 26, pp. 381–387.
Khehra, MS, Saini, HS, Sharma, DK, Chadha, BS & Chimni, SS 2005, ‘Decolorization of various azo dyes by bacterial consortium’, Dyes & Pigments, vol. 67, pp. 55–61.
Montgomery, DC 1997, Design and analysis of experiments, 3rd edn, John Wiley & Sons Inc., New York.
Moosvi, S, Kher, X & Madamwar, D 2007, ‘Isolation, characterization of textile dyes by a mixed bacterial consortium JW-2’, Dyes & Pigments, vol. 74, pp. 723– 729.
Nam, S & Renganathan, V 2000, ‘Non-enzymatic reduction of azo dyes by NADH’, Chemosphere, vol. 40, pp. 351– 357.
Nigam, P, Banat, IM, Singh, D & Marchant, R 1996a, ‘Microbial process for the decolorization of textile effluent containing azo, diazo and reactive dyes’, Process Biochemistry, vol. 31, no. 5, pp. 435–442.
Nigam, P, Mc Mullan, G, Banat, I, Marchant, R 1996b, ‘Decolourisation of effluent from the textile industry by a microbial consortium’, Biotechnol. Letter, vol. 18, pp. 117–120.
Novotný, C, Rawal, B, Bhatt, M, Patel, M et al.
2001, ‘Capacity of Irpex lacteus and Pleurotus
ostreatus for decolorization of chemically different
dyes’, J of Biotechnology, vol. 89, pp. 113–
121.
Plackett, RL & Burman, JP 1946, ‘The design of optimum multifactorial experiments’, Biometrika, vol. 37, pp. 305– 325.
Robinson, T, McMullan, G, Marchant, R & Nigam, P 2001, ‘Remediation of dyes in textile effluent: a critical review on current treatment technologies with a proposed alternative’, Biores Technology, vol. 77, pp. 247–255.
Zollinger, H 2003, Colour chemistry — synthesis, properties and application of organic dyes and pigments, 3rd edn, Wiley-VCH, Zurich.
Historically, margarine was invented by a French chemist, Mege Mouries to substitute butter (Chrysam 1985). It is similar in taste and appearance to butter but possesses several distinct differences. In terms of microstructure, margarine is water in an oil emulsion consisting of edible oils and an aqueous phase. The emulsion contains dispersed water droplets of typically 2-4 µm diameter (Moran 1993). Margarine is a very important ingredient for the baking industry because it comprises 10%–50% of most baked products. Excess consumption of these products is normally associated with health problems such as obesity (List 2004). However, fat-containing diets cannot be restricted due to some functionalities of fat in our body. Fat also plays an
important role in texture and flavour development in food.
The consumption of food having low calories is suggested
for consumers with lifestyle-related diseases (Sandrou & Arvanitoyannis 2000).
Medium- and long-chain triacylglycerols (MLCT) are tailor-made lipids that contains medium-chain fatty acids (MCFA) and long chain fatty acids (LCFA) on the same glycerol backbone (Kasai et al. 2003). Medium chain fatty acids give low caloric availability by fast burning
and make them good candidates for efficient dietary
treatment in obesity. Consumption of MLCT containing 10%–18% of MCFA has been reported to reduce body weight accumulation over short and long periods (Shinohara et al. 2005; Kasai et al. 2003; Matsuo et al. 2001). Nosaka et al. (2003a; 2003b) reported that consumption of
MLCT-enriched margarine led to a significant decrease
Physicochemical Properties of Margarines Enriched
with Medium- and Long-chain Triacylglycerol
N. Arifin1,5, L.Z. Cheong1, S.P. Koh1, K. Long2*, C.P. Tan3, M.S.A. Yusoff4 and O.M. Lai1,6
Several binary and ternary medium- and long-chain triacylglycerol (MLCT)-enriched margarine formulations
were examined for their solid fat content, heating profile, polymorphism and textural properties. MLCT feedstock was produced through enzymatic esterification of capric and stearic acids with glycerol. The binary
formulations were produced by mixing MLCT feedstock blend (40%–90%) and palm olein (10%–60%) with
10% increments (w/w). Solid fat profiles of commercial margarines were used as a reference to determine the
suitability of the formulations for margarine production. The solid fat content of the binary formulations of MO 82 and MO 91 (M, MLCT, O, palm olein) were similar to the commercial margarines at 25°C which met the
basic requirement for efficient dough consistency. Ternary formulations using reduced MLCT feedstock blend
proportion (from 80%–90% to 60%–70%) were also developed. The reduction of MLCT feedstock blend was done as it had the highest production cost (3USD/kg) in comparison to palm olein (0.77USD/kg) and palm stearin (0.7USD/kg). The proportions of 5%–15% of palm stearin were substituted with palm olein in MO 64 and MO 73 (M, MLCT; O, palm olein) formulations with 5% increment (w/w). As a result, MOS 702010 and MOS 603010 (M, MLCT; O, palm olein; S, palm stearin) margarine formulations showed similar SFC % to the commercial margarines at 25ºC. These formulations were subsequently chosen to produce margarines. The onset melting and complete melting points of MLCT-enriched margarine formulations were high (51.04ºC –57.93ºC) due to the presence of a high amount of long chain saturated fatty acids. Most of the formulations
showed β΄- crystals. MOS 702010 was selected as the best formulation due to values for textural parameters
comparable (P<0.05) with commercial margarine.
Key words: medium- and long-chain triacylglycerol (MLCT); margarines; solid fat content; heating profiles;
polymorphism; textural properties; formulation; palm olein; palm stearin ASM Sci. J., 4(2), 113–122
1Dept. of Bioprocess Technology, Faculty of Biotechnology and Biomolecular Sciences, Universiti Putra Malaysia, 43400 Serdang,
Selangor, Malaysia
2Malaysian Agricultural Research and Development Institute, P.O. Box 12301, 50774 Kuala Lumpur, Malaysia
3Dept. of Food Technology, Faculty of Food Science and Technology, Universiti Putra Malaysia, 43400 Serdang, Selangor, Malaysia 4Golden Hope Research Centre, P.O. Box 207, 47200 Banting, Selangor, Malaysia
5Faculty of Science and Technology, Universiti Sains Islam Malaysia, 71800 Bandar Baru Nilai, Negeri Sembilan, Malaysia 6Institute of Biosciences, Universiti Putra Malaysia, 43400 Serdang, Selangor, Malaysia
*Corresponding author (e-mail: [email protected])
113
ASM Science Journal, Volume 4(2), 2010
114
in body fat accumulation as compared to LCT-enriched margarine. Clinically, MLCT has no adverse effect on body fat reduction when ingested excessively (Matulka et al. 2006).
Recently, the production of structured lipids involving the incorporation of medium- and long-chain fatty acids in the same molecule structure has received a lot of attention (Koh et. al. 2008; Lai et al. 2005; Yankah & Akoh 2000; Zainal & Yusoff 1999; Seriburi & Akoh 1998). Some examples of commercial structured lipids are CapreninTM (Procter & Gamble Co., Cinnati, OH) and Healthy RessetaTM (Nisshin Oillio Group, Ltd). CapreninTM
is a modified lipid containing caprylic, capric and behenic fatty acids esterified randomly to a glycerol backbone and
used as a cocoa butter replacement. On the other hand, Healthy RessetaTM has been approved as FOSHU (Food for
Specified Health Use) by the Ministry of Health, Labor and
Welfare of Japan in December 2002 for use as cooking oil (Aoyama et al. 2007).
The aim of this study was to determine the suitability of various MLCT-enriched formulations for margarine production. In this present study, binary and ternary formulations of MLCT-enriched margarine were developed by mixing MLCT feedstock blend, palm olein and palm stearin. The physicochemical properties of these
formulations such as solid fat content, heating profiles and polymorphism were determined. The solid fat profiles
of commercial margarines were used as a guideline to choose the suitable formulations for margarine production. Textural analysis was also performed on the selected MLCT-enriched margarines.
MATERIAL AND METHODS
Materials
MLCT feedstock were produced through Lipozyme RM
IM lipase-catalyzed esterification of capric and stearic
acids with glycerol. Further details on the production of MLCT feedstock were described in “Production and
Purification of MLCT feedstock”. The palm stearin IV44
was obtained from Golden Jomalina Food Industries Sdn. Bhd. (Teluk Panglima Garang, Selangor). Palm olein IV60 and commercial margarines, Planta (Unilever Malaysia Holding Sdn Bhd, Malaysia) and Daisy (Lam Soon (M) Berhad, Malaysia) were bought from Carrefour Hypermarket (Putrajaya, Wilayah Persekutuan). The commercial margarines were palm-based products. Commercial immobilized lipase from Rhizomucor meihei (Lipozyme RM IM) was obtained from Novozymes A/S (Bagsvaerd, Denmark). All chemicals and solvents used were either of analytical or high-performance liquid chromatography (HPLC) grades, respectively.
Production and Purification of MLCT Feedstock
The production of MLCT feedstock was conducted in a 10 l stirred tank bioreactor equipped with a vacuum pump and two vertically aligned three-bladed impellers in the feed tank (Paramount Impact Sdn. Bhd., Sri Kembangan,
Selangor) as described in Arifin et al. (2009). Optimized parameters of MLCT feedstock production were obtained using response surface methodology (RSM) (unpublished data). The optimized parameters used for MLCT feedstock production were: reaction temperature, 65ºC; reaction time, 14 h; enzyme load, 8% (w/w) and fatty acids/glycerol molar ratio, 3:1. At the end of the reaction
time, the products were removed and filtered out using a
muslin cloth from the bottom of the vessel. The products
were then purified using a short path distillator (SPD).
The conditions of short path distillation used for MLCT
feedstock purification followed Arifin et al. (2009). Other settings used were: feed rate, 5 kg/h; evaporator vacuum, 0.001 and heat exchanger temperature, 80ºC. Palm
olein was mixed with unrefined MLCT feedstock in a 1:1
ratio to reduce the melting point of the latter fat. This was
done due to the quick solidification of MLCT feedstock in
the feeding tank, subsequently disabling the process being carried out.
Sample Preparation
The fats and oil composition for MLCT-enriched formulations are shown in Table 1. Six binary formulations of MLCT feedstock blend (40%–90%) and palm olein (10%–60%) (w/w) were produced with increments of 10% (w/w) for each formulation. Ternary formulations were developed by substituting 5%, 10% and 15% of palm olein with palm stearin in MO 73 and MO 64. MLCT feedstock blend, palm olein and palm stearin were heated at 80ºC for 30 min in an oven to remove crystal structures. The
liquefied fats and oil were then mixed according to their
proportions with a total weight of 50 g of fats and oil (w/w) in the sample bottles. All the formulations were kept at room temperature (25ºC) prior to analysis.
Fatty Acid Composition (FAC)
The fatty acid composition (FAC) of MLCT feedstock, palm olein, and palm stearin was determined by AOCS
(1997) Official Methods Ce 1-62. FAC of the samples
was determined after converting free and glyceride fatty acids to their corresponding fatty acid methyl esters (FAME) and analyzing the FAME by gas chromatography (Hewlett-Packard, Wilmington, DE, USA equipped with
a flame-ionization detector). FAME's were prepared by transesterification of fat (50 μl) with isopropanol (950 μl) and sodium methoxide (0.5 N, 50 μl). The conditions
of FAC analysis were: column oven, 170ºC (isothermal);
carrier gas, helium 99.9%; carrier gas flow, 1 ml/min and
running time, 13 min.
N. Arifin et al.: Production of Functional Margarine
115
Solid Fat Content (SFC)
Solid fat content was measured by Bruker PC/20 series pulsed Nuclear Magnetic Resonance (pNMR) Analyzer (Minispec, Bruker, Karlsruhe, Germany) as described in
AOCS official method Cd 10-57 (AOCS 1997). The samples
were heated at 80ºC for 30 min to destroy the history of the crystal. During this study, the samples were evaluated at 5ºC intervals from temperatures of 0ºC to 60ºC.
Heating Profiles
Heating profiles of MLCT-enriched margarine formulations
were measured using Pyris Diamond DSC equipped with an intra-cooler 2P (Perkin Elmer, Norwalk, CT, USA)
according to the Official Method Cj 1-94 of AOCS (1997).
An empty aluminum pan was used as a reference, and 7 mg – 9 mg samples were weighed. The samples were heated to 80ºC for 10 min to destroy their crystal memory. A crystallization curve was obtained by cooling to –60ºC at 5ºC/min and holding the temperature for 10 min. The samples were then heated to 80ºC to determine the heating
profiles at heating rates of 5ºC/min. Although both cooling and heating profiles were done, only heating curves will be
discussed here.
Fourier Transform Infrared Spectroscopy
Fourier Transform Infrared Spectroscopy (FT-IR) is a rapid technique that measures vibrations of bonds within functional groups. The polymorphism of MLCT-enriched margarine formulations was determined according to Piska et al. (2006) using FT-IR spectroscopy. The sample was
first melted at 80ºC to erase the crystallization history and
then the liquid sample was compressed between two KBr windows. IR spectra were collected by using a Perkin Elmer FT-IR Spectrum 2000 Spectrometer (Norwalk, CT).
The sample was measured using wavelengths between 900 cm–1 and 600 cm–1.
Production of Margarine
Margarines were produced according to the modified
method of Li et al. (1999). The fat phase comprised 80%
fats and oils, and 0.003% colouring and flavouring while
the water phase consisted of 14% hot water, 1% skimmed milk and 2% salt. The two phases were prepared separately in two different 1000 ml beakers. The formulations selected for margarine production were MOS 602010 and MOS 702010. The two mixtures of 560 g of fat phase and 119 g of water phase were mixed in a 1000 ml beaker and blended for one min using a food blender (Cornell, Kuala Lumpur). The margarine containing beaker was then put in the vessel and chilled with ice at the bottom and surrounding the beaker. The mixture was stirred using a spatula until crystals were completely formed. The beaker was removed from the vessel and stored at room temperature for four h. The fat crystals were kneaded with the mixer for approximately one min at speed two and kept at 25ºC. The margarine (approx. 60 g) was then transferred into a cup of identical shape and size and kept at room temperature (25ºC) for textural analysis.
Textural Profile Analysis (TPA)
TPA was conducted for commercial and MLCT-enriched margarines using TA.XT2i Texture Analyzer (Stable Micro Systems, Godalming, Surrey, UK), with a 5 kg load cell as described in MAR2/45C TA.XT Plus Application Study
Method (2006). A forty-five degree conical probe (P/45C)
was employed and conditions of analysis were: pre-test speed, 2.0 mm/s; test speed, 1.0 mm/s; post-test speed, 10 mm/s; strain, 10%; data acquisition rate, 200 p.p.s., and trigger type, 5 g. The hardness and adhesiveness of the
Table 1. Composition of binary and ternary MLCT-enriched margarine formulations.
Formulations a Composition (Proportion w/w)
MLCT feedstock (M) Palm olein (O) Palm stearin (S)
MO 46 40 60 –
MO 55 50 50 –
MO 64 60 40 –
MO 73 70 30 –
MO 82 80 20 –
MO 91 90 10 –
MOS 603505 60 35 5
MOS 603010 60 30 10
MOS 602515 60 25 15
MOS 702505 70 25 5
MOS 702010 70 20 10
MOS 701515 70 15 15
a Indicates the MLCT feedstock, palm olein and palm stearin ratio.
Abbreviations: M, medium and long-chain triacylglycerol (MLCT) feedstock; O, palm olein; S, palm stearin