University of New Hampshire
University of New Hampshire Scholars' Repository
Faculty Publications
1-14-2016
Decrease in coccolithophore calcification and CO2
since the middle Miocene
Clara T. Bolton
Oviedo University
Maria T. Hernandez-Sanchez
Oviedo University
Miguel-Angel Fuertes
University of Salamanca
Saul Gonzalez-Lemos
Oviedo University
Lorena Abrevaya
Oviedo University
See next page for additional authors
Follow this and additional works at:
https://scholars.unh.edu/faculty_pubs
This Article is brought to you for free and open access by University of New Hampshire Scholars' Repository. It has been accepted for inclusion in Faculty Publications by an authorized administrator of University of New Hampshire Scholars' Repository. For more information, please contact [email protected].
Recommended Citation
Abrevaya, Ana Mendez-Vicente, Jose-Abel Flores, Ian Probert, Liviu Giosan, Joel E. Johnson, and Heather M.
Stoll
ARTICLE
Received 30 Apr 2015|Accepted 26 Nov 2015|Published 14 Jan 2016
Decrease in coccolithophore calcification
and CO
2
since the middle Miocene
Clara T. Bolton
1,2, Marı´a T. Herna
´ndez-Sa´nchez
1, Miguel-A
´ ngel Fuertes
3, Sau
´l Gonza
´lez-Lemos
1,
Lorena Abrevaya
1, Ana Mendez-Vicente
1, Jose
´-Abel Flores
3, Ian Probert
4, Liviu Giosan
5, Joel Johnson
6& Heather M. Stoll
1Marine algae are instrumental in carbon cycling and atmospheric carbon dioxide (CO2) regulation. One group, coccolithophores, uses carbon to photosynthesize and to calcify, covering their cells with chalk platelets (coccoliths). How ocean acidification influences coccolithophore calcification is strongly debated, and the effects of carbonate chemistry changes in the geological past are poorly understood. This paper relates degree of coccolith calcification to cellular calcification, and presents the first records of size-normalized coccolith thickness spanning the last 14 Myr from tropical oceans. Degree of calcification was highest in the low-pH, high-CO2Miocene ocean, but decreased significantly between 6 and 4 Myr ago. Based on this and concurrent trends in a new alkenoneeprecord, we propose that decreasing CO2partly drove the observed trend via reduced cellular bicarbonate allocation to calcification. This trend reversed in the late Pleistocene despite low CO2, suggesting an additional regulator of calcification such as alkalinity.
DOI: 10.1038/ncomms10284 OPEN
1Geology Department, Oviedo University, Arias de Velasco s/n, 33005 Oviedo, Asturias, Spain.2Aix-Marseille University, CNRS, IRD, CEREGE UM34, 13545
Aix en Provence, France.3Grupo de Geociencias Ocea´nicas, Geology Department, University of Salamanca, Salamanca 37008, Spain.4CNRS, Sorbonne
Universite´s-Universite´ Pierre et Marie Curie (UPMC) Paris 06, FR2424, Roscoff Culture Collection, Station Biologique de Roscoff, Place Georges Teissier, 29680 Roscoff, France.5Department of Geology and Geophysics, Woods Hole Oceanographic Institution, 266 Woods Hole Road, MS# 22, Woods Hole,
Massachusetts 02543-1050, USA.6University of New Hampshire, Department of Earth Sciences, 56 College Road, James Hall, Durham, New Hampshire
C
occolithophores, a group of unicellular marine phytoplankton, are the only primary producers of biogenic calcite in the open ocean. During their diploid life-cycle stage, calcifying coccolithophores intracellularly produce calcite plates called heterococcoliths. These circular to elliptical coccoliths are extruded through the cell wall to form an exoskeleton, usually composed of a single layer of calcite plates, called a coccosphere. Coccolithophores play an important role in the carbon cycle because they promote the sinking of particulate organic carbon to the deep ocean1. Changes in their production of organic carbon and calcification can alter the balance between the organic and inorganic carbon pumps, with strong feedbacks on climate and atmospheric carbon dioxide concentrations (pCO2) on seasonal to geological timescales2. Despite theimportance of coccolithophore calcification to biogeochemical cycles and the large range in degree of cell-calcification (defined here as the amount of calcite per unit surface area of the cell) observed both among and within modern species, it is unclear whether specific factors drive changes in cell-calcification state of the ocean’s coccolithophore populations on evolutionary timescales. Rapid changes in ocean dissolved CO2concentration
([CO2aq]), pH, temperature and surface-water stratification in the
coming centuries may exert selective pressure on coccolithophore calcification3,4. Short-term experiments reveal an array of species- and strain-specific physiological responses to elevated [CO2aq]4–9. However, selection experiments lasting around a year
show that the negative effects of short term (o10 generations) highpCO2exposure on coccolithophore calcification and growth
are partly reversed for populations that have been exposed to long term (about 500 generations) high pCO2 conditions10,11. Such
adaptability is consistent with the geological data indicating that coccolithophores were more ubiquitous and common in the warm, high-CO2 ocean of the earlier Cenozoic, with larger
coccoliths and cells12,13. Recent work has shown that calcification competes with photosynthesis for intracellular bicarbonate (HCO3), and that multiple species of coccolithophores
reallocate HCO3 transport from calcification to photosynthesis
at low [CO2aq]14.
Here we explore the long-term response of coccolithophore calcification and HCO3 allocation to the evolution of ocean
conditions and [CO2aq] over the past 14 million years (Myr) in a
key coccolithophore family, the Noe¨laerhabdaceae. This family, which includes the genera Emiliania,Gephyrocapsa, Pseudoemi-liania and Reticulofenestra, dominates most modern ocean coccolithophore communities as well as fossil assemblages since the Miocene. As an indicator of coccolithophore calcification, we show that coccolith thickness correlates strongly with cellular calcification per unit surface area across the range of modern Noe¨laerhabdaceae. We then document changes in the size and degree of calcification of Noe¨laerhabdaceae coccoliths since 14 Myr ago in two sediment sequences from the tropical Atlantic and Indian Oceans containing well-preserved coccoliths (Ocean Drilling Program, ODP, Site 925 and Indian National Gas Hydrate Program Site NGHP-01-01A, respectively; Fig. 1). In contrast to recent studies of coccolith mass5,15–18, we present our data as coccolith thickness within narrow size classes to focus on changes in degree of calcification of coccoliths, allowing us to better capture the potential coccolithophore calcification response to changes in the palaeo-carbonate system19. These records are the first to document past long-term changes in coccolithophore calcification for given cell size classes in the Miocene and Pliocene, whenpCO2was higher than pre-industrial levels. Using
the geochemical signature of coccoliths, we then assess if changes in degree of calcification correspond to changes in the allocation of intracellular HCO3 resources to calcification. Finally, we
evaluate the potential role of changing upper ocean stratification
and [CO2aq] on both degree of calcification and HCO3 resource
allocation, using new proxy records of foraminiferal stable isotopes (d18O and d13C) and carbon isotopic fractionation by alkenone-producing haptophyte algae during photosynthesis (ep).
Results
Coccolith thickness and cellular calcification. New culture experiments sampling the diversity of modern Noe¨laerhabdaceae coccolithophores show variation in coccolith thickness both among the different species and among different strains of the same species. This variation in thickness correlates strongly with variation in cellular calcification per surface area as well as with changes in calcite/organic carbon, a measure of calcification per cell volume (Fig. 2 and Supplementary Fig. 1). The thickness of an individual coccolith is intimately linked to the degree of calcification of a cell, because it represents a key mechanism by which cells can regulate the amount of biomineral for a given cell volume. Various factors may drive cells to adjust calcite per cell surface area. In this study, we focus on changes that are occurring within narrow size classes. In addition, calcite per cell surface area varies with cell size across the modern diversity of placolith-bearing coccolithophores, where small cells are characterized by thinner coccoliths (Supplementary Fig. 2). This latter effect may be an adaptation to compensate for the higher surface area to volume ratio of small cells that, if calcification per cell surface area were constant across all cell sizes, would impose a much higher biomineral requirement relative to cell volume in small cells. While coccolith mass has been used as an indicator of cellular calcification in Pleistocene and recent sediments15–18, coccolith mass is driven by changes in cell size as well as degree of calcification. On the other hand, coccolith thickness within narrow size classes, or size-normalized coccolith thickness, represent degree of calcification and are indicators better suited to reconstructing coccolithophore calcification on long timescales over which significant coccolith and cell size changes occur. The range of coccolith thickness variation among cultured Noe¨laerhabdaceae strains (Fig. 2) is consistent with previous observations that phenotypic differences in the degree of calcification between species and between strains of the same species tend to be much larger than the phenotypic plasticity of a single strain cultured under varying environmental conditions8,9,20. This may arise if coccolith morphotype or thickness is genetically regulated9. The potential for large intraspecific diversity may reflect the genetic architecture, in that the dominant modern Noe¨laerhabdaceae Emiliania huxleyi has a pan-genome composed of core genes plus genes distributed variably amongst strains21.
Decreasing cellular calcification since the late Miocene. Over the past 14 Myr, the Noe¨laerhabdaceae have undergone large variations in coccolith size (Fig. 3) and degree of calcification, represented by thickness (Fig. 4). Changes in coccolith thickness
NGHP 01-1A ODP
925
ODP 999
are evident in both narrowly restricted size classes, as well as in measurements of size-normalized (SN) thickness and calculated ‘shape factor’, confirming that they are not a direct result of temporal changes in coccolith and cell size (isometric scaling, that is, changes related to proportional changes in size) (Fig. 4). The quantification of thickness was not biased by variable coc-colith fragmentation (Supplementary Fig. 3). Scanning electron microscope (SEM) observations confirm that in all samples the original crystal structure of the coccolith remains well defined. Only on some older coccoliths did we identify a small amount of diagenetic overgrowth (small abiogenic crystals formed on the
surface of the collar in the central area; Supplementary Data 1) However, the presence of this minor overgrowth does not correspond to an increase in coccolith thickness, except in the oldest 14 Myr old sample at the Indian Ocean Site. Thus, with this exception, the preservation visible under SEM makes it unlikely that middle Miocene Noe¨laerhabdaceae coccoliths of a given size were originally thinner and more delicate than those present in our samples. This suggests that either (1) overgrowth was minor enough not to significantly impact mean coccolith thickness, or (2) the calcite that recrystallized on the surface of coccoliths was originally derived from dissolution of primary calcite of these same coccoliths. Between 8 and 3 Myr ago at both sites, Speno-lithusandDiscoasternannoliths are abundant. These are typically more susceptible than placolith coccoliths to overgrowth due to their crystal structure, yet SEM images show that these susceptible forms exhibit excellent and constant preservation, providing supporting evidence that diagenetic overgrowth was not more significant when Noe¨laerhabdaceae coccoliths showed a higher degree of calcification at 6–8 Myr ago relative to at 3–4 Myr ago (Supplementary Data 1; Supplementary Figs 4 and 5).
The measured coccolith populations exhibit large variability in the morphology and degree of calcification of small coccoliths within and between each sample (Fig. 4; Supplementary Figs 4 and 5; Supplementary Data 1). For example, Gephyrocapsa protohuxleyi, a form close to E. huxleyi but with a central area bridge characteristic ofGephyrocapsa, was present in Pleistocene samples at both sites alongside much more heavily calcified Gephyrocapsacoccoliths. Despite this large diversity in morphol-ogy and thickness, there are significant changes in the dominance of more heavily calcified versus more lightly calcified forms over time, as well as the emergence during the early Pliocene of coccoliths thinner and/or with larger central area openings than those found in previous intervals. Coccolith degree of calcification was on average highest between 14 and 6 Myr ago and decreased abruptly in the late Miocene to early Pliocene (6–4 Myr ago) to low values that were maintained during the Pliocene and early Pleistocene (4–1 Myr ago). For the few sample points of the last 1 Myr ago, degree of calcification increased both in the Indian and Atlantic Ocean records relative to this Pliocene minimum (Fig. 4). However, we note that assemblages in our samples o1 Myr are dominated by Gephyrocapsa coccoliths and pre-date the emer-gence of the less heavily calcified E. huxleyi (see ks values,
Fig. 4d,h), which is significant especially in modern high and mid-latitude regions. Large changes in degree of coccolith calcification, including the decrease from 6 to 4 Myr ago and the increase around 1 Myr ago at both sites, occurred within the dominant genus at a given time, and do not coincide with major shifts in the contribution of different genera to the Noe¨laerhabdaceae (Fig. 4).
Late Miocene changes in cellular HCO3 allocation.
Geochemical records of carbon isotopic fractionation into coccolith calcite (ecoccolith) can be used to elucidate the
relation-ship between the observed changes in degree of calcification and the resource allocation of carbon to calcification. Models of cellular carbon fluxes have shown that ecoccolith becomes
increasingly depleted if the rate of supply of HCO3to the site of
calcification (coccolith vesicle) is reduced relative to calcification rate14. Our new records of ecoccolith from ODP Site 925 show
that large cells begin to decrease the HCO3 allocation to
calcification at about 8 Myr ago, evidenced by decreasingecoccolith
(Fig. 5a,b). This trend occurs shortly after a decrease in mean Noe¨laerhabdaceae coccolith size (interpreted as a reduction in mean cell size13) at both sites (Fig. 3) that is also observed in other low-latitude records12,22,23. Reduced HCO3 allocation to
0 0.1 0.2 0.3
Coccolith thickness (μm)
0.2 0.4 0.6 0.8 1
0 0.05 0.1 0.15
0 0.1 0.2 0.3
Coccolith thickness (μm)
Emiliania huxleyi (different strains) Gephyrocapsa oceanica (different strains) Gephyrocapsa mullerae (one strain) Range between replicate experiments
PIC/POC
R2 = 0.77
R2 = 0.73 a
PIC/SA (pg C
μ
m
–2)
b c d
0 0 1.5 1.5
3 0 0.2
2.5
Units in μm
e
3 0 1
1.5 0 0
1.5 3 f
3 0 2
1.5
0 0 1.5
3 g
1.5
1.0
0.5
0.0
Figure 2 | Noe¨laerhabdaceae coccolith morphology in culture.
(a) Relationship between coccolith thickness and cellular PIC/POC
(particulate inorganic carbon/particulate organic carbon) and cellular
PIC/cell SA (surface area) for modern strains ofEmiliania huxleyiand
Gephyrocapsagrown in laboratory culture (Supplementary Table 1). Symbols are averages for each experiment and lines show the range of values between replicate culture bottles for each experiment. Scanning electron microscope images of coccospheres from the strains with lowest (RCC
1257,b), intermediate (RCC 3370,c) and highest (RCC 1292,d) coccolith
thickness. Scale bar, 2mm (in all images). (e–g)Three-dimensional
representations of coccolith thickness for the same strains as coccospheres. The vertical scale shows cumulative thickness from zero at the base;
therefore in the central area ofGephyrocapsacoccoliths, the bridge (central
area bar) is displaced towards the base of the plane of illustration.
calcification continues in large cells from 6 to 4 Myr ago, as indicated by decreasing ecoccolith during this interval, despite a
stable trend in mean coccolith size. Although we cannot resolve changes in the degree of calcification of large coccoliths in this study (see Methods), theecoccolithtrend suggests that in large cells,
the change in HCO3 allocation to calcification was of greater
magnitude than any concurrent decrease in calcification that may have occurred. This significant reduced allocation to calcification in large cells drove a divergence in the range of vital effects among small and large coccoliths after 8 Myr ago (Fig. 5a), similar to the results from Caribbean ODP Site 999 (ref. 14).
Small coccoliths show evidence for decreased HCO3
allocation to calcification only since 6 Myr ago. From 11 to 6 Myr ago, ecoccolith and SN coccolith thickness are relatively
stable (Fig. 5b,c), suggesting minimal changes in HCO3
allocation to calcification. In contrast, between 6 and 1 Myr ago, a near-constant ecoccolith indicates a stable ratio of HCO3
allocation to the coccolith vesicle relative to calcification rate, despite a large decrease in degree of calcification (Figs 4 and 5c). This implies a decrease in HCO3 allocation to calcification of
comparable magnitude to the decrease in cellular calcification. In the last 1 Myr, an increase in degree of calcification in the small coccoliths with no change inecoccolithsuggests that allocation of
HCO3 to calcification also increased in parallel.
Relationship between calcification and ocean stratification. Water column stratification influences productivity and production depth in the tropics. Stratification can be inferred from foraminiferal d18O gradients between the upper mixed
1 2 3 4 5 6 7 8 9
1 2 3 4 5 6 7 8 9 10 11
15 14 13 12 11 10 9 8 7 6 5 4 3 2 1 0
Age (Myr ago)
1 2 3 4 5
2.6 Myr ago
5.3 Myr ago
11.6 Myr ago
a b c d e
ODP site 925 NGHP-01-01A
Benthic δ18O (‰ VPDB) Coccolith length (μm)
Coccolith length (μm)
Reticulofenestra
> 5
μm
Reticulofenestra
< 5
μm
Gephyrocapsa
> 3.5
μm
Gephyrocapsa
< 3.5
μm
Pseudoemiliania
Pleistocene
Pliocene
Late Miocene
Middle Miocene
Large northern hemisphere ice sheets
Large array of coccolith vital effects
Global cooling and increased ice volume
Figure 3 | Long-term evolution of Noe¨laerhabdaceae coccolith size and stable isotope vital effects with climate over the last 14 Myr.
(a) Noe¨laerhabdaceae coccolith size distributions over time at Sites ODP 925 (grey) and NGHP-01-01A (blue). (b) Climate evolution over the Neogene
represented by a benthic foraminiferald18O stack (data compiled by ref. 86). (c) Onset of major northern hemisphere glaciation atB2.6 Myr ago. (d) The
emergence of large scale vital effects in thed18O andd13C of coccolith calcite around 7–5 Myr ago (ref. 14; this study). (e) Approximate age ranges of
layer (Globigerinoides sacculifer) and thermocline (Globorotalia menardii), because these reflect the upper photic zone tempera-ture and salinity gradients24. The temporal evolution of planktic foraminiferal d18O at Sites ODP 925 and NGHP-01-01A is shown in Fig. 6. Between 3.5 and 2 Myr ago, a deep thermocline at Site 925 is inferred from independent foraminiferal assemblage indicators25, potentially suggesting a deeper coccolithophore depth habitat and lower light levels. Decreased light has been shown to reduce cellular calcification (PIC/SA) twofold by a reduction in photon flux density from 80 to 15mmol m2s1in culture26, and low light levels have been
proposed to decrease cellular HCO3 transport27. However,
neither site shows a clear decrease ind18O gradients at this time (Fig. 6a,b), as would be expected if reduced coccolith calcification from 4 to 1 Myr ago were due to a deepening of the thermocline, resulting in a reduced temperature gradient between the two foraminifer species’ depth habitats. Proxy records suggest high productivity from 10 to 8 Myr ago in the Indian Ocean28and from 6.6 to 6 Myr ago at ODP Site 925 (ref. 29). Thus, reconstructed changes in water column structure and paleoproductivity do not consistently co-vary with changes in degree of coccolith calcification.
0 0.4 0.8 1.2 1.6
Thickness (
μ
m)
0 0.4 0.8 1.2
Thickness (
μ
m)
0 0.2 0.4 0.6 0.8
Thickness (
μ
m)
0 0.2 0.4 0.6 0.8 0 0.2 0.4 0.6 0 0.1 0.2 0.3 0.4 0.5
Mean coccolith thickness Size-norm. mean coccolith thickness
0 2 4 6 8 10 12 14
0 100
0 2 4 6 8 10 12 14
0 100
0 2 4 6 8 10 12 14
0 100
Gephyrocapsa spp.
Reticulofenestra spp.
Pseudoemiliania spp.
Retic. closed central area
0 2 4 6 8 10 12 14
0 100
0 2 4 6 8 10 12 14
0 100
0 2 4 6 8 10 12 14
0 100
Site NGHP-01-01A ODP Site 925
b 3–4 μm
a 2–3 μm
c 4–5 μm
f 3–4 μm
e
2–3 μm
g
4–5 μm
d 2–5 μm h 2–5 μm
0 2 4 6 8 10 12 14
Age (Myr ago) 0
0.03 0.06 0.12 0.15
ks
value
0 2 4 6 8 10 12 14
Age (Myr ago)
Calculated shape factor (k
s value)
G. oceanica ks value
E. huxleyi (type B and A normal) k
s value
0 0.02 0.04 0.06 0.08
Rel. %
Rel. %
Rel. %
Figure 4 | Changes in Noe¨laerhabdaceae coccolith thickness andksvalue at two tropical sites since 14 Myr ago.(a–d) Site NGHP-01-01A, and (e–h)
ODP Site 925. (a–c,e–g) Thickness data for coccoliths of 2–3, 3–4 and 4–5mm length. Box–Whisker plots illustrate coccolith thickness data for each sample
and size class (box shows median value and upper/lower quartiles, whiskers show maximum and minimum values, outliers41.5 the interquartile range
are shown as crosses). Also shown are mean values of raw (circles) and SN (diamonds) thickness (Supplementary Data 1). Bar graphs show the relative
contribution of different genera to the Noe¨laerhabdaceae population in each size class and sample. (d,h)ksvalues (error bars are±2 s.e.m.). The shape
factorks, which expresses the fraction of the volume of a cube defined by the length of a coccolith that is composed of biomineral77, was originally
proposed to estimate coccolith mass from coccolith length and is similar to coccolith thickness. However, unlike thickness,ksdoes not account for
variations in coccolith circularity. Pink symbols areksfor extant Noe¨laerhabdaceae species77.
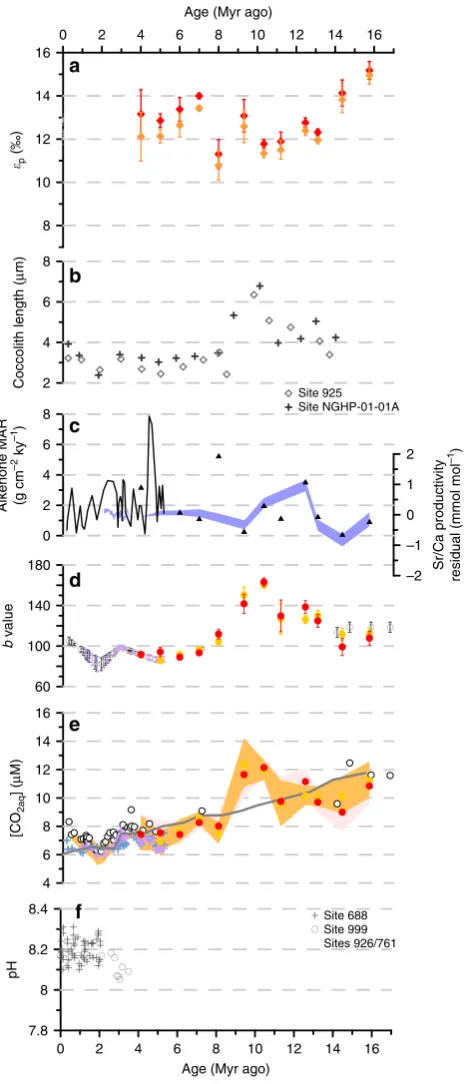
Calcification and [CO2aq] in the Miocene–Pliocene. Carbon
isotopic fractionation in phytoplankton during photosynthesis (ep) varies directly with [CO2aq] and has been widely applied as a
CO2proxy in the Cenozoic. However, limited data exist for the
interval of major changes in calcification and HCO3 allocation
between 14 and 5 Myr ago. In addition, the interpretation of any data is complex because of the expected influence of active HCO3 allocation onep(ref. 14). Our new record ofepextends
the published record from ODP Site 999 for the last 5 Myr30back to 16 Myr ago (Fig. 7a). This extended record reveals a decrease in
ep from 16 to 8 Myr ago, an excursion to higher
epvalues at 7 Myr ago, and then a continued decrease towards
the present. The decline in ep could be driven by decreasing
[CO2aq], increasing cellular growth rates that increase carbon
demand relative to supply, or increasing cell sizes that reduce surface area to volume and thus diffusive supply (see ref. 31 and references therein). Following previous workers, [CO2aq] is
estimated with the formula [CO2aq]¼b/(efep), where ef is a
constant reflecting the maximum effective photosynthetic fractionation by the cell (25%), and ‘b’ encompasses factors such as growth rate and cell geometry that modulate the ratio of carbon supply to demand by the cell. First, to estimate temporal variations in bdue to cell size, we use previous formulations of the relationship between cell size and b32, together with our record of tropical Noe¨laerhabdaceae coccolith size evolution (Fig. 7b), which shows trends similar to those at other tropical sites22,23. The decrease in cell size after 9 Myr ago, compared with the average between 11 and 16 Myr ago, corresponds to a 25% reduction in the b value. Second, we estimate the influence of productivity on b using proxy records from ODP Site 999 of coccolith Sr/Ca and alkenone mass accumulation rates (Fig. 7c). These records confirm that there is no long-term productivity increase, and suggest maxima from 13 to 10 Myr ago and at 8 Myr ago. Calculatedbvalues are shown in Fig. 7d. The resulting estimates of [CO2aq] (Fig. 7e) show a trend of continued decline
over the past 16 Myr, with the exception of a local maximum at 9.3–10.3 Myr ago resulting from the unusually large cell sizes in
0 2 4 6 8 10 12 14 16
Age (Myr ago)
0 0.2 0.4 0.81
Size-normalized thickness (
μ
m) –3
–2 –1 0 –3
–2 –1 0
ODP 925 NGHP-01-01A <3 μm 3–5 μm 5–8 μm 8–10 μm
Small coccos Large coccos
0 2 4 6 8 10 12 14 16
Age (Myr ago)
c b
a ODP 925
εCoccolith
(‰ VPDB)
Coccolith
δ
13C (‰
VPDB)
Figure 5 | Coccolith geochemistry and SN thickness trends since the Miocene.(a)d13C values for size-separated coccoliths from ODP Site 925,
normalized to the smallest coccolith size fraction. (b)ecoccolithfor small
(3–5mm) and large (8–10mm) coccoliths from Site 925. Shading indicates
propagated analytical uncertainty ond13C measurements. (c) mean SN
coccolith thickness for Noe¨laerhabdaceae coccoliths of 2–5mm lengths at
ODP Site 925 and Site NGHP-01-01A (coccolith thicknesses are normalized
to mean coccolith length within the 2–5-mm size fraction over the whole
time series at each site, that is, 3.52 and 3.93mm, respectively).
5 3 1 –1 5 3 1 –1
0 2 4 6 8 10 12 14
2 1 0 –1 –2 –3
Planktic foram
δ
18O (‰ VPDB)
Planktic foram
δ
18O (‰ VPDB)
Benthic foram
δ
18O (‰ VPDB)
Benthic foram
δ
18
O (‰ VPDB)
Foram
δ
13
C (‰ VPDB)
Foram
δ
13C (‰ VPDB)
2 1 0 –1 –2 –3
0 2 4 6 8 10 12 14
Age (Myr ago) G. sacculifer G. menardii Benthic (compilation) Site NGHP-01-01A
ODP Site 925
0 2 4 6 8 10 12 14
–1 0 1 2 3
–1 0 1 2 3
0 2 4 6 8 10 12 14
Age (Myr ago)
d c
b a
Figure 6 | Foraminiferal stable isotope records as indicators of water column structure.d18O (a,b) andd13C (c,d) records for surface (G. sacculifer),
thermocline (G. menardii) and benthic species at Sites ODP 925 and NGHP-01-01A. Benthic isotope data for our sites are not available, therefore values were
interpolated using a global compilation86separated into ocean basins. Because Neogene Indian Ocean data are sparse and trends are very similar to those in the
Pacific, a compilation of Indian and Pacific Ocean data were used to interpolate the benthic values inaandc. Forbandd, a compilation of all Atlantic data was
the geometry correction. Assuming equilibrium with the atmosphere, these results are similar in trend and magnitude to [CO2aq] predicted from the atmospheric pCO2 curve of ref. 33
derived from inverse modelling of climate data (Fig. 7e). The absolute values of [CO2aq] are subject to greater uncertainty than
the trend.
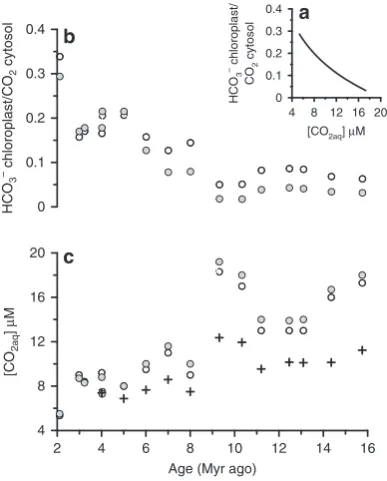
As in previous studies30, our calculations would not account for the likely increase in active carbon uptake for photosynthesis as [CO2aq] declined14,34, especially after 8 Myr ago. Because active
carbon transport increases the chloroplast uptake of inorganic carbon relative to fixation, it can result in higher epvalues than
would be predicted from passive diffusive CO2 uptake alone35.
Laboratory culture experiments suggest that active HCO3
transport to the chloroplast becomes more significant at low [CO2aq]. Simulations with the ACTI-CO model of HCO3
transport in coccolithophores14 were used to evaluate the potential impact of changes in active carbon uptake on epand
calculated [CO2aq] (Supplementary Methods; Fig. 8). In one set of
simulations, we specify a logarithmic dependence of chloroplast HCO3transport/diffusive CO2uptake on [CO2aq] as observed in
culture experiments14,27. Alternatively, if enhancement of HCO3
transport to the chloroplast is coupled, in part, to reallocation of HCO3 from the coccolith vesicle, as inferred from modelling
of cultures14, our new ecoccolith and SN coccolith thickness
data put additional constraints on the timing of this reallo-cation. Therefore in a second set of simulations, we specify chloroplast HCO3 transport based on HCO3 spared from the
coccolith vesicle by the reduction in cellular calcite in the last 8 Myr. We then derive the [CO2aq] implied by measuredepfor the
specified parameterization of active HCO3 uptake to the
chloroplast. The results in both cases indicate a greater amplitude of decline in [CO2aq] compared with that
reconstructed with standard cell size and growth rate considerations only, from around 17 to 6mM (Fig. 8).
Calcification in relation to CO2and alkalinity since 1 Myr ago.
In the last 1 Myr, climate, the carbon cycle and ocean chemistry
8 10 12 14 16
Site 925 Site NGHP-01-01A
2 4 6 8
Coccolith length (
μ
m)
4 6 8 10 12 14 16
[CO
2aq
] (
μ
M)
60 100 140 180
b
value
0 2 4 6 8 10 12 14 16
Age (Myr ago)
–2 –1 0 1 2
Sr/Ca productivity
residual (mmol mol
–1
)
0 2 4 6 8
Alkenone MAR (g cm
–2 ky
–1
)
a
c b
e d
f
0 2 4 6 8 10 12 14 16
Age (Myr ago) 7.8
8 8.2 8.4
pH
Site 688 Site 999 Sites 926/761
p
(‰)
Figure 7 |epvalues and estimates ofband [CO2aq] at Caribbean ODP
Site 999 and other sites for the last 17 Myr.(a) Newepdata (Site 999, red
diamonds: SST max, orange diamonds: SST min; error bars show propagated
analytical uncertainty ond13C measurements). Publishedeprecords: Site
999 (ref. 30) (purple crosses), ODP Site 925 (ref. 37) (grey circles), DSDP
Sites 588 (ref. 84) (grey triangles, maximumep) and 608 (ref. 84) (blue
squares). (d) Variations inb(Site 999) inferred to arise from changing cell
size (b) and growth rate (c) (see Methods). Inc, triangles (this study) and
line30show alkenone MARs and blue shading shows Sr/Ca productivity
estimates for small coccolithophores14(all Site 999). Ind, purple crosses
(Site 999 (ref. 30)), grey circles (Site 925 (ref. 37)), and orange circles
(Site 999, this study) showbvalues recalculated using our new cell size
correction. Red circles (Site 999, this study) showbvalues calculated with
cell size and growth rate corrections. For error calculations, see Methods.
(e) [CO2aq] calculated using cell size (orange circles), or cell size plus
growth rate (red circles), correction andepvalues (Site 999, this study).
[CO2aq] was also recalculated using our cell size correction for the
Plio-Pleistocene at Site 999 (ref. 30) (purple crosses) and Site 925 (ref. 37)
(grey circles). For all sites, referenceb¼150. [CO2aq] assuming constantb
for Site 999 (ref. 30) is also shown (blue crosses). Shading indicates
maximum and minimum [CO2aq] estimates for all data from Site 999 (see
Supplementary Methods). We do not apply our size correction to DSDP
Sites 608 and 588epdata because these sites are at significantly higher
latitudes; therefore cell size history may be different compared with the
tropical sites studied here. Also shown ineis the [CO2aq] expected for the
Caribbean site if it were in equilibrium with the atmosphericpCO2modelled
by ref. 33 (grey line). (f) pH derived fromd11B of planktic foraminifers, for
the Plio-Pleistocene30,36and Miocene53. During the Miocene, ODP Site
999epvalues are similar to values at ODP Site 925 (ref. 37) and higher than
values from DSDP Sites 588 and 608 (ref. 85). From 16 to 9 Myr ago, the
maximumepat DSDP Site 608 shows a similar trend toepat ODP Site 999,
albeit with slightly lower absolute values, suggesting that either both sites
experienced similar changes in growth rates, or that a global CO2
component exerted a dominant forcing on botheprecords. The temporally
variable scatter to lowepvalues seen in the Site 608 record may result from
higher frequency oscillations in growth rates at this site83. The much lower
averageepat Site 588 suggest that this site experienced on average higher
phytoplankton growth rates and productivity compared to Sites 925, 999 and 608.
underwent significantly higher amplitude variations on glacial– interglacial timescales compared with the preceding 15 Myr. Although our sampling resolution does not capture this higher frequency variability, and does not sample very recent major evolutionary events such as the emergence of E. huxleyi, our results nonetheless suggest in the Pleistocene a reversal of the late Miocene–Pliocene trend of more lightly calcified coccoliths and decreasing HCO3 allocation to the coccolith vesicle. Within the
last 1 Myr, both of these factors rebound to values typical of the late Miocene (Fig. 5). Records based on boron isotopes36, alkenoned13C (refs 30,37), and ice cores38suggestpCO2values
below around 280 p.p.m. over the last 2 Myr, so this increase in degree of calcification contrasts with the generally positive correlation of [CO2aq] and degree of calcification observed over
the preceding interval.
The change in relationship between degree of coccolith calcification and [CO2aq] is even more salient when we examine
which samples fall in glacial or interglacial ocean states. Planktic foraminiferal d18O values from samples at Indian Ocean Site NGHP-01-01A and the orbital age model for Atlantic ODP Site 925 indicate that our youngest samples at both sites (about 0.27 Myr ago), with high SN coccolith thickness, coincide with glacial periods (Supplementary Fig. 6). The sample at 0.84 Myr ago from Site NGHP-01-01A with high SN coccolith thickness also falls during a glacial period, whereas the sample at 0.95 Myr ago from the Site 925, with lower SN coccolith thickness, falls in an interglacial. These particular sampling points therefore under-score the nature of a change in the relationship between degree of calcification andpCO2, as the samples with thicker coccoliths in a
given size class are from glacial periods that coincide withpCO2
minima in the last 800 kyr (Supplementary Fig. 6).
In the absence of a coherent relationship with [CO2aq], we
consider whether a change in ocean alkalinity may have increased cellular HCO3 uptake and reduced competition for intracellular
HCO3, promoting the recovery of degree of coccolith
calcifica-tion and HCO3 allocation to calcification. No proxy record of
alkalinity change has yet been produced for this time interval. Multiple lines of evidence based on geochemistry, sedimentology and modelling suggest that the rate of silicate weathering, which adds alkalinity to the ocean, accelerated around 1.5 Myr ago as the North American Precambrian basement shed regolith and experienced more intense subglacial erosion39. At the same time the first large amplitude sea level cycles accelerated erosion of shelf sediments40. Estimates of alkalinity from carbon system proxies are subject to multiple uncertainties. To explore the magnitude of alkalinity change that might be possible, we compared pH estimates from boron isotopes in planktic foraminifers with estimates of ocean [CO2aq] calculated from
the cycles of atmosphericpCO2recorded in ice cores. While not
diagnostic, this analysis suggests the potential for an increase in alkalinity by up to 30% during successive glacials of the last 1.5 Myr (Supplementary Methods; Supplementary Fig. 6). Such an increase would contrast with relatively stable alkalinity inferred for the previous 14 Myr from analysis of the carbonate compensation depth41, although such estimates are also subject to multiple uncertainties (Supplementary Fig. 7).
Discussion
Over the past 14 Myr, selective pressure has acted on the large diversity of different degrees of calcification and morphotypes found in natural coccolithophore populations15,42–46, modifying in a similar way in the tropical Atlantic and Indian Oceans the composition of the population towards better-adapted forms. A similar selective pressure has been suggested for natural populations on seasonal timescales, modulating the relative contribution of different E. huxleyi morphotypes with specific degrees of calcification46. Long-term mono- and multi-clonal experiments also reveal genotypic selection, as well as beneficial new mutations, as a mechanism for adaptive evolution11. Such coccolithophore species or morphotype shifts as a result of ocean changes in the future will arguably have a greater impact on carbon cycle feedbacks than direct physiological responses, highlighting the importance of studying integrated community calcification as well as species- or clone-specific responses47,48.
The similar long-term decreases in degree of coccolith calcification at our Atlantic and Indian Ocean sites suggest a common selective pressure. This trend in calcification occurs alongside reduced HCO3allocation to the coccolith vesicle. The
lack of a coherent relationship between stratification and productivity and SN coccolith thickness at both sites suggest that these factors are not strong candidates to force the common trends in degree of calcification at both sites. In contrast, while the relationship between [CO2aq] and cellular calcification has
been ambiguous in clonal cell cultures49–51, decreasing [CO2aq] is
one factor shown to reduce HCO3 allocation to calcification in
modern cells14. Changes in [CO2aq] are expected to be globally
synchronous across the stratified tropical oceans. While the magnitude of [CO2aq] decline is sensitive to the inferences about
active carbon uptake by algae and detailed steps in [CO2aq]
cannot be reliably identified given the resolution of our record, a progressive [CO2aq] decline since the middle Miocene is evident
and correlates with a succession of adaptations in coccolithophore calcification and cell size. A decline in cell size and the first evidence for reduced allocation of HCO3 to calcification
4 8 12 16 20
[CO2aq] μM 0
0.1 0.2 0.3 0.4
HCO
3
– chloroplast/
CO
2
cytosol
2 4 6 8 10 12 14 16
Age (Myr ago) 4
8 12 16 20
[CO
2aq
]
μ
M
0 0.1 0.2 0.3 0.4
HCO
3
– chloroplast/CO
2
cytosol
a b
c
Figure 8 | Simulations of the effect of active HCO3 uptake on
reconstructed [CO2aq].ACTI-CO model simulation for two potential
scenarios of active HCO3uptake to the chloroplast (b), and consequences
for [CO2aq] implied by alkenoneepmeasurements (c). A first simulation
(unfilled circles) employs a logarithmic dependence of HCO3 transport to
the chloroplast on [CO2aq], similar to that observed in cultures (a). A
second simulation (filled circles) supplements HCO3 supply to the
chloroplast as a function of HCO3spared from the coccolith vesicle by the
production of thinner coccoliths (that is, a reduced PIC per cell surface
area). Crosses incshow [CO2aq] estimated from standard regressions
(decreasingecoccolith) in the larger coccolithophores occurs several
million years before the reduced allocation of HCO3 to
calcification and reduced cellular calcification in small cells. The factors driving this differential timing and type of response between the smaller and larger coccolithophores are at this time uncertain but might include lesser plasticity of coccolith thickness in larger genera (Helicosphaera,CoccolithusandCalcidiscus), or a much stronger pressure for HCO3 reallocation by larger cells
whose diffusive CO2supply was more limited by their low surface
area to volume ratio. While decreasing coccolith size has been suggested as one adaptation to decreasing CO2 availability12,52,
changes in coccolith size, like changes in degree of calcification or changes in the allocation of available carbon to calcification, appear to be part of an array of possible adaptations that may be used simultaneously or sequentially. These strategies appear to be used to varying degrees in different cell size classes, potentially with different thresholds, as each adaptation may come with its own trade-offs. In addition to varying resource availability documented by geochemical indicators, ‘top down’ ecological pressures may contribute to changes in coccolithophore calcification, but unfortunately no proxies are yet available to evaluate their significance in the geological past.
Here, we show a new approach to exploiting independent geochemical and morphological records of coccolithophores to explore the effect of changing cellular HCO3 allocation on the
magnitude of [CO2aq] change inferred from ep. This approach
significantly increases the magnitude of inferred [CO2aq] decline
over the last 16 Myr, a result that if substantiated by future high-resolution work, would have important implications for our understanding of climate sensitivity.
The coincidence of greatest SN coccolith thickness and inferred degree of cell-calcification with the period of highest [CO2aq] in the Miocene is at odds with hypotheses for
less-calcified cells under future ocean acidification15,20,48. Similar to future scenarios, proxy records of past pH derived from boron isotopes in planktic foraminifer shells suggest that high Miocene [CO2aq] coincided with lower surface ocean pH compared with
the Pleistocene (Fig. 7f)30,53. Although extracellular pH may influence the ease with which protons produced during calcification are exported from coccolithophore cells54, and in some culture experiments low pH reduces cellular Particulate Inorganic Carbon (PIC) to Particulate Organic Carbon (POC) ratio and increases the incidence of coccolith malformation (refs 6,8,55–57 but also see refs 7,58), the limited phenotypic plasticity of short (o20 generations) monoclonal experiments complicates their extrapolation to real-ocean responses.
Consistent with the long-term responses to high [CO2aq]
and low pH since the Mocene shown here, a recent study in the Bay of Biscay found a dominance of heavily calcified E. huxleyimorphotypes during winter when [CO2aq] was highest
and pH and CaCO3 saturation were lowest46 (Supplementary
Fig. 8). In this study, the low winter calcite saturation state was driven primarily by an increase in dissolved inorganic carbon concentration and, to a minor extent, by reduced temperatures. However, preliminary results for the last 1 Myr suggest that at late Pleistocene [CO2aq] levels, increased alkalinity may have favoured
a higher degree of cell calcification, consistent with culture experiments at constant [CO2], in which increased calcification in
E. huxleyi accompanied increased alkalinity6 (Supplementary Fig. 9). A better understanding of the evolution of ocean alkalinity and [HCO3] over the last 1.5 Myr as well as higher-resolution
coccolith records may help disentangle the interplay of alkalinity and [CO2aq] on coccolithophore calcification. In addition, further
studies with natural populations are required to establish whether [CO2aq] in the modern ocean is a significant driver of cellular
calcification.
The long-term reduction in degree of cell-calcification between 14 and 1 Myr ago could potentially have influenced ocean biogeochemical cycles, if a reduction in coccolith ballast lowered the transfer efficiency of organic carbon to the deep ocean. The reduction in cell calcification we identify is coherent with a recent study documenting a global crash in coccolith CaCO3 burial
around 4 Myr ago59. One consequence of reduced transfer efficiency would be a shallower mean remineralization depth of organic matter. However, d13C gradients between surface and thermocline-dwelling foraminifers decrease in par with coccolith thickness from 6 to 4 Myr ago, a change driven primarily by the convergence of thermocline d13C values towards surface values (Fig. 6c,d), and suggestive of a deeper depth of organic matter remineralization in the upper water column60,61. This trend suggests that the effect of global cooling, which acts to slow remineralization rates, overrode any effect of reduced ballasting and led to a deepening of mean remineralization depth during the late Miocene60. If future global warming likewise leads to a shoaling of mean remineralization depth, it may act to counteract any shift towards enhanced ballasting by more heavily calcified coccolithophore cells.
In summary, our observations suggest that on long timescales, increased [CO2aq] and increased alkalinity may contribute
selective pressures favouring thicker coccoliths of a given size and a higher degree of cell-calcification. As projected changes in surface ocean chemistry simulate increased [CO2aq] but
diminished alkalinity, prediction of the sign of calcification will rely on better defining the thresholds of response to each parameter. In addition, it remains to be determined whether coccolithophore responses to rapid ocean chemistry changes in the future will be analogous to the geological-timescale adaptation studied here. The plasticity of coccolith thickness and potential selective pressures in the genetically diverse modern ocean thus warrant further investigation.
Methods
Cellular calcification and thickness in culture.Eight clonal strains ofE. huxleyi
andGephyrocapsa(Supplementary Table 1) were maintained as dilute batch cultures in natural seawater from the Cantabrian Sea (Northern Spain). Prior to
experiments, seawater was sterile filtered at 0.2mm, heated to 80°C for 3 h, cooled
overnight in a sterile hood, and pH was adjusted to 8.3 by addition of NaOH. Media was enriched with major nutrients (P, N), trace metals and vitamins
according to the K/2 recipe62modified by eliminating the Tris buffer and silicate.
Media was then sterile filtered at 0.2mm just prior to inoculation. Experiments were
carried out under a light:dark cycle of 16:8 h at a constant temperature of 16°C
under saturated light growth conditions (80–150mmol m2s1photon flux).
A homogeneous distribution of cells was maintained by placing the cultures on a roller system providing gentle rotation during growth. Through serial dilution, cells were maintained in dilute cultures for 8–12 generations before sampling, to establish stable nutrient and carbon chemistry in the media. Each strain was grown in duplicate, and in some cases triplicate, culture bottles. One strain was cultured in two separate experiments and each experiment is reported separately because the two experiments had opposite trends of drift in pH. On collection, media pH and total alkalinity were measured with a Crison GLP-21pH metre calibrated with National Bureau of Standards (NBS) buffers and quadruplicate potentiometric titration of filtered, poisoned media samples on a Crison TitroMatic 1S,
respectively63,64. Average media alkalinity was 2,572mmol kg1(±115, 1 s.d.),
pH 8.22 (±0.07, 1 s.d.) with drift in pH during experiments ofo0.11 pH units.
Cell density was maintained at biomass averaging 1.65mg C ml1and in all
caseso2.5mg C ml1. Cell counts were determined at harvest with a
Fuchs–Rosenthal haemocytometer.
For determination of cellular carbon quota, cells were harvested on pre-combusted GF/F or QFF filters. Following acidification to remove calcite, they were analysed for carbon content by flash combustion EA (Euro Vector EA-1108) at
1,020°C coupled with a Nu Instruments mass-spectrometer (Nu-Horizon). For
determination of cellular calcite, cells were harvested on polycarbonate filters.
Filters were acidified in 2% HNO3and Ca concentration was measured in the
resultant solutions by ICP-AES (Thermo ICAP DUO 6300).
Cell size (radius) and cell surface area (SA) were derived from measurements of
cellular carbon quota using the regression of Poppet al.65, which is similar to those
derived from other studies66,67. We use PIC/SA as an optimal way to represent
calcification across a range of cell sizes, because it is unaffected by the size scaling of
surface area/volume (SA/V). The PIC/POC ratio is often used to describe the degree of calcification per cell, but scales with SA/V, which is dependent on cell size. In published culture studies, at the onset of the photoperiod and just after division, when cell size is smallest and SA/V is highest, the PIC/POC ratio is 30–36% higher whereas PIC normalized to cell surface area is only 10–12%
higher68. For a given strain of coccolithophore, this inverse correlation between cell
size and PIC/POC ratio is widespread in published culture studies (Supplementary Fig. 10) because of the large plasticity of cell size in response to changes in light regime, carbonate system parameters, and temperature. In our culture samples, because of the limited range in cell size, and larger range in coccolith morphology across different strains, both PIC/SA and PIC/POC yield similar results (Supplementary Fig. 1, Supplementary Table 2).
For determination of coccolith mass and thickness, cells were collected on polycarbonate filters. Coccoliths were extracted from the filters by addition of 0.5 ml ethanol with gentle ultrasonication, and evaporation of the ethanol suspension on a glass microscope slide. This ensured that coccoliths were in a single plane of focus for polarized microscopy. A total of 25–55 random fields of view (FOV) were imaged from microscope slides using a Nikon DS-Fi1 8-bit colour digital camera, Nis-Elements software and a Nikon Eclipse LV100 POL polarized
light microscope equipped with a 100 H/N2 objective set-up with circular
polarization at Salamanca University (resultant area of one pixel¼0.035mm2).
For full details of the circular polarization microscope set-up applied in this study, see ref. 69. The measurement of coccolith thickness from birefringence relies on the systematic relationship between the thickness of a calcite particle and the
interference colour that it displays under polarized light69–71. In the thickness
range 0–1.55mm, calcite particles show first-order polarization colours ranging
from black to white. Calcite particles thicker than 1.55mm display first-order
polarization colours ranging from yellow through to pink up to a thickness of
4.5mm, beyond which second-order colours are observed71. For culture samples,
we use a calibration based on a calcite wedge of known thickness to convert grey
level to thickness. Images were processed with C-Calcita69. All coccoliths were
analysed with a minimum of 100 per sample, and coccolith length, width and area were measured.
Sites and age models.Fifteen samples spanning the last 14 Myr ago were selected from two low-latitude sites to investigate the evolution of coccolith calcification:
ODP Site 925 in the western tropical Atlantic Ocean (4°12.2480N, 43°29.3490W,
water depth 2041 m) and Site NGHP-01-01A in the eastern Arabian Sea
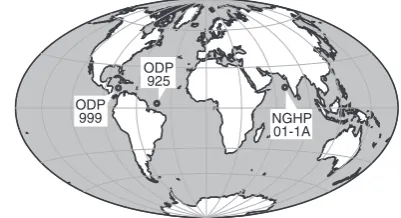
(Kerala–Konkan Basin, 15°18.3660N, 070°54.1920E, water depth 2663 m; Fig. 1).
Late Neogene sedimentary sections at both sites are primarily calcareous ooze, and sites were selected on the basis of their good coccolith preservation. The age model
for Site NGHP-01-01A is based on calcareous nannofossil biostratigraphy72,
and ODP Site 925 ages are based on astronomical calibration of shipboard physical property data (ref. 73; S.J. Crowhurst and H. Pa¨like, personal communication, 2013).
Coccolith mass and size measurements in sediments.Microscope slides for image analysis were prepared using a quantitative decantation method producing a
homogenous distribution of coccoliths74. A total of 20–50 random FOV were
imaged as described above for cultures. Microscope light settings and camera parameters were kept constant during each imaging session, and calibration images
of the same set of calcite particles (the sameRhabdosphaeracoccoliths in our
youngest ODP Site 925 Pleistocene sample) were taken at the start of each session to account for bulb ageing and the different light requirements for different sample groups. Because the method applied here uses grey scale images to estimate
coccolith thickness, it is only applicable to coccoliths thinner than 1.55mm. In the
late Miocene, some large Noe¨laerhabdaceae coccoliths display yellow or orange first-order interference colours. For this reason, although size data are presented for all Noe¨laerhabdaceae coccoliths present in our samples (Fig. 3), we present only
mass and thickness measurements for coccoliths in the length range 2–5mm, which
exhibit only grey scale colours throughout the time series (Fig. 4). All whole Noe¨laerhabdaceae coccoliths were analysed with a minimum of 300 per sample. Coccolith length, width and area were also measured. Coccolith mass values in this study are comparable to published data using similar birefringence-based methods (Supplementary Fig. 11). To isolate the component of variation in coccolith thickness that represents a change in calcification and does not occur as a direct result of changes in coccolith size, we (1) examine changes in thickness
within narrow size classes (2–3, 3–4 and 4–5mm), and (2) calculate SN thickness
of coccoliths within each size classes to further verify that changes in thickness are not a direct result of size changes (that is, the expectation that a larger coccolith is thicker as a result of isometric scaling). Following ref. 75, we use the equation:
SN thickness¼½ðMLCLÞS þCT; ð1Þ
where ML is the mean coccolith length within the size fraction in question over the whole time series at a given site (see Supplementary Data 1 for values used), CL is
the length of coccolith X in Sample A,Sis the slope of the regression between
coccolith length and coccolith thickness for all coccoliths in Sample A and CT is the original thickness of coccolith X in Sample A.
Coccolith taxonomy and preservation.We identified coccoliths to genus level only because species-level classification of the smallest Noe¨laerhabdaceae can be
difficult under the light microscope, and because commonly usedReticulofenestra
species assignations are primarily based on size76. Although most coccoliths were
complete, some were found to be missing a piece of the outer rim cycle of one or both shields when observed under the SEM. To verify that such fragmentation did not result in underestimation of coccolith mass per unit area, we quantify this
potential effect from SEM images of the 2–5mm fraction of fossil samples and
estimated the percentage of mass loss for individual Noe¨laerhabdaceae coccoliths due to fragmentation (minimum 50 coccoliths per sample) using C-Calcita. In these calculations, we assumed that 50% of the total mass of each coccolith comes from the inner rim cycle and central area structure (bridge and/or grill), and that the outer rim cycle of each shield contributed 25% of the total mass. These assumptions were based on mass analyses of very well-preserved modern water
column samples containing a mixture ofGephyrocapsaandE. huxleyicoccoliths. In
these samples, mean contribution of inner rim plus central area to total mass was
63±10% (1 s.d.), therefore our choice of 50% for fossil Noe¨laerhabdaceae
calculations is conservative.
Coccolith dimensions are used to infer cell size, based on relationships between
coccolith length and cell size for Noelaerhabdaceae13,52. On this basis, we attribute
geochemical results from large coccoliths (8–10mm) as those characterizing larger
cells, and those of smaller coccoliths (3–5mm) as those characterizing small cells.
ksvalues (originally devised to estimate mass from coccolith shape), were
calculated from fossil coccolith mass and length data using the equation of ref. 77:
ks¼mass=2:71length3
ð2Þ
We verify that temporal patterns in Noe¨laerhabdaceae coccolith mass and thickness result only from primary biomineralization and not from abiogenic post-depositional overgrowth using qualitative preservation indices and SEM images (see Results, Supplementary Data 1; Supplementary Figs 4 and 5).
Noe¨laerhabdaceae with a closed central area occur in some samples older than 10 Myr ago at both sites, and because of the presence of some overgrowth near the central area in some specimens, we remain cautious in always identifying this as a
primary morphological feature. Almost allReticulofenestrain the 2–5mm fraction
of our 14 Myr ago sample at Site NGHP-01-01A have closed central areas and this appears to be a primary feature (Supplementary Fig. 5s,t), resulting in very high
mean SN thickness andksvalues in this sample (Fig. 4).Cyclicargolithuscoccoliths
were seen sporadically in our oldest samples, although these were all45mm.
Assumptions related to coccoliths per cell.Estimation of changing cellular calcite/SA from coccolith thickness requires that cellular calcite/SA be regulated more strongly by coccolith thickness than by the number of coccoliths per cell. Modern Noe¨laerhabdaceae coccolithophore cells are typically covered with a
monolayer comprised of interlocking coccoliths, with the exception ofE. huxleyi
that has a higher tendency to produce multi-layered coccospheres78. The number
of coccoliths per cell has been shown to vary with the cell division cycle of a coccolithophore, with the accumulation of extra coccoliths immediately before cell
division to ensure adequate coverage of the two daughter cells68. Recent work in
culture79has confirmed that stationary phase cells, which are essentially paused in
the stage just prior to cell division due to lack of nutrients, are more often covered with a higher number of coccoliths compared with exponentially growing cells. While natural populations in the ocean contain cells at a variety of life stages, that is, not synchronized in the same way as a culture population, populations of
Coccolithus pelagicusrecovered from the surface ocean during the North Atlantic spring bloom still have on average around 20–25% fewer coccolith per cell than
populations growing in non-bloom conditions, analogous to in culture79. These
differences may be useful in characterizing major swings in productivity in fossil populations, in the rare cases where exceptional preservation conserves a large number of intact coccospheres. Quantification of changes in mean number of coccoliths per cell in fossil populations is not possible in this study because it requires significant numbers of whole coccospheres to be preserved, a phenomenon that is rare in deep, open-ocean sites such as ours (selected to be representative of global change) and on the long timescales at which we are working at a single site. However, in sediment populations such as those in our study, which integrate a time window of a few hundred to a thousand years (taking into account sedimentation rates and bioturbation), seasonal and inter-annual productivity changes that might cause higher representation of one growth phase versus another and concomitant changes in coccoliths per cell are likely averaged out. In addition, export of phytoplankton to the sediments is typically biased towards high production periods, so the significance of true stationary phase growth to export and the sediment population is likely diminished.
Stable isotopes in foraminifers.Isotope data for two planktic foraminiferal species at Sites NGHP-01-01A and ODP Site 925 were generated. Approximately
25 individuals ofG. sacculifer(without sac-like final chamber) andG. menardii
were picked from the 250–350-mm and the 300–400-mm size fractions, respectively.
Foraminifers were broken open and ultrasonicated in methanol to remove fine
fraction contamination, rinsed with MilliQ water, dried at 55°C, and analysed on a
preparation system (Nu Carb), with an analytical precision of 0.06%ford18O and
0.05%ford13C (1s), at Oviedo University.
The variable depth habitats of planktic foraminifers allow us to reconstruct changes in upper water column properties via oxygen and carbon isotopic gradients. In tropical open-ocean settings such as those overlying our two sites,
G. sacculiferis thought to live and calcify in the upper mixed layer of the ocean,
whereasG. menardiifavours the upper-middle thermocline24,25,80,81. To a first
order, foraminiferald18O gradients between the upper mixed layer and
thermocline in well-stratified regions of the tropical ocean reflect the upper photic
zone temperature and salinity gradients24, although some additional physiological
(vital effects) and environmental (for example, carbonate ion concentration) factors
also affect isotopic fractionation81. Foraminiferald13C gradients between the upper
mixed layer, the thermocline and the deep ocean at both sites were used to evaluate the depth of organic matter remineralisation, following refs 60,61. Planktic
foraminiferald13C values were corrected to dissolved inorganic carbon (DIC)
following ref. 81.
Stable isotopes in coccoliths.Samples were disaggregated and micro-filtered in
2% ammonia to separate coccolith size fractions (o3, 3–5, 5–8 and 8–10mm),
which were rinsed three times with MilliQ water and dried at 55°C. All
coccolith fractions were examined under the microscope, and fractions from Site NGHP-01-01A were found to be heavily contaminated with fragments of non-coccolith carbonate. For this reason, isotope data for these samples are not presented or considered further. At ODP Site 925, coccolith size fractions contain solely coccolith carbonate. In samples older than 3 Myr ago, coccolith fragments
contribute significantly to theo3mm fraction so data points were excluded.
Coccolith samples were analysed as described above for foraminifers. Mean reproducibility, based on duplicate analyses of splits of 22 random coccolith
samples from Site 925, is 0.08%ford18O and 0.07%ford13C (1s).ecoccolithof
small and large coccoliths was calculated from coccolithd13C relative toG.
menardiid13C because this foraminiferal species calcifies in equilibrium withd13C
DIC81, and also has a similar depth habitat to the coccolithophores with maximum
abundances in the chlorophyll maximum near the thermocline82; such that
ecoccolith¼d13Ccoccolithsizefractiond13CG:menardii ð3Þ
Propagated analytical uncertainty ofecoccolith¼ ðð0:052Þ þð0:052ÞÞ
p
: ð4Þ
For one sample around 2 Myr ago, there was an insufficient number of
G. menardiiindividuals for analysis, therefore we were unable to calculateecoccolith. See Supplementary Methods for details of carbon isotope determinations in
alkenones,epand [CO2aq] calculations, and details on ACTI-CO simulations to
quantify the effect of changing active uptake on [CO2aq] estimates.
References
1. Klaas, C. & Archer, D. E. Association of sinking organic matter with various
types of mineral ballast in the deep sea: implications for the rain ratio.Global
Biogeochem. Cycles16,1–14 (2002).
2. Hain, M., Sigman, D. & Haug, G. inTreatise on Geochemistry2nd edn, Vol.
8(18) (eds Mottl, M. J. & Elderfield, Henry) 485–517 (2013).
3. Feely, R. A.et al.Impact of anthropogenic CO2on the CaCO3system in the
oceans.Science305,362–366 (2004).
4. Rost, B., Zondervan, I. & Wolf-Gladrow, D. Sensitivity of phytoplankton to future changes in ocean carbonate chemistry: current knowledge,
contradictions and research directions.Mar. Ecol. Prog. Ser.373,227–237
(2008).
5. Bach, L. T., Bauke, C., Meier, K. J. S., Riebesell, U. & Schulz, K. G. Influence of changing carbonate chemistry on morphology and weight of coccoliths formed byEmiliania huxleyi.Biogeosciences9,3449–3463 (2012).
6. Bach, L. T.et al.Dissecting the impact of CO2and pH on the mechanisms of
photosynthesis and calcification in the coccolithophoreEmiliania huxleyi.New
Phytol.199,121–134 (2013).
7. Jones, B. M.et al.Responses of theEmiliania huxleyiproteome to ocean
acidification.PloS One8,e61868 (2013).
8. Langer, G.et al.Species-specific responses of calcifying algae to changing
seawater carbonate chemistry.Geochem. Geophys. Geosyst.7,Q09006 (2006).
9. Langer, G., Nehrke, G., Probert, I., Ly, J. & Ziveri, P. Strain-specific responses of
Emiliania huxleyito changing seawater carbonate chemistry.Biogeosciences6,
2637–2646 (2009).
10. Jin, P., Gao, K. & Beardall, J. Evolutionary responses of a coccolithophorid
Gephyrocapsa oceanicato ocean acidification.Evolution67,1869–1878 ð2013Þ:
11. Lohbeck, K. T., Riebesell, U. & Reusch, T. B. Adaptive evolution of a
key phytoplankton species to ocean acidification.Nat. Geosci.5,346–351
(2012).
12. Hannisdal, B., Henderiks, J. & Liow, L. H. Long-term evolutionary and ecological responses of calcifying phytoplankton to changes in atmospheric CO2.Global Change Biol.18,3504–3516 (2012).
13. Henderiks, J. Coccolithophore size rules - reconstructing ancient cell geometry
and cellular calcite quota from fossil coccoliths.Mar. Micropaleontol.67,
143–154 (2008).
14. Bolton, C. T. & Stoll, H. M. Late Miocene threshold response of marine algae to
carbon dioxide limitation.Nature500,558–562 (2013).
15. Beaufort, L.et al.Sensitivity of coccolithophores to carbonate chemistry and
ocean acidification.Nature476,80–83 (2011).
16. Meier, K. J. S., Beaufort, L., Heussner, S. & Ziveri, P. The role of ocean
acidification inEmiliania huxleyicoccolith thinning in the Mediterranean Sea.
Biogeosciences11,2857–2869 (2014).
17. Horigome, M. T.et al.Environmental controls on theEmiliania huxleyicalcite
mass.Biogeosciences11,2295–2308 (2014).
18. Meier, K. J. S., Berger, C. & Kinkel, H. Increasing coccolith calcification during
CO2rise of the penultimate deglaciation (Termination II).Mar. Micropaleontol.
112,1–12 (2014).
19. Gibbs, S. J., Robinson, S. J., Bown, P. R., Dunkley Jones, T. & Henderiks, J. Comment on "Calcareous nannoplankton response to surface-water
acidification around Oceanic Anoxic Event 1a".Science332,175 (2011).
20. Riebesell, U.et al.Reduced calcification of marine plankton in response to
increased atmospheric CO2.Nature407,364–367 (2000).
21. Read, B. A.et al.Pan genome of the phytoplanktonEmilianiaunderpins its
global distribution.Nature499,209–213 (2013).
22. Kameo, K. & Bralower, T. J. inProceedings of the Ocean Drilling Program.
Scientific Results165 (eds Leckie, R. M., Sigurdsson, H., Acton, G. D. & Draper, G.) 3–17 (Ocean Drilling Program, 2000).
23. Young, J. R. Size variation of NeogeneReticulofenestracoccoliths from Indian
Ocean DSDP cores.J. Micropalaeontol.9,71–85 (1990).
24. Steph, S., Regenberg, M., Tiedemann, R., Mulitza, S. & Nu¨rnberg, D. Stable isotopes of planktonic foraminifera from tropical Atlantic/Caribbean core-tops:
Implications for reconstructing upper ocean stratification.Mar. Micropaleontol.
71,1–19 (2009).
25. Chaisson, W. & Ravelo, A. InProceedings of the Ocean Drilling Program.
Scientific Results255–268 (Ocean Drilling Program, 1997).
26. Rost, B., Zondervan, I. & Riebesell, U. Light-dependent carbon isotope
fractionation in the coccolithophoridEmiliania huxleyi.Limnol. Oceanogr.47,
120–128 (2002).
27. Cassar, N., Laws, E. A. & Popp, B. N. Carbon isotopic fractionation
by the marine diatomPhaeodactylum tricornutumunder nutrient- and
light-limited growth conditions.Geochim. Cosmochim. Acta70,5323–5335
(2006).
28. Gupta, A. K., Singh, R. K., Joseph, S. & Thomas, E. Indian Ocean high-productivity event (10–8 Ma): linked to global cooling or to the initiation of the
Indian monsoons?Geology32,753–756 (2004).
29. Diester-Haass, L., Billups, K. & Emeis, K. C. In search of the late Miocene-early Pliocene ‘‘biogenic bloom’’ in the Atlantic Ocean (Ocean Drilling Program Sites
982, 925, and 1088).Paleoceanography20(2005).
30. Seki, O.et al.Alkenone and boron-based PliocenepCO2records.Earth. Planet.
Sci. Lett.292,201–211 (2010).
31. Pagani, M. inTreatise on Geochemistry 2nd edn(2014).
32. Henderiks, J. & Pagani, M. Refining ancient carbon dioxide estimates:
significance of coccolithophore cell size for alkenone-based pCO2records.
Paleoceanography22(2007).
33. van de Wal, R. S., de Boer, B., Lourens, L. J., Ko¨hler, P. & Bintanja, R.
Reconstruction of a continuous high-resolution CO2record over the past 20
million years.Clim. Past7,1459–1469 (2011).
34. Hopkinson, B. M., Dupont, C. L., Allen, A. E. & Morel, F. M. M. Efficiency of
the CO2-concentrating mechanism of diatoms.Proc. Natl Acad. Sci. USA108,
3830–3837 (2011).
35. Laws, E. A., Popp, B. N., Cassar, N. & Tanimoto, J.13C discrimination patterns
in oceanic phytoplankton: likely influence of CO2concentrating mechanisms,
and implications for palaeoreconstructions.Funct. Plant Biol.29,323–333
(2002).
36. Ho¨nisch, B., Hemming, N. G., Archer, D., Siddall, M. & McManus, J. F. Atmospheric carbon dioxide concentration across the mid-Pleistocene
transition.Science324,1551–1554 (2009).
37. Zhang, Y. G., Pagani, M., Liu, Z., Bohaty, S. M. & DeConto, R. A 40
million-year history of atmospheric CO2.Phil. Trans. R. Soc. A371,20130096
(2013).
38. Lu¨thi, D.et al.High-resolution carbon dioxide concentration record
650,000–800,000 years before present.Nature453,379–382 (2008).
39. Clark, P. U.et al.The middle Pleistocene transition: characteristics,
mechanisms, and implications for long-term changes in atmosphericpCO2.
Quat. Sci. Rev.25,3150–3184 (2006).
40. Markovic, S., Paytan, A. & Wortmann, U. G. Pleistocene sediment offloading
and the global sulfur cycle.Biogeosciences12,3043–3060 (2015).
41. Tyrrell, T. & Zeebe, R. E. History of carbonate ion concentration
over the last 100 million years.Geochim. Cosmochim. Acta68,3521–3530
(2004).