http://www.sciencepublishinggroup.com/j/ajcbe doi: 10.11648/j.ajcbe.20170101.15
Detection of Volatile S- and N-containing Compounds
Based on SAW Array Sensor
Ning Mu
1, Yong Pan
1, *, Shengyu Shao
1, Liu Yang
1, Wen Wang
2, Shitang He
21
State Key Laboratory of NBC Protection for Civilian, Beijing, China
2
Institute of Acoustic, Chinese Academy of Science, Beijing, China
Email address:
*
Corresponding author
To cite this article:
Ning Mu, Yong Pan, Shengyu Shao, Liu Yang, Wen Wang, Shitang He. Detection of Volatile S- and N-containing Compounds Based on SAW Array Sensor. American Journal of Chemical and Biochemical Engineering. Vol. 1, No. 1, 2017 pp. 35-39.
doi: 10.11648/j.ajcbe.20170101.15
Received: June 7, 2017; Accepted: July 6, 2017; Published: August 3, 2017
Abstract:
A chemical sensing system based on arrays of surface acoustic wave (SAW) resonators has been developed for identification of S- and N-containing Compounds. The four resonators in the array are coated with four kinds of different chemoselective polymers: triethanolamine (TEA), nano-fibular polyaniline (PANI), glutamic acid hydrochloride (GAH) and multi walled carbon nanotubes (MWCN) modified with tungsten trioxide, which are used for the detection of harmful gases H2S, SO2, NH3 and NO2 respectively. The harmful gases were detected under room conditions, the response time, the responsevalue, the recovery speed and the detection tendency are obtained. The characteristics of various gases are extracted from the experiment datum. The datum is processed and Pattern recognition algorithms are developed to identify four different of gases. The stability experiments are also made to prove the accuracy of the results of the detection. It is concluded that the harmful gases, including H2S, SO2, NH3 and NO2, could be detected rapidly and accurately by the SAW array sensor.
Keywords:
Detection, Surface Acoustic Wave (SAW), Array, Harmful Gases1. Introduction
Surface acoustic wave (SAW) is a kind of sound wave propagating along the surface of the elastic matrix, and its amplitude decays exponentially with the increasing depth of the matrix material. Wohltjen and Dessy [1] for the first time published the article on the analysis of the SAW sensor for gas detection in 1979. Since then, SAW sensors were widely studied for detection of volatile toxic compounds because of their favorable performances, such as high sensitivity, portability, low cost, and easy deployment [2–4]. Most of SAW sensors are based on resonator or delay line, whose acoustic propagation path is coated with a proper chemically interactive material (CIM) fixing the sensing characteristics of the device. The selection of CIM is important for preparing SAW sensor and it is depended on the chemical compounds to be detected. To identify accurately, the application of sensor arrays is often required in the detection of a specific analyte [5–7]. Among the preparation of SAW
sensors, the CIM deposition technique is a critical matter in film fabrication, because it not only is deposited along the acoustic propagation path, but also must be continuous, uniform and lowcost. The films should also have a smooth surface in order to prevent any scattering, diffraction or diffusion, which are all responsible for a high attenuation of the wave. Moreover, the poor reliability caused by the lack of accuracy in placing the absorbing membranes onto the SAW devices is an issue yet to be solved.
results. In order to detect the toxic and harmful gas more rapidly and accurately, in this paper, a five-channel SAW array was fabricated and was used to detect H2S, SO2, NH3
and NO2 respectively.
2. Experiments
2.1. Reagents and Instrument
The SAW array sensor used in our work is fabricated by Institute of Acoustic of Chinese Academy of Science. It consists of five-channel resonator, each resonator is fabricated on ST-x quartz, which has an oscillation frequency 300 MHz. The Inter Digited Transducers (IDT) are made of
aluminium deposited by RF sputtering using
photolithographic techniques, the thickness is 200 nm, the area of resonator is 4 mm2. Both the spacing between the fingers and the finger width is 5 µm. The selectively sensitive membrane materials used in this study are TEA, PANI, and GAH, which are bought from ShangHai chemical reagent. MWCN is synthesized by our laboratory. Four kinds of different solution are prepared with ethanol as solvent, the concentrations for above films (TEA, PANI, GAH and MWCN) are 0.2 mg/ml, 0.1 mg/ml, 0.2 mg/ml and 0.1 mg/ml respectively.
2.2. Preparation of SAW Sensor Array
The SAW array sensor used in this study are made five resonators, each resonator configuration in the array sensor was reproducibly developed on a temperature compensated ST-X quartz substrate as the oscillation feedback, 1600 angstrom Al-strip was deposited onto ST-X quartz wafer by using the photolithographic process. A thin SiO2 with 200
angstrom thickness is deposited on the device surface to protect the electrodes in the sensitive films deposition by using plasma enhanced chemical vapour deposition (PECVD), and the SiO2 coating is amorphous and porous to
increase the sensing contact area, which is benefit to the interaction between the gases detected and the sensitive films.
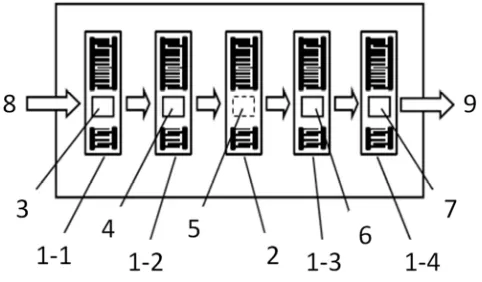
The structure of the SAW array sensor could be shown in Figure 1. In the array sensor, channel 2, which was not coated, was selected as the reference resonator to delete the influence of temperature and pressure, while the channel 1-1, 1-2, 1-3 and 1-4 were coated with TEA, PANI, GAH and MWCN respectively and were used to detected H2S, SO2,
NH3 and NO2. Dripping the film solution prepared above on
each resonator surface of the SAW array sensors, until the change of the frequency reaching 50-60 kHz, when the resonator surface is dry, the sensitive films with formation of TEA sensitive film (3), PANI sensitive membrane (4), GAH sensitive membrane (6) and MWCN sensitive membrane (7) were formed, given the high mass-sensitivity of the SAW sensor, the thickness of the films were estimated by measuring the frequency shift as follows [12, 13]:
∆f = -1.26×10⁶ f0 2
hρ (1)
Where ∆f (Hz) is the frequency shift between coated and uncoated SAW resonator, f0 (MHz) is the operating
frequency of the SAW array sensor, h (cm) is the film thickness of the film, and ρ (g/cm3) is the density of the film material. The tests were carried out under environment condition (19°C and 20%RH), the 5ppm H2S, SO2, NH3 and
NO2 pass through the SAW sensors array from port 8 to port
9, the changed frequency shifts are recorded by computer.
Figure 1. Schematic of SAW sensor array.
2.3. Detection of Toxic and Harmful Gas
When the detection for H2S, SO2, NH3 and NO2 were
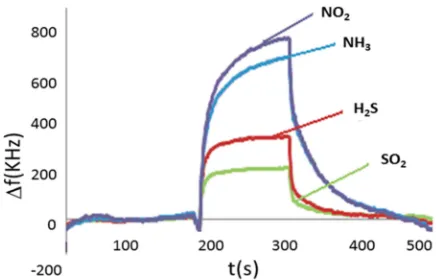
carried out, the gasses whose concentrations were 5 ppm passed through the SAW array sensor from port 8 to port 9, the results were shown in Figure 2 ∼ 5. The result of Figure 2 indicated that when H2S gas passed through the array sensor,
the 1-1 channel had the largest signal response and the fastest response speed, while the other three had a relative long responses time and small response signal, it was because that the TEA coated on channel 1-1 was much sensitive to H2S,
the H2S molecular could be easily absorbed on the surface of
TEA and reached equilibrium quickly. Although the other three channels could response to H2S, the response signals
and the response speed were very different with H2S, from
Figure 2, it was obvious that the SO2 sensor of the array had
the second largest signal response, NO2 was the third and
NH3 was the fourth, the difference of four channels in the
detection of H2S was obtained. It was same for the channel
1-2 which was coated with PANI for the detection of SO2,
when the same concentration gases passed through the channel, the 1-2 sensor had the larger frequency shift and the faster response speed than the other three sensors, at the same time, the response signals and the response time of the four sensors to same gas are very different.
The same things happened in the 1-3 channel and the 1-4 channel in the detection of NH3 and NO2. The results
modified with tungsten trioxide, are very sensitive for the detection of H2S, SO2, NH3 and NO2, when these harmful
gases passed through the channels, they could be absorbed on the surface of the sensitive films efficiently, accordingly making largest signal response of each channel. The figures also showed that it was possible for us to use SAW sensor array with the sensitive film of TEA, GAH, PANI and MWCN to identify H2S, SO2, NH3 and NO2 by pattern
recognition algorithm.
Figure 2. Frequency Difference of Array sensor to H2S.
Figure 3. Frequency Difference of Array sensor to SO2.
Figure 4. Frequency Difference of Array sensor to NH3.
Figure 5. Frequency Difference of Array sensor to NO2.
2.4. Stability Test
In order to validate the stability of the SAW array, the repeated experiments had been done. Under room conditions, 5 ppm H2S with carrier gas N2 sequentially
passed through the SAW sensor array, repeat the above experiment four times, as shown in Figure 6, and the particular data was shown in Table 1 ∼ 4.
Figure 6. Array sensorResponse and Repeatability Testing to 5 ppm H2S.
From the Figure 6, it could be noted that the four times exposure to array sensor were in good reproducible run, the gathered frequency datum showed a rapid rise upon exposure to H2S and reached equilibrium quickly. When the
H2S was removed by N2 injection, the array sensor could
return to its initial baseline very soon, the whole transition of initial state-adsorption-stable-equilibration state-desorption-recovery to initial state was clearly observed, it meant 90% response time of ∼15s and recovery time of ∼20s with good repeatability were obtained. The promising results indicated that the array sensor exhibited fast response and excellent repeatability in response to H2S or
other gases.
Table 1. Datum Statistics of the First Response.
Array channel H2S (ppm) Response Δf(Hz) Response time(s) Frequency shift Δf(Hz) Recovery time(s)
H2S channel 5 819 102 810 49
SO2 channel 5 623 97 630 55
NH3 channel 5 315 81 290 53
Table 2. Datum Statistics of the Second Response.
Array channel H2S (ppm) Response Δf(Hz) Response time(s) Frequency shift Δf(Hz) Recovery time(s)
H2S channel 5 846 98 815 47
SO2 channel 5 639 88 620 51
NH3 channel 5 306 78 295 43
NO2 channel 5 519 96 530 57
Table 3. Datum Statistics of the Third Response.
Array channel H2S (ppm) Response Δf(Hz) Response time(s) Frequency shift Δf(Hz) Recovery time(s)
H2S channel 5 795 89 780 39
SO2 channel 5 615 95 620 56
NH3 channel 5 315 101 305 53
NO2 channel 5 495 102 505 49
Table 4. Datum Statistics of the Fourth Response.
Array channel H2S (ppm) Response∆f(Hz) Response time(s) Frequency shift ∆f(Hz) Recovery time(s)
H2S channel 5 807 98 795 59
SO2 channel 5 623 86 595 55
NH3 channel 5 309 95 285 43
NO2 channel 5 506 102 495 57
The difference must be existed if we want to identify the gases accurately, and the characteristics of various gases should also be extracted from the experiments datum. For example, in Table 1 ∼ 4, it could be found that when the H2S
gas was passing through the array, the first channel had the largest response, and the second channel was the second largest. This was because the H2S and SO2 were S-containing
compounds, and they have the similar chemical and physical properties, so it is likely to make distorting detection if using only one SAW sensor. Whereas, with the applying of SAW array sensors which can make a contrast of different sensors of the array, false detection can be avoided.
2.5. Arithmetic of Detection
A diverse set of material coatings gives the sensor arrays a degree of chemical sensitivity and selectivity, all of these materials target a specific chemical functionality and the enhancement of accessible film surface area. Since no one coating provides absolute analyte specificity, the array responses are further analyzed using pattern recognition algorithm.
In this paper, each SAW device in an array is coated with a different chemoselective coating. which has the largest response to a specific chemical gas, at the same time, other sensors of the SAW array have a weak response, the gas flow is designed so that the SAW sensors in a given array are exposed to vapor at the same time, a large data collection effort is performed for testing and validating the detection and the pattern recognition. Then a series of statistical and neural theory are used to process feature data and classify gas feature. At this stage, a variety of different types of identification in the district, which are likely to exist, are required for testing system for the establishment and
continuous training. In the training phase, the characteristics of various gases and the data of samples are extracted from the data and prior knowledge. According to the template library, the network model for classification is obtained. In this paper, there are four different selective SAW sensors (sensitive film coated with TEA, PANI, GAH and MWCN) and four analytes (the gas H2S, SO2, NH3 and NO2), the
analyte matrix X is:
4 4
( )×
= ik
X x (2)
The covariance matrix of sample matrix X is
4 4
( )
×=
COV ik
X
s
(3)And the Sik in formula (3) is
4
1
(1 / 1) ( )( )
=
= −
∑
− −ik pi i pk k
p
s r x x x x (4)
The eigenvalue of Xcov is
1 ≥ 2 ≥ 3 ≥ 4 ≥ 0
λ
λ
λ
λ
(5)And the standard orthogonal feature vector of Xcov is
1 2 3 4
( , , , )
=
v l l l l (6)
By this way, the feature vector of the covariance matrix can be obtained from the sample data, and it is used as the input of sigmoid function in formula (7), so the detection thresholds of different gases are obtained from sample data.
( ) 1/ (1= + −x)
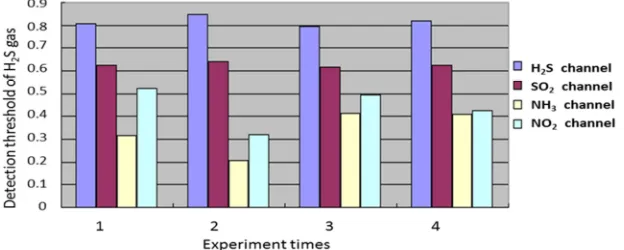
Figure 7. Repeated experiments data of 5 ppm H2S gas after algorithm processed.
To test the algorithm, the datum are collected from the four times repeated experiments of the H2S gas. There are
four types of datum, and they represent H2S, SO2, NH3 and
NO2 respectively. From the algorithm above, the threshold of
H2S gas can be obtained, the threshold value normalized of
the first channel is 0.7 to 1, the threshold normalized of the second channel is 0.55 to 0.65. Because the sensors coated with other three selectively sensitive membrane materials are not sensitive to H2S gas, the response of the other channels
are not regular, and their thresholds are not considered. Processing results are shown in Figure 7, from the Figure 7 we can see that the gas of H2S can be detected exactly by the
thresholds of channel one and two. In this paper, we also have done the detection experiments of SO2, NH3 and NO2
gas, by setting the threshold obtained by using this algorithm, a satisfied result could be gotten.
3. Summary and Conclusion
In this study, a SAW array sensor coated with four chemoselective polymers: triethanolamine (TEA), nano-fibular polyaniline (PANI), glutamic acid hydrochloride (GAH) and multi walled carbon nanotubes (MWCN) modified with tungsten trioxide is fabricated. Harmful gases including H2S, SO2, NH3 and NO2 are detected under 5 ppm
concentration, the stability of the sensor array is proved and the data is collected. By using the pattern recognition in data processing, harmful gas as H2S, SO2, NH3 and NO2 can be
detected and identified rapidly, and also it provides a new approach for the detection of toxic and harmful gases. Further work is being done to improve the discrimination potential of the sensor array.
Acknowledgements
The authors gratefully acknowledges the support of the National Natural Science Foundation of China: 10834010 and 11074268.
References
[1] H. Wohltjen, R. Dessy, “Surface acoustic wave probe for chemical analysis,” Anal Chem, 51, 1458-1475, 1979.
[2] M. Benetti, D. Cannata, A. D’Amico, “SAW sensors on Aln/diamond/Si in structures,” Sensors IEEE, 2, 753–756, 2004.
[3] C. H. Wang, X. L. Xu, “Electrochemical investigation of parathion impringred sensor and its application,” Chinese Journal of Applied Chemistry, 23(40), 404-408, 2006. [4] B. S. Joo, J. S. Huh, D. D. Lee, “Fabrication of polymer SAW
sensor array to classify chemical warfare agents,” Sensors and actuators B, 121, 47-53, 2007.
[5] D. S. Ballantine, R. M. White, S. J. Martin, “Acoustic Wave Sensors: Theory, Design, and Physico-Chemical Applications,” John Wiley & Sons, New York, Academic Press, 1997. [6] E. J. Houser, R. A. McGill, T. E. Mlsna, “Sorbent coatings for
detection of explosives vapor: applications with chemical sensor,” SPIE Proceedings, 3710, 394–401, 1999.
[7] J. W. Grate, S. J. Patrash, M. H. Abraham, C. M. Du, “Selective vapor sorption by poly-mers and cavitands on acoustic wave sensors: is this molecular recognition,” Analytical Chemistry, 68, 913–917, 1996.
[8] A. D’Amico, E. Verona, “SAW sensors,” Sensors and Actuators, 17, 55-56, 1989.
[9] J. D. Galipeau and R. S. Falconer, “Theory, design and operation of a surface acoustic wave hydrogen sulfide microsensor,” Sensors and Actuators B, 24-25, 49-53, 1995. [10] C. H. Wang, X. L. Xu, “Electrochemical investigation of
parathion impringred sensor and its application,” Chinese Journal of Applied Chemistry, 23(40), 404-408, 2006. [11] Y. Zhihua, “Polymer coated sensor array based on quartz
crystal microbalance for chemical agent analysis”. European Polymer Journal, 44, 1157-1164, 2008.
[12] L. Franz, L. Peter, “Molecular imprinting in chemical sensing detection of aromatic and halogenated hydrocarbons as well as polar solvent vapors,” Fresenius J Anal Chem, 360,759–762, 1998.