ANALYTICAL METHOD DEVELOPMENT AND VALIDATION FOR SIMULTANEOUS ESTIMATION OF SIMVASTATIN AND SITAGLIPTIN
5
0
0
Full text
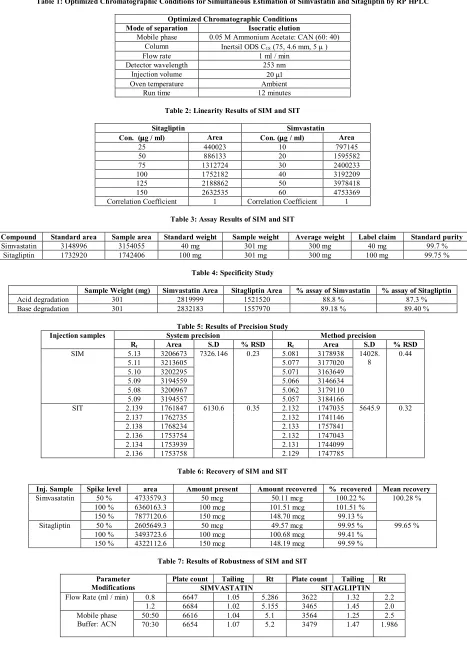
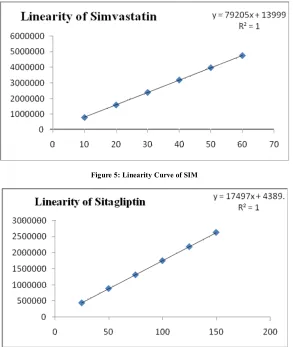
(2) Yaddanapudi Mrudula Devi et al. Int. Res. J. Pharm. 2013, 4 (8) with concentrations 10 mg / ml, 20 mg / ml, 30 mg / ml, 40 mg / ml, 50 mg / ml,60 mg / ml respectively. Preparation of standard stock solution for Sitagliptin: In the case of Sitagliptin, 100 mg of Simvastatin working standard was weighed accurately. They were transferred to 100 ml volumetric flask dissolved and made up to the volume with mobile phase to obtain 1000 mg / ml solution. Preparation of standard dilutions of Sitagliptin From the stock solution, 2.5 ml, 5 ml, 7.5 ml, 10 ml ,12.5 ml, 15 ml were pipette out in to 100 ml volumetric flask and made up to the mark with mobile phase to obtain dilutions with concentrations 25 mg / ml, 50 mg / ml, 75 mg / ml, 100 mg / ml, 125 mg / ml,150 mg / ml respectively. Procedure Inject each concentration in to the chromatographic system and measure the peak area. Plot the graph of peak area on y axis versus concentration on x axis. Calculate the correlation coefficient. Validation Study of Sitagliptin and Simvastatin An integral part of analytical method development is validation. Once the method has been developed, it is necessary to evaluate under the conditions expected for real samples before being used for a specific purpose. The method validation was performed as per ICH guidelines for the determination of Simvastatin and Sitagliptin in bulk and pharmaceutical dosage forms. The method was validated with respect to parameters including specificity, precision, accuracy, linearity, robustness, system suitability and limit of detection (LOD), limit of quantification (LOQ). Specificity The effect of wide range of excipients and other additives usually present in the formulations of Simvastatin and Sitagliptin in the determinations under optimum conditions is investigated. The specificity of the RP-HPLC method is established by injecting the mobile phase and placebo solution in triplicate and recording the chromatograms. The specificity results were presented in Table 4. Precision Precision of the method was performed as intraday and interday precision. To study the intraday precision, six replicate standard solutions of Simvastatin and Sitagliptin were injected. The percent relative standard deviation (% RSD) was calculated. The acceptable criteria are not more than 2.0. Linearity Linearity graphs for the proposed assay methods were obtained over the concentration range of 25-150 µg / ml and 10-60 µg / ml. Method of least square analysis was carried out for getting the slope, intercept and correlation coefficient values and results were presented in Table 2. The linearity graphs of Simvastatin and Sitagliptin were shown in Figure 5 and 6. Accuracy (Recovery studies) The accuracy of the method was determined by calculating recovery of by the method of addition at three different levels (80 %, 100 % and 120 %). Percent recovery for Simvastatin. and Sitagliptin by all the methods was found in the range of Table 7. The mean percentage recovery of Simvastatin and Sitagliptin at each level was 99.5 %, 100.2 % which were in the acceptance limit of 98 to 103 % as shown in Table 6. Robustness Robustness of the proposed methods was evaluated by making small changes in flowrate (± 0.2 ml / min), wavelength (± 2 nm) of the solution. The results were presented in Table 7. Ruggedness Ruggedness of the method was evaluated by comparing the results of assay of Simvastatin and Sitagliptin obtained from two analysts, system and two columns. RSD was always found to be < 2 % which indicates the method was rugged. Limit of Detection (LOD) The limit of detection (LOD) is defined as the lowest concentration of the analyte that can be detected but not necessarily quantified. LOD is calculated using formula (3.3*S.D) / Slope. Limit of Quantitation (LOQ) The limit of Quantitation (LOQ) is defined as the lowest concentrations of the analytes that can be qualified with acceptable precision and accuracy. LOQ is calculated using formula (10*S.D) / Slope. RESULTS AND DISCUSSIONS An effort has been made to identify a Simple, Precise, Specific and Accurate method for estimation of Sitagliptin and Simvastatin in formulation by using RP-HPLC method. During the selection of mobile phase several solvents were tried at various levels and finally selected mobile phase system was Acetonitrile: 0.05 M Ammonium Acetate Buffer of pH 4.0 at ratio 40:60 at ambient temperature. The concentration of (10 µg / ml) of Sitagliptin and Simvastatin was prepared by using mobile phase. The above solution was scanned in the range of 200-400 nm by using UV-VIS spectrophotometer with mobile phase as reference. After considering all the system suitability parameters, Acetonitrile: 0.05 M Ammonium Acetate Buffer (40:60) of pH 4.0 was selected for analysis at optimized flow rate of 1.0 ml / min. The Retention time of SIT And SIM was found to be 2.1 minutes, 5 minutes respectively. The Linearity of SIT and SIM was carried out at different concentrations ranging from 25-150 µg / ml and 10-60 µg / ml and correlation coefficient was found to be 1 and 1 which indicates that the concentration had given good linearity. Accuracy was confirmed by Recovery Studies. The % recovery of Sitagliptin and Simvastatin was found to be 99.5 %, 100.2 % which were in the acceptance limit of 98 to 103 % as shown in Table 6. The Precision has done in two ways i.e., System Precision and Method Precision. The % RSD values of Sitagliptin and Simvastatin for System Precision and Method Precision was found to be 0.35 and 0.23 and 0.32 and 0.44 respectively as shown in the Table 5 Which were in the acceptance limit of less than 2 %. The Specificity for these drugs was determined by using 0.1 N Hcl, 0.1 N NaoH for 60 minutes. When drug was mixed with 0.1 N Hcl, 0.1 N NaOH it was found to be occurrence of irregular peak and peak elution was not good. Above results has shown good Specificity. Page 185.
(3) Yaddanapudi Mrudula Devi et al. Int. Res. J. Pharm. 2013, 4 (8) Table 1: Optimized Chromatographic Conditions for Simultaneous Estimation of Simvastatin and Sitagliptin by RP HPLC Optimized Chromatographic Conditions Mode of separation Isocratic elution Mobile phase 0.05 M Ammonium Acetate: CAN (60: 40) Column Inertsil ODS C18 (75, 4.6 mm, 5 m ) Flow rate 1 ml / min 253 nm Detector wavelength Injection volume 20 ml Ambient Oven temperature Run time 12 minutes Table 2: Linearity Results of SIM and SIT Sitagliptin mg / ml) Con. (m 25 50 75 100 125 150 Correlation Coefficient. Simvastatin mg / ml) Con. (m 10 20 30 40 50 60 Correlation Coefficient. Area 440023 886133 1312724 1752182 2188862 2632535 1. Area 797145 1595582 2400233 3192209 3978418 4753369 1. Table 3: Assay Results of SIM and SIT Compound Simvastatin Sitagliptin. Standard area 3148996 1732920. Sample area 3154055 1742406. Standard weight 40 mg 100 mg. Sample weight 301 mg 301 mg. Average weight 300 mg 300 mg. Label claim 40 mg 100 mg. Standard purity 99.7 % 99.75 %. Table 4: Specificity Study Sample Weight (mg) 301 301. Acid degradation Base degradation. Simvastatin Area 2819999 2832183. Rt 5.13 5.11 5.10 5.09 5.08 5.09 2.139 2.137 2.138 2.136 2.134 2.136. SIT. % assay of Simvastatin 88.8 % 89.18 %. Table 5: Results of Precision Study System precision Area S.D % RSD Rt 3206673 7326.146 0.23 5.081 3213605 5.077 3202295 5.071 3194559 5.066 3200967 5.062 3194557 5.057 1761847 6130.6 0.35 2.132 1762735 2.132 1768234 2.133 1753754 2.132 1753939 2.131 1753758 2.129. Injection samples SIM. Sitagliptin Area 1521520 1557970. % assay of Sitagliptin 87.3 % 89.40 %. Method precision Area S.D 3178938 14028. 8 3177020 3163649 3146634 3179110 3184166 1747035 5645.9 1741146 1757841 1747043 1744099 1747785. % RSD 0.44. 0.32. Table 6: Recovery of SIM and SIT Inj. Sample Simvasatatin. Sitagliptin. Spike level 50 % 100 % 150 % 50 % 100 % 150 %. area 4733579.3 6360163.3 7877120.6 2605649.3 3493723.6 4322112.6. Amount present 50 mcg 100 mcg 150 mcg 50 mcg 100 mcg 150 mcg. Amount recovered 50.11 mcg 101.51 mcg 148.70 mcg 49.57 mcg 100.68 mcg 148.19 mcg. % recovered 100.22 % 101.51 % 99.13 % 99.95 % 99.41 % 99.59 %. Mean recovery 100.28 %. 99.65 %. Table 7: Results of Robustness of SIM and SIT Parameter Modifications Flow Rate (ml / min) Mobile phase Buffer: ACN. 0.8 1.2 50:50 70:30. Plate count Tailing SIMVASTATIN 6647 1.05 6684 1.02 6616 1.04 6654 1.07. Rt 5.286 5.155 5.1 5.2. Plate count Tailing SITAGLIPTIN 3622 1.32 3465 1.45 3564 1.25 3479 1.47. Rt 2.2 2.0 2.5 1.986. Page 186.
(4) Yaddanapudi Mrudula Devi et al. Int. Res. J. Pharm. 2013, 4 (8). Figure 1: Structure of Simvastatin. Figure 2: Structure of Sitagliptin. Figure 3: Chromatogram of Placebo. Figure 4: Chromatogram of SIT and SIM. Figure 5: Linearity Curve of SIM. Figure 6: Linearity Curve of SIT. Page 187.
(5) Yaddanapudi Mrudula Devi et al. Int. Res. J. Pharm. 2013, 4 (8) The Robustness of the method developed was validated by changing the flow Rate and mobile phase has shown in Table 7. The selected flow rate and mobile phase gives good separation of drugs. The proposed method was analyzed by two different analysts by conducting Ruggedness. Hence the proposed method has good repeatability. The tablet formulation was selected for analysis. The nominal concentration (100 %) considered and 20 µl of formulation was injected. The Assay percentage of SIT And SIM present in the sample was found to be 100.14 %, 99.5 % respectively. All the above parameters combined with the simplicity and ease of operation ensures that the RP-HPLC method can be applied for Simultaneous Estimation of Sitagliptin and Simvastatin in routine analysis of the two drugs in tablet dosage forms. CONCLUSION From the above experimental data and results, the developed HPLC method is having the following advantages: · The standard and sample preparation requires less time. · No tedious extraction procedure was involved in the analysis of formulation. · Run time required for recording chromatograms were less than 10 minutes. · Suitable for the analysis of raw materials, applicable to dissolution studies and can be used for the content uniformity studies. Hence, the chromatographic method developed for the Simvastatin and Sitagliptin is said to be rapid, simple, specific, sensitive, precise, accurate and reliable that can be effectively applied for routine analysis in research institutions, quality control department in industries, approved testing laboratories. ACKNWOLEDGEMENT The authors thank to chairman Dr. L. Rathaiah, Vignan Pharmacy College for providing necessary facilities to carry out this research work.. REFERENCES 1. IUPAC Nomenclature for Chromatography IUPAC Recommendations, Pure and Appl. Chem 1993; 65(4): 819–872. http://dx.doi.org/10.1351/ pac199365040819 2. JW Munson. Pharmaceutical Analysis Modern Methods, International Medical Book Distributors, Part B; 2001. p. 17-20. 3. Willard HH, Merritt LL, Dean JA and Settle FA. Instrumental Methods of Analysis; CBS publishers and distributors, New Delhi, 7th edition; 1986. p. 60-75. 4. Kenneth A. Text Book of Pharmaceutical Analysis, 3rd edition, Jhon Willey; 1998. p. 373-379, 408. 5. Willard HH, Merritt LL, Dean JA and Settle FA. Instrumental Methods of Analysis; CBS publishers and distributors, New Delhi, 7th edition; 1986. p. 650-651. 6. JW Munson. Pharmaceutical Analysis Modern Methods, International Medical Book Distributors, Part B; 2001. p. 17-20. 7. Rashmin. An Introduction to Analytical Method Development for Pharmaceutical Formulations. Directory of Open access Journal 2008; 6(4): 37-49. 8. Swarbrick James and Boylan James C. Encyclopedia of pharmaceutical technology, Marcel Dekker Inc. New York 1998; 1: 217-224. 9. Sharma Sheetal, Manocha Nimita, Bhandari Priya, Harsoliya Sohail and Jain Prabhat. Development of UV-SPectrophotometry and RP-HPLC Method and Its Validation for Simultaneous Estimation of Sitagliptin Phosphate and Simvastatin in Marketed Formulation. IJPBA 2012; 3(3): 673-678. 10. Kothari Ankur and Sheetal. Simultaneous UV Spectrophotometric Method for Estimation of Sitagliptin Phosphate and Simvastatin in Tablet dosage Form.JPR 2012; 5(1): 444-446. 11. Phaneemdra D, Venkatesh, Ramarao N. Simultaneous estimation of Simvastatin and Sitagliptin by using different analytical methods. IJAPA 2012; 2(1): 19-23. 12. Lough WJ and Wainer IWW. HPLC Fundamental Principles and Practices, Blackie Academic and Professional; 1991. p. 52-67. 13. Gatti R, Lotti C. Development and validation of a pre-column reversed phase liquid chromatographic method with fluorescence detection for the determination of primary phenethylamines in dietary supplements and phytoextracts, Journal of Chromatography A 2011; 1218(28): 44684473. http://dx.doi.org/10.1016/j.chroma.2011.05.044 PMid:21652038 14. Ashutoshkar. Pharmaceutical Drug Analysis, 2nd ed. New Age International Publishers; 2005. p. 466-467. 15. Sethi PD. HPLC Quantitative Analysis of Drug in Pharmaceutical Formulations; CBS publishers and distributors, 3rd ed; 2001. p. 101-103. 16. Dixit RP, Barhate CR, Padhye SG, Viswanathan CL, MS Nagarsenker. Stability indicating RP-HPLC method for simultaneous estimation of Simvastatin and Ezetimibe from tablet dosage form, IJPS 2010; 72(2): 204-210. Cite this article as: Yaddanapudi Mrudula Devi, R. Karthikeyan, Punttaguntla Sreenivasa Babu. Analytical method development and validation for simultaneous estimation of simvastatin and sitagliptin. Int. Res. J. Pharm. 2013; 4(8):184-188 http://dx.doi.org/10.7897/2230-8407.04836. Source of support: Nil, Conflict of interest: None Declared. Page 188.
(6)
Figure
Related documents
The implementation of big hole system for oil palm planting on Spodosol soil of Typic Placorthod sub group is important not only to increase distribution
In this section, we will introduce an inversion formula for the Radon transform based. on the Fourier and
Cross section of brain at level of cavity formed by accidental intracranial injection of parenteral alimentation fluid.. Cavity contains whitish fluid and is covered by inflaiied
circRNAs, has_circ_0109046 and has_circ_0002577 con- tained multiple miRNA binding sites, indicating that these EV-carried circRNAs may function as competing endogen- ous RNAs
Orthodoxy is identified as the sacralisation of the Serbian national identity (the primary hypothesis o f this thesis): upon which perceptions o f collective belonging
Levels of transcripts involved in the production and activity of trehalose, known as a stress response molecule in fungi (43), are also high in resting spores, but decrease
In this study, we compared the different performances of primer pairs targeting three hyper- variable regions of bacterial 16S rRNA gene (V1-V2, V3-V4, and V4) in profiling
Good dreams, unlike bad dreams, have different effects on both the dreamer and the hearers.. For one, the dreamer will naturally be
