1912
Evaluating Performance Measures Using Hybrid
Models With Fuzzy Finite State Machine For
Human Activity Recognition
R.Karthigasri, M.Sornam
Abstract—Human activity recognition (HAR) aims to acknowledge activities from a series of observations supported the actions of subjects and therefore the environmental conditions. The HAR research is the basis for many applications including video surveillance, health care, and human-computer interaction (HCI). Automatic Human Activity Recognition (HAR) has emerged as a key research area in human-human-computer interaction (HCI) and it was done by employing machine learning and deep learning techniques. One goal of human activity recognition is to produce data on a user‘s behavior that enables computing systems to proactively assist users with their tasks. The challenging task in human activity recognition is to get a labeled data. In most of the cases, the user is needed to label the activities and this, in turn, will increase the burden on the user. In this proposed work, sequential classification problems cannot predict alone by machine learning algorithms, so the proposed method hybridized evolutionary model and fuzzy finite state machine. The Experimental results have been employed to process and analyze data sets, like activities of daily living (ADL) and activities of daily working (ADW) with the available public domain data set. Later the datasets were classified their activities with machine learning algorithms namely support vector machine (SVM), Decision Tree. The design and implementation of evolutionary models Genetic Algorithm (GA), Particle Swarm Optimization algorithm (PSO) with Neural Network model gives of efficient results. The performance by this model has been proved by recall, F- score and confusion matrix plot view.
Keywords-Human Activity Recognition, Particle Swarm Optimization(PSO), Machine learning techniques, Genetic algorithm, FSM, Recurrent Neural Network, LSTM Model.
————————————————————
1.
INTRODUCTION
Human Activity recognition [1] is an evolving research problem that aims to acknowledge the actions and one or a lot of agents from a series of observations on the agent‘s actions and put together the environmental conditions. Since 1980 this analysis field has captured the eye of many engineering science communities thanks to its strength in providing personalized support for several totally different applications and its affiliation to many completely different fields of study like medication, human-computer interaction, or sociology. Due to its many-faceted nature, totally fully totally different fields would possibly sit down with activity recognition as prepare recognition, goal recognition, intent recognition, behavior recognition [2], location estimation and location-based services. The applications are Active and power-assisted Living (AAL) systems for sensible homes, care observation, and Monitoring surveillance systems for indoor and outdoor activities, Tele-Immersion (TI) applications. The simulation of human intelligence processes by machines, particularly computer systems [3]
were said to be known as Artificial Intelligence. These processes embody learning (the data and rules for exploitation the information), reasoning (rules to use and grasp approximate or definite conclusions) and self-correction. Evolutionary computation would possibly even be a family of algorithms for international improvement packed with biological evolution, and to boot the sub field of computing and soft computing searching for these algorithms. In technical terms, they're a family of population-based trial and error downside solvers with a meta-heuristic or random improvement character. In biological process computation, an initial set of candidate solutions is generated and iteratively updated. Each new generation is made by stochastically removing less desired solutions, and introducing tiny random changes. In biological word, a population of solutions is subjected to activity (or artificial selection) and mutation. As a result, the population can bit by bit evolve to extend in fitness, in this case the chosen fitness function of the algorithm.
Evolutionary computation techniques will manufacture extremely optimized solutions during a big selection of downside settings, creating them well-liked in computing. Many variants and extensions exist, suited to a lot of specific families of issues and knowledge structures. Evolutionary computation is additionally generally utilized in biological process biology as in silico process to check
common aspects of general biological process processes.
Evolutionary computing techniques mostly involve metaheuristic optimization algorithms [4]. Broadly speaking, the field includes as follows, Ant colony optimization, Artificial immune systems, Artificial life, Cultural algorithms, Differential evolution, Dual-phase evolution, Estimation of distribution algorithms, Evolutionary programming, Evolution strategy, Gene expression programming, Genetic algorithm[5], Genetic programming, Grammatical evolution, Learnable evolution model, Learning classifier systems, Memetic algorithms, Neuro evolution, Particle swarm optimization, Synergistic Fibroblast Optimization, Self-organization such as self-organizing maps, competitive learning, Swarm intelligence.
1.1. Genetic Algorithm (GA)
GA emulates the biological process characteristic of survival of the fittest. At every section, encoded ————————————————
Corresponding author- M. Sornam, Department of Computer Science, University of Madras, Guindy Campus, Chennai. E-mail: [email protected]
R. Karthigasri, Department of Computer Science, University of Madras, Guindy Campus, Chennai.
1913
chromosomes are simulated; the rule establishes the strength of every chromosome. The chromosomes change with crossover producing subsequent generation. Then the process repeats. The input parameters for GA are a group of solutions (the chromosomes of the GA) and fitness operate process success characteristics and stopping criteria. At every step of the rule chromosomes are initially evaluated for suitableness against the success characteristics. Subsequently successful chromosomes are randomly pooled to mate. Pairs of chromosomes during this pool willy-nilly share genetic info with one another. The chromosomes are evaluated against the stopping criteria. Then the method repeats if the standards aren't met. These options of GA build it adequate for handling giant, nonlinear issues with unpredictable results. Relying on multi point search and algorithmic options, the possibility of convergence to the universal optimum resolution is way above the possibility of falling into a neighborhood optimum resolution. GA contains a positive journal with success having handled issues during a style of fields, as well as however not restricted to optimization, mathematical logic, NN, professional systems, and planning.
1.2. Particle Swarm Optimization
Particle swarm optimization could be a population based mostly random optimization algorithm. In PSO algorithm the potential solutions, referred to as particles, as well as weights and thresholds vectors fly through the problem area by following the present optimum particles. During training, once initializing PSO parameters employing a cluster of random particles (solutions), best answer is achieved through the answer area. Therefore, the rate and position of the obtained best answer are updated per its own expertise and international cooperation. Despite regular PSOs convergence quickly on solutions, they will usually become cornered among native maxima and minima [12]. To obviate this problem and improve its training capacity, a modified PSO algorithm is proposed. An improvement to the PSO algorithmic program is planned by considering best and worst case particle positions. By nature of the algorithm best case positions will gravitate towards the optimal positions, away from worst case positions [13] to [14]. Individual particles within the swarm are painted by - dimensional position and rate vectors contained in, the search space.
2.
LITERATURE SURVEY
This work [1] describes the modules of artificial neural network feature extraction preprocessing and dedicated software hardware equipment‘s. Artificial neuro fuzzy systems and Genetic algorithms, a two layered feed forward network, sigmoid activation functions were detailed. Recognizing of Body Posture of activities like standing, sitting, etc. are classified. It has been concluded with the discussion of future research area, using new sensor like ECG, EMA, etc., use of Fuzzy logic rules for activity recognition and FGPA, on mobile device and application of deep neural network in nonlinear networked control systems. The deep learning model approach for smart home sensors using recurrent neural network is one of the bases of Ubiquitous Computing in smart Environments and a topic undergoing large amount of
1914
accurate models supported by reasoning mechanisms. Hence those statements of fuzzy concepts are systemically approved. A new automatic learning method for the fuzzy Knowledge Base (KB) of FFSM is based on the use of Genetic Algorithm. FFSM are suitable tools for modeling signals that follow an approximately repetitive pattern. It is well known for complex tasks. Dynamic nature of FFSM‘s increases the complexity of process. GA‘s has proven largely their effectiveness and efficiency for the last two decades so called genetic fuzzy systems [10]-[12]. It has been discussed about the planned concerning the developing activity recognition systems exploitation the Smartphone‘s‘ constitutional measuring device along with using CNNs to model the activities. The authors proposed a completely unique method of implementing the task of recognition by exploitation probabilistic graphical models like Bayesian Network (BN) and Dynamic Bayesian Network (DBN). These techniques were [13] widely used in different domains including speech recognition and bio-sequence analysis. The hybrid process techniques, like data processing pattern recognition, and act identification exploitation [14] Convolution Neural Network (CNN) were utilized in the context of ADL and ADW in order to divide the monitored human behaviors into activities and preferences. The swarm intelligence method [15] was used to monitor elderly person‘s activities via indoor position-based stigmergy. Some works used a dataset collected by a smartphone‘s measuring system. The effectiveness of PSO algorithm has been tested on several benchmark functions for many degrees of parallelism. The algorithms with FSM to exploit all the parallelisms that make the program converge very quickly. The FSM allow updating the positions and velocities of particles and after that we can take independently the result of the better optimized fitness from the position of particles. The demonstration of all the states and modules can be executed at the same time and the execution time can be reduced a lot. The PSO algorithm [16] proved that it has been a favorable convergence speed compared to the other meta-heuristic algorithms and the complexity of the algorithm depends on the size of design space, which it means that the number of allocated particles. So, the PSO‘s robustness is attached to its enhanced ability to achieve a satisfaction between two requirements, the numbers of used memory and the processing time of algorithm to solve complex problems [16]. The emotion recognition using low-cost wearable [17] sensors based on electroencephalogram and blood volume pulse has received much attention. Long short-term memory (LSTM) networks, a special type of recurrent neural networks, have been applied successfully to emotion classification. However, the performance of these sequence classifiers depends heavily on their hyper parameter values, and it is important to adopt an efficient method to ensure the optimal values. To address this problem, it has been proposed a new framework to automatically optimize LSTM hyper parameters using differential evolution (DE).In the planned algorithmic program, the particle swarm optimization algorithm has no longer used as a black box. Meanwhile, correlation coefficients among the options area unit added to binary particle swarm optimizations as a feature correlation issue to see the position of particles, so that
the feature with more information is more likely to be selected. The k-nearest neighbor classifier is then used as the fitness function in the particle swarm optimization to evaluate the performance of the feature subset, that is, feature combination with the highest k-nearest neighbor classifier recognition rate would be picked as the eigenvector method can work well with six classifiers, namely, J48, random forest, k-nearest neighbor, multilayer perceptron, naive Bayesian, and support vector machine, and the conclude with new algorithm can improve the classification accuracy in the OPPORTUNITY Activity Recognition dataset [18 ], this work an Activity Recognition database, built from the recordings of thirty subjects doing Activities of Daily Living (ADL) whereas carrying a
waist-mounted Smartphone with embedded physical
phenomenon sensors, that is discharged to property right on a well-known on-line repository. Results, obtained on the dataset [19] by exploiting a multiclass Support Vector Machine (SVM), are also acknowledged.
3.
EXISTING SYSTEM
3.1. Fuzzy Finite State Machine
A Fuzzy Finite State Machine (FFSM) is an extended version of the novel computational model- Finite State Machine (FSM), the model which simulates the sequence of events in a dynamic process. The FSM computation is based on a model made of one or more states. Only one single state of this machine can be active at a time. The machine performs different actions, by transiting from one state to another, triggered by fixed values. By adding the fuzzification to the state transitions, the states aren‘t solely triggered by binary values, however additionally by means that of fuzzy variables. Fuzzy membership values [12] are associated with the states at each time.
The FFSM defined (Q, U, f, Y, g), as quintuple,
Q is the state of the system.
U is the input vector.
f is the transition function which calculates the state of the system.
Y is the output vector.
g is the output function which calculates the output vector.
Fuzzy States (Q)
The state of the system (Q) is defined as a linguistic variable [3] that takes its values in the set of linguistic labels {q1, q2, . . . , qn}, with n being the number of fuzzy states, where fuzzy states represents the pattern of a repetitive situation and it is represented numerically by a state activation vector: n
S[t] = (s1 [t], s2 [t], . . . ,sn[t]), where si[t] ε [0, 1] si[t] = 1.
S0 is defined as the initial value of the state activation vector, i.e., S = S0[t = 0].
1915
of linguistic labels, A1ui = {A 1
ui,A 2
ui,. . . ,A n
ui}, with ni being the number of linguistic labels of the linguistic variable ui.
Transition Function (f): The transition function (f) calculates, at each time instant, the next value of the state activation vector:
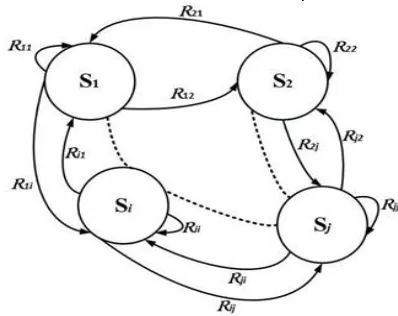
S[t + 1] = f (U [t], S[t]) (1) It is implemented by means of a fuzzy KB. Once the knowledge base has identified the relevant states in the model, One must define the allowed transitions among states. There are rules Rii to remain in a state qi, and rules Rij to change from state qi to state qj. If a transition is prescribed in the FFSM, it will have no fuzzy rules associated. Fig. 1 depicts about the Fuzzy Finite state Transition neatly how fuzzy rules exists.
A generic expression rule of a form is,
Rij : IF (S[t] is qi) AND Cij THEN S[t + 1] is qj (2) Where,
The first term in the antecedent (S[t] is qi) computes the degree of activation of the state qi in the time instant t, i.e., si[t]. With this mechanism, we only allow the FFSM to change from the state qi to the state qj (or to remain in state qi, when i = j).The second term in the antecedent Cij describes the constraints imposed on the input variables in disjunctive normal form (DNF) [10].
For example:
C12= (u1 [t] is A3u1) AND (u2 [t] is A4u2 OR A5u2) (3)
Finally, the consequent of the rule defines the next value of the state activation vector S [t + 1]. It consists of a vector with a zero value in all of its components but in sj [t], where it takes value one.To calculate the next value of the state activation vector (S[t + 1]), a weighted average using the firing degree of each rule k (ωk) is computed as defined in Equation 4,5.
( ) ∑ ( )
∑ ∑ (4)
( ) ( ) ∑ (5)
where, (ωk) is calculated using the minimum for the AND operator and the bounded sum for the OR operator.
Fig. 1 State Diagram of Fuzzy Finite State Machine
Output Vector (Y): Y is the output vector: (y1, y2, ...,yny ), with ny being the number of output variables.
Output Function (g): The output function (g) calculates, at each time instant, the next value of the output vector Equation 6:
Y [t] = f (U [t], S[t]) (6)
The most simple implementation of g is Y [t] = S[t].
4.
PROPOSED SYSTEM
4.1. Fuzzy Finite State Machine [FFSM] for Human activity Recognition Model.
In an FFSM, the state variables are defined as a set of linguistic variables Q= {q1, q2, q3… qn} where n is the number of fuzzy states. Here the fuzzy transition function used to map a current state in to next state upon input and attributing values of fuzzy intervals with in [0,1]. The membership value associated with each transition is called weight of the transition.
Fuzzy States:
In this simulation work, define six different fuzzy states with activities as follows:
{q1 →laying,q2 → sitting, q3 →standing, q4→walking, q5→walking upstairs, q6→ walking downstairs}
Input Vector: In these experiments [3], the embedded accelerometer and gyroscope, 3-axial linear acceleration and 3-axial angular velocity at a constant rate of 50Hz ax,ay, azwere the parameters. In order to distinguish between the six different states, created three linguistic variables {ax, mov, tilt} with these numerical values, ax is the acceleration as it was obtained from the sensor and mov measures the amount of movement. It is the sum of the difference between the maximum and minimum of ax, ay, and az, respectively, contained in an interval of 1 second, tilt is a variable that measures the tilt of the activity. It is calculated as the sum of the absolute value of the ay and az axial signal, i.e., |ay | + |az |.
Transition Function: The definition of transitions are allowed to calculate the next state vector S [t+1], at each time instant. The transition function f controls the allowed transitions between relevant states in the system. The rules define to be recognized that there are 64fuzzy rules overall in the system: 4 rules remain in each state and other 60rules to change between states.
Therefore, the RB (Rule Base) will have the following structure:
R11: IF (S[t] is q1) AND C11 THEN S [t + 1] is q1 R22: IF (S[t] is q2) AND C22 THEN S [t + 1] is q2 R33: IF (S[t] is q3) AND C33 THEN S [t + 1] is q3
…
R12: IF (S[t] is q1) AND C12 THEN S [t + 1] is q2 R21: IF (S[t] is q2) AND C21 THEN S [t + 1] is q1
…
R65: IF (S[t] is q6) AND C65 THEN S [t + 1] is q5 R64: IF (S[t] is q6) AND C64 THEN S [t + 1] is q4
Output Vector and Output Function
1916 Fig. 2: State Diagram for FFSM human activity
recognition.
5.2 Genetic Algorithm
Here, learning the KB (Knowledge Base) of the FFSM is designed for human activity recognition. This contains the linguistic label‘s membership functions (MFs) which collects the fuzzy if-then rules. Then fitness function is applied for calculation. Since the computation of the next state is based on the previous state, the tentative FFSM definition encoded in each over data set is evaluated, the Mean absolute error (MAE) measure has been chosen as fitness function, as defined in Equation 7:
∑ ∑ [ ]
Where:
n, number of states, i.e., n = 6.
T, dataset size (i.e., the considered time interval duration).
Si[j], degree of activation of state qi at time t = j.
Si*[j], expected degree of activation of state qi at time t = j.
The MAE directly measures the difference between the actual state activation vector (S [t]) and the obtained one (S[t]). However, define S [t] for each input data set that has to be learnt. This definition could be problematic and must be done carefully because, more than one state can be defined at each time instant, each of those states activated with certain degree in the interval [0, 1]. In the following subsection, this issue is explained in detail.
5.3 Particle Swarm Optimization
Particle swarm optimization is a population based stochastic optimization algorithm. In PSO algorithm the potential solutions, called particles, including weights and thresholds vectors fly through the problem space by following the current optimal particles. During training, after initializing PSO parameters using a group of random particles (solutions), optimal solution is achieved through the solution space [9]. Therefore, the velocity and position of the obtained optimal solution are updated according to its own experience and global cooperation. Despite regular PSOs converging rapidly on solutions, they may often become trapped within local maxima and minima [12]. To obviate this problem and improve its training capacity, an improved PSO algorithm is proposed. This improvement to the PSO algorithm is has been done by considering best and worst case particle positions. By
nature of the algorithm best case positions will gravitate towards the optimal positions, away from worst case positions [13]-[18].Individual particles in the swarm are represented by -dimensional position and velocity vectors contained in, the search space: Another "best" price that's half-track by the particle swarm optimizer is that the best price, obtained so far by any particle in the population. This best price could be a world best and referred to as gbest. When a particle takes a part of the population as its topological neighbors; the best value is a local best and is called lbest. After finding the 2 best values, the particle updates its velocity and positions with following Equation 8 and 9
[ ] [ ]
𝑐(
( )
( ) 𝑐
(
( )
( )
(8)[ ] [ ] [ ]
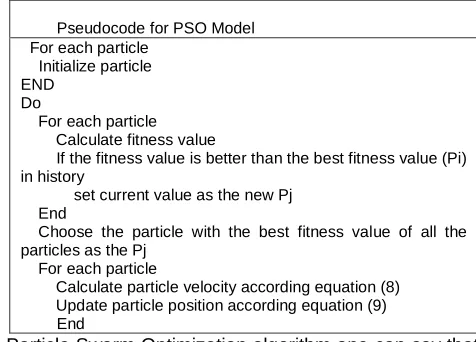
(9)V[] is the particle velocity, X[] is the current particle (solution). Pi[] and Pj[] are defined as stated above. r() is a random number between (0,1). c1, c2 are learning factors. Usually, c1 = c2 = 2.The pseudo code of the PSO procedure is depicted as follows. Here Particles' velocities on each dimension are clamped to a maximum velocity Vmax. If the total of accelerations would cause the rate of the velocity on that dimension to exceed Vmax, which is a parameter specified by the user, then the velocity rate on that dimension is proscribed to be Vmax, while the maximum iterations or the minimum error criteria isnot earned here.
Pseudocode for PSO Model For each particle
Initialize particle END
Do
For each particle Calculate fitness value
If the fitness value is better than the best fitness value (Pi) in history
set current value as the new Pj End
Choose the particle with the best fitness value of all the particles as the Pj
For each particle
Calculate particle velocity according equation (8) Update particle position according equation (9)
End
1917
setting parameters because it is too complicated to find the best setting of a desired application. So, we have to set first, several parameters of the PSO algorithm namely,
Position and velocity equations of particles
Number of particles in the search space
The Gbest fitness achieved.
Positions of particles having the best solution of all.
Number of iteration
In the beginning generate a random population after that search for the best solution after each iterations. Then, the particles update their positions using two best solutions. The first one is the best solution towards the problem and it is named « lbest ». The other optimal solution is followed by the PSO algorithm and obtained by any particles from the population and it is named « Gbest ».
Step0: Initialize parameters, signals and counters of PSO algorithm and goto S1
Step1: Generate initial population and their velocities using random generator and goto S2 or S3
Step2: Save positions and velocities value
Step3: Evaluate particles using fitness module and goto S4 or S5
Step4: Save evaluated value into
Step5: Test gbest If fit(i) <Global-best(i) then update Global-best and if the number of iteration is achieved then go to final state else go to State S7
Step6: Test lbest If fit(i) < local-best(i) then update local-best(i) then, go to S2 and return to state S4
Step7: Update particles positions and velocities
Step 8: Update the number of iteration if iteration not achieved then go to step S3 else go to final step (SF)
SF: Display the optimum solution.
Comparisons between Genetic Algorithm and PSO
Most of evolutionary techniques have the following procedure:
1. Random generation of an initial population
2. Reckoning of a fitness value for each subject. It will directly depend upon the gap to the optimum.
3. Reproduction of the population based on fitness values. 4. If requirements are met, then stop. Otherwise go back to 2.
From the procedure, one can learn that PSO shares many common points with GA.
Both algorithms begin with a gaggle of a willy-nilly generated population; both have fitness values to evaluate the population. Both update the population and explore for the optimum with random techniques. Both systems do not guarantee success. However, PSO doesn't have genetic operators like crossover and mutation. Particles update themselves with the internal velocity. They even have memory, which is important to the algorithm. Compared with genetic algorithms (GAs), the information sharing mechanism in PSO is significantly different. In GAs, chromosomes share information with each other.So the whole population moves sort of a one cluster towards an optimum space.In PSO, solely Pj(or lBest) offers out the knowledge to others.It is a one -way information sharing mechanism. The evolution only looks for the best solution.
Compared with GA, all the particles tend to converge to the best solution quickly even in the local version.
Neuro Fuzzy Finite State Machine (NFFSM)
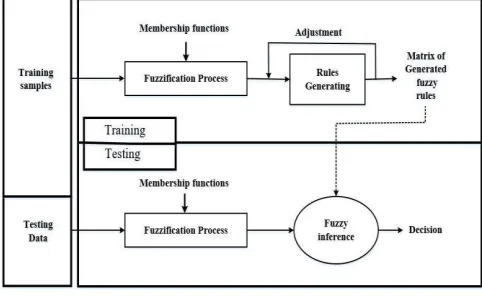
A common approach in incorporating learning capabilities into the fuzzy systems is based on the combination of fuzzy systems and Artificial Neural Networks (ANNs), also known as Neural Networks (NNs), leading to a widely known hybrid system known as a neuro-fuzzy system.Fuzzy rules area unit usually supported the numerical knowledge instead of experts‘ data. In this section, the fusion framework between FFSM and NNs is explained in the Figure Fig.3.
Fig. 3: Fusion Framework of NFFSM
The Recurrent Neural Network (RNN) model is used here to predict the classification for 6 activities. Recurrent Neural Networks (RNN) with sophisticated recurrent hidden units such as Long-Short-Term Memory (LSTM) depicted in figure Fig.4 unit has become popular choice for modeling time series data. Motivated from these recent successes, the proposed RNN architecture for the classification of human activity recognition dataset. Activity segment in the dataset consists of 7352 data samples. In order to facilitate RNN training, divided the long temporal sequence of sample of activity segments into 16 sub segments, each 128 samples long. Dropout is used in this architecture to avoid overfitting and softmax activation function is used in the output layer. The model achieved
classification accuracy of 93.3%.
Fig. 4: LSTM Model of SoftMax function
Data Acquisition
1918
(ADL) whereas carrying a waist-mounted Smartphone with
embedded mechanical phenomenon sensors
(accelerometer and Gyroscope). The classifying activities of labeled data can be 1.Walking, 2.Walking upstairs, 3.Walking downstairs, 4.Sitting, 5.Standing, 6.Laying. This dataset is collected from 30 persons (referred as subjects in this dataset), this experiment was video recorded to label the data manually. Both sensors generate data in 3 Dimensional spaces over time. Hence the information captured area unit '3-axial linear acceleration'(tAcc-XYZ) from measuring device and '3-axial angular velocity' (tGyro-XYZ) from rotating mechanism with many variations. Prefix‘t‘ in those metrics denotes time. Suffix ‗XYZ‘ denotes the 3-axial signals in X, Y, and Z directions. The available data is pre-processed by applying noise filters and then sampled in fixed-width windows (sliding windows) of 2.56 seconds each with 50% overlap. i.e., each window has 128 readings.
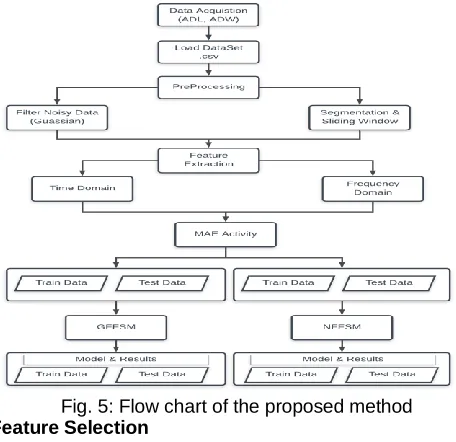
The method proposed in this work is illustrated in Figure Fig.5
Fig. 5: Flow chart of the proposed method
Feature Selection
The features selected for this database come from the accelerometer and gyroscope 3-axial raw signals tAcc-XYZ and tGyro-tAcc-XYZ. These time domain signals (prefix‘t‘ to denote time) were captured at a constant rate of 50 Hz. Then they were filtered using a median filter and a 3rd order low pass Butterworth filter with a corner frequency of 20 Hz to remove noise. Similarly, the acceleration signal was then separated into body and gravity acceleration signals (tBodyAcc-XYZ and tGravityAcc-XYZ) using another low pass Butterworth filter with a corner frequency of 0.3 Hz. Subsequently, the body linear acceleration and angular velocity were derived in time to obtain Jerk signals (tBodyAccJerk-XYZ and tBodyGyroJerk-XYZ). Also the magnitude of these three-dimensional signals was calculated using the Euclidean norm (tBodyAccMag, tGravityAccMag, tBodyAccJerkMag,tBodyGyroMag, BodyGyroJerkMag). Finally a Fast Fourier Transform (FFT) was applied to some of these signals producing fBodyAcc-XYZ, fBodyAccJerk-XYZ,fBodyGyro-XYZ, fBodyAccJerkMag, fBodyGyroMag, fBodyGyroJerkMag. (Note the 'f' to indicate frequency domain signals). These signals were used to estimate variables of the feature
vector for each pattern: '-XYZ' is used to denote 3-axial signals in the X, Y and Z directions.
The features used in the Experiment that were estimated from these signals were in following table 1:
Table 1 Features
Feature type Feature Description 1. mean ()
2. std() 3. mad() 4. max() 5. min() 6. sma() 7. energy()
8. iqr() 9. entropy() 10. arCoeff() 11. correlation(): 12. maxInds 13. meanFreq()
14. skewness() 15. kurtosis() 16. bandsEnergy
() 17. angle()
Mean Value Standard deviation Median absolute deviation Largest value in array Smallest value in array Signal magnitude area
Energy measure. Sum of the squares divided by the number of values I interquartile range
signal entropy
Autorregresion coefficients with Burg order equal to 4
correlation coefficient between two signals
index of the frequency component with largest magnitude
1. Weighted average of the frequency components to obtain a mean frequency
skewness of the frequency domain signal
kurtosis of the frequency domain signal Energy of a frequency interval within the 64 bins of the FFT of each window. Angle between to vectors
In order to further decrease the dimensionality of the extracted feature vectors, statistics over the set of the activity recognition were used. The following statistical features were used to represent the time-frequency distribution of the accelerometer and Gyro signals mentioned above, additional vectors obtained by averaging the signals in a signal window sample. These were used on the angle () variable: gravityMean, tBodyAccMean, tBodyAccJerkMean, tBodyGyroMean, tBodyGyroJerkMean. From the dataset, Y_Labels are represented as numbers from 1 to 6 as their identifiers.
WALKING as 1, WALKING_UPSTAIRS as 2,
WALKING_DOWNSTAIRS as 3, SITTING as 4,
1919
tBodyAccMagmean which is mean values of magnitude of acceleration in time space visualized.
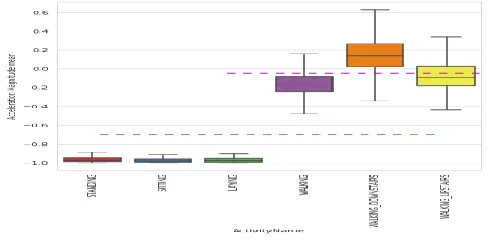
Fig. 6: Plot of both static and moving activities
Fig.7: Plot view of Dynamic activities
Fig. 8: Plot view static activities
The Magnitude of acceleration can separate it well by this Observation represents rule from features as follows, In Figure Fig.7. If tAccMean is < -0.8 then the Activities are either Standing or Sitting or Lying.If tAccMean is > -0.6 then the activities are either Walking or Walking Downstairs or Walking Upstairs .If tAccMean> 0.0 then the activity is Walking Downstairs. It has been classify with 75% of the activity labels with some errors.
Fig.9: Magnitude of acceleration
Position of Gravity Acceleration Component‘s also represents in the Fig.8. By Observation it represents IfangleX, gravityMean> 0 then Activity is Laying. We can classify all data points belonging to Laying activity with just a single if else statement.
Fig.10: Box Plot Position of laying activity gravity above position
Fig. 11: Box Plot Position of laying activity gravity below position
Feature Dimensionality Reduction with t-sne
T-1920
distributed Stochastic Neighbor Embedding (t-SNE) to visualize 561 dimension dataset is followed by Fig. 12
Fig.12: t-sne for perplexity 50 and max_iteration 1000
5.
Experimental Results and discussion
5.1. Dataset 1: Activity of Daily Working (ADW)
The Proposed work is tested using publically available HAR dataset1 [25]. The sample activity recognition activity from the dataset1 Activity of daily working (ADW) represents the reading of sample acceleration signals. The dataset collects data from a wearable accelerometer mounted on the chest. Uncalibrated Accelerometer Data are collected from 15 participants performing 7 activities. The dataset is intended for Activity Recognition research purposes. It provides challenges for identification and authentication of people using motion patterns. Here it classified7 activities of 15 subjects with single mount chest accelerometer, accelerometer signal reading of 15 subjects such as 1. Working in Computer, 2. Standing Up, Walking and Going up\down stairs, 3: Standing, 4: Walking, 5: Going Up\Down Stairs, Walking and Talking with Someone, 7: Talking while standing, is depicted in figure Fig.13 depicts about the box plot evolutionary design of Classification results of the models.
Dataset 2: Activity of Daily Living (ADL)
The publicly available HAR dataset Activity of daily living (ADL) used to classify the model of FFSM with activities of 8 is proposed here with following Machine learning and
GA_FFSM, PSO_FFSM and NEURO_FFSM were
displayed by confusion matrix. (Table 6.1) The test performance of the classifiers can be determined by the computation of specificity, sensitivity and total classification accuracy in equations 10, 11, 12.
Specificity: number of true negative decisions /number of actually negative cases.
Sensitivity: number of positive decisions / number of actually positive cases.
Classification Accuracy: number of correct decisions / total number of cases.
Whereas Specificity
C∑ tp tp fp
( )
Sensitivity ∑
(11) Classification accuracy ∑ tp (12)
Where N is the total number of events N = tpi + tni + f pi
+ f ni for i th
activity in the source data. C is the number of activities for which their accuracy, Sensitivity, and Specificity are calculated,
True Positive (TP): the case when ith activity is correctly recognized as being the ith activity
True Negative (TN): the case when all the other activities are correctly recognized as being not the ith activity.
False Positive (FP): the case when all the other activities are incorrectly recognized as being the ith activity.
False Negative (FN): the case when the ith activity is incorrectly recognized as being not the ith activity.
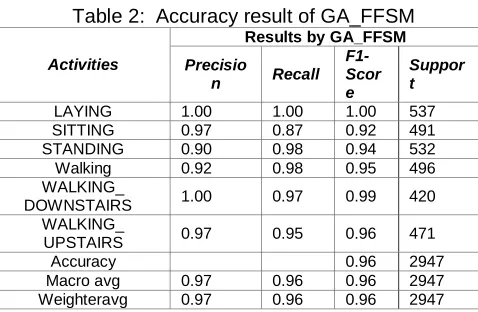
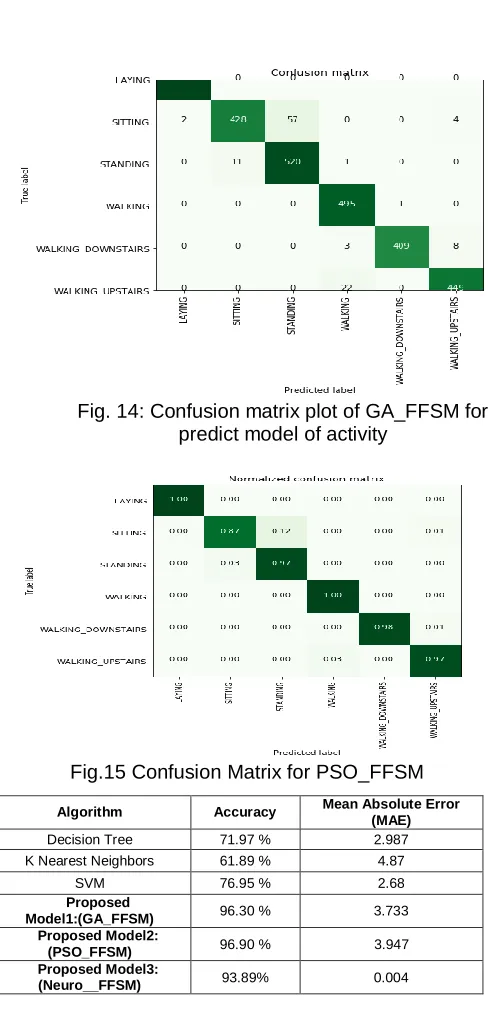
Experimental result shows an accurate classification performance of the proposed three models GA_FFSM, PSO_FFSM and Neuro__FFSM, gives more than existing decision tree, K Nearest Neighbors and SVM. Hence GA_FFSM was 96.30% and PSO_FFSM was 96.90% and Neuro__FFSM was 93.89%. PSO_FFSM was better than other models shown in table 5. The accuracy results of three models and normalized confusion matrix were depicted in Table 2 to Table 5 and in Figures Fig.14 to Fig.16.
Table 2: Accuracy result of GA_FFSM
Activities
Results by GA_FFSM
Precisio
n Recall F1-Scor e
Suppor t
LAYING 1.00 1.00 1.00 537 SITTING 0.97 0.87 0.92 491 STANDING 0.90 0.98 0.94 532 Walking 0.92 0.98 0.95 496 WALKING_
DOWNSTAIRS 1.00 0.97 0.99 420 WALKING_
UPSTAIRS 0.97 0.95 0.96 471
Accuracy 0.96 2947
Macro avg 0.97 0.96 0.96 2947 Weighteravg 0.97 0.96 0.96 2947 Fig.13: Box plots of x,y,z and class for the loaded subjects
1921 Fig. 14: Confusion matrix plot of GA_FFSM for
predict model of activity
Fig.15 Confusion Matrix for PSO_FFSM
Table 3: Accuracy result of PSO_FFSM
Table 4: Accuracy result of Neuro__FFSM
Activities
Results by PSO_FFSM
Precision Recall
F1-Score Support
LAYING 1.00 1.00 1.00 537
SITTING 0.97 0.87 0.92 491
STANDING 0.90 0.97 0.94 532
Walking 0.97 0.97 0.95 496
WALKING_
DOWNSTAIRS 1.00 0.97 0.99 420
WALKING_
UPSTAIRS 0.97 0.95 0.9 471
Accuracy 0.97 2947
Macro avg 0.97 0.97 0.97 2947
Weighteravg 0.97 0.97 0.97 2947
Neuro FFSM Model:
The Neuro FFSM with LSTM models need large amount of data to train properly, keras with tensor flow was used as backend and also need to be cautious not to over fit. For 128 reading 9 dimensions and 7352 samples of data. LSTM models require large amount of computing power. The following parameters are selected after experimental runs to get a good accuracy. Epochs = 30, batch size = 32, n_hidden = 128, pv = 0.25 # keep probability of dropout layer, With this simple model of 128 readings got 93.75% accuracy with loss of 0.22. Its normalized confusion matrix plotted in Fig.16 and accuracy results depicted in table 5.
Fig.16: Confusion Matrix for Neuro__FFSM Model
Table 5: Accuracy results of proposed model
Activities
Results by Neuro__FFSM
Precision Recall F1-Scor e
Support
LAYING 1.00 1.00 1.00 537
SITTING 0.91 0.81 0.86 491
STANDING 0.84 0.93 0.95 532
Walking 0.92 0.97 0.95 496
WALKING_
DOWNSTAIRS 0.97 0.89 0.93 420 WALKING_
UPSTAIRS 0.91 0.92 0.91 471
Accuracy - - 0.93 2947
Macro avg 0.92 0.93 0.93 2947 Weighteravg 0.93 0.93 0.93 2947
6.
CONCLUSION AND FUTURE WORK
The Proposed work presents the Evolutionary model Validation in HAR, classifying six different activities: Laying, Sitting, standing, Walking, Walking Upstairs and Walking downstairs. The main objective of this work is to choose the best combination of parameters to get the subset of features that best describes this HAR problem while the activity conditions are modeled at the same time. In this proposed work, feature Selection method to reduce the space dimensionality of features that differs from previous work has been explored. In keeping with this idea, a Hybrid Artificial Intelligent Method has been designed and applied. In the first stage, a filter is deployed to reduce the dimensionality by evaluating each feature with t-SNE (Distributed Nearest Neighbor Embedding). Then, the most important features were selected for the wrapper stage; a wrapper method using GA_FFSM,
Algorithm Accuracy Mean Absolute Error (MAE)
Decision Tree 71.97 % 2.987
K Nearest Neighbors 61.89 % 4.87
SVM 76.95 % 2.68
Proposed
Model1:(GA_FFSM) 96.30 % 3.733 Proposed Model2:
(PSO_FFSM) 96.90 % 3.947 Proposed Model3:
1922
PSO_FFSM is responsible for searching the best feature subset associated with each dataset and for model in the human activity. Finally, different models were used for validating the best parameters for features subset. The models GA_FFSM resulted with classification accuracy of 96.30%, PSO_FFSM with accuracy 96.90% and Neuro__FFSM with accuracy 93.89%. This shows better performance, compared to existing methods Decision tree, KNN, SVM. From those three proposed models, PSO_FFSM resulted with higher accuracy comparing to other models. Future work envisages the implementation of more stages in the Finite State Machine, easing the expert‘s reutilization of the present approach. Further research would be done to include others styles to tackle the learning for the fuzzy rule base of the GA_FFSM, PSO_FFSM and Neuro__FFSM models.
R
EFERENCES[1] Stefan Oniga, S. and Suto, J., 2014, May. Human activity recognition using neural networks. In Control Conference (ICCC), 2014 15th International Carpathian (pp. 403-406). IEEE.
[2] Du, Y., Wang, W., and Wang, L. (2015). ―Hierarchical recurrent neural network for skeleton based action recognition,‖ in Proc. IEEE Computer Society Conference on Computer Vision and Pattern Recognition (Boston, MA), 1110–1118
[3] Oukrich, Nadia, et al. "Activity recognition using back-propagation algorithm and minimum redundancy feature selection method." Information Science and Technology (CiSt), 2016 4th IEEE International Colloquium on. IEEE, 2016. (pp. 818-823
[4] Alberto Alvarez, GracianTrivino, Oscar Cordon, ―Human Gait Modeling Using a Genetic Fuzzy Finite State Machine‖. IEEE Trans. Fuzzy System. 2012, 20, 205–223.
[5] Narasimhulu, V.G. and Jilani, S.A.K., 2012. Back propagation neural network based gait recognition. Int. J. Comput. Sci. Inf. Technol, 3(5), pp.5025-5030.
[6] T.L.M. van Kasteren, G. Englebienne, and B.J.A. Kröse, ―Human Activity Recognition from WirelessSensor Network Data: Benchmark and Software‖, Chapter 8, Activity Recognition in Pervasive Intelligent Environments, Atlantis Press, 2011.
[7] H.Karamath Ali, D. I. George Amalarethinam, ―Activity recogntion with Multi-tape Fuzzy Finite Automata automata‖, I.J.Modern Education and Computer Science, 5, 60-65. 2013.
[8] Gadelhag Mohamed, A. L, Ahmed Lotfi, Amir Pourabdollah ― Human Activities Recognition based on Neuro-Fuzzy Finite state machine‖, Switzerland, MDPI, 17, 2018. [9] Basu. D, Giovanni Moretti, Gourab Sen Gupta, Stephen
Marshlands, ―Wireless Sensor Networks Based Smart Home: Sensor Selection, Deployment and Monitoring‖. IEEE Sensors Applications Symposium Proceedings, Galveston, TX, USA, February 2013; pp. 49–54.
[10]Langensiepen. C., Lotfi. A., Puteh. S,‖ Activities Recognition and Worker Profiling in the Intelligent environment using a fuzzy finite state machine‖, IEEE International Conference on Fuzzy Systems (FUZZ-IEEE), Beijing, China, 6–11 July 2014; pp. 873–880
[11]Alvarez-Alvarez, A., Trivino, G., Cordon. O, ―Body posture recognition by means of a genetic fuzzy finite state machine.‖ IEEE 5th International Workshop on Genetic and
Evolutionary Fuzzy Systems (GEFS), Paris, France, 11–15 April 2011; pp. 60–65
[12]Mohmed. G., Lotfi. A., Langensiepen. C.; Pourabdollah. A,‖ Unsupervised Learning Fuzzy Finite State Machine for Human Activities Recognition.‖ 11th Pervasive Technologies Related to Assistive Environments Conference, Corfu, Greece, 26–29 June 2018.
[13]Ignatov, Andrey ―Real time Human Activity Recognition from accelerometer data using Convolutional Neural Networks‖. Elsevier Inc. ―Application of Soft Computing‖ 2018, 62, 915– 922.
[14]Rodriguez-Benitez. L, C. Solena-cipres, J.Moreno-Gracia. ―Approximate reasoning and finite state machine to the detection of actions in video sequences‖, 2011, 52, 526-540., Elsevier Inc.
[15]Lu-An, T.; Jiawei, H.; Guofei, J. Mining Sensor Data in CyberPhysical Systems. Tsinghua Sci. Technol. 2015, 19, 225–234.
[16]Ben Mohammed, Anis.S, ―FPGA Implementation of Parallel Particle Swarm Optimization Algorithm and Compared with Genetic Algorithm‖, IJCSA, Vol.7 , No.8, 2016, 56-63. [17]B. Nakisa, Mohammed.N, ―Long Short Term MemoryHyper
Parameter Optimization for a Neural Network‖,IEEE Publications, September 2018.
[18]HuaijunWang,Ruomeng, JunhuaiLi,Yang An, KanWangand Lei Yu
[19] ―A correlation-based binary particle swarm optimization method for feature selection in human activity recognition", Internaational Journal of Distributed Sensor Network, Sage Article, Vol .No.14(4), 2018
[20]DavideAnguita, Alessandro Ghio, Luca Oneto, Xavier Parra and Jorge L. Reyes-Ortiz,‖ A Public Domain Dataset for Human Activity Recognition Using Smartphones‖, 21th European Symposium on Artificial Neural Networks, Computational Intelligence and Machine Learning, ESANN 2013. Bruges, Belgium 24-26 April 2013.
[21]Jorge Luis Reyes-Ortiz, Alessandro Ghio, Xavier Parra-Llanas, DavideAnguita, Joan Cabestany, Andreu Català.‖ Human Activity and Motion Disorder Recognition: Towards Smarter Interactive Cognitive Environments. 21th European Symposium on Artificial Neural Networks, Computational Intelligence and Machine Learning‖, ESANN 2013. Bruges, Belgium 24-26 April 2013.
[22]Huaijun Wang, Ruomeng, JunhuaiLi,Yang An, KanWangand Lei Yu ―A correlation-based binary particle swarm optimization method for feature selection in human activity recognition", Internaational Journal of Distributed Sensor Network, Sage Article, Vol .No.14(4), 2018
[23]DavideAnguita, Alessandro Ghio, Luca Oneto, Xavier Parra and Jorge L. Reyes-Ortiz,‖ A Public Domain Dataset for Human Activity Recognition Using Smartphones‖, 21th European Symposium on Artificial Neural Networks, Computational Intelligence and Machine Learning, ESANN 2013. Bruges, Belgium 24-26 April 2013.
[24] UCI Machine Learning- repository link address-https://archive.ics.uci.edu/ml/datasets/human+activity+reco gnition+using+smartphones.