1268
Predicting Financial Performance Of Selected
Listed Companies Through Discriminant Function
Analysis
Jayant, Vijay SinghAbstract: Indian economy, hitting a rough patch, slipped to 5% growth rate in the first quarter of FY20 which is the lowest in last six years, owing to sluggish demand, collapse of automobiles industry, mounting NPA, cautious approach by lending institutions, structural transformation and economic reforms etc. The economy blooms as the industry expands with sound financial health while the economy trembles if the financial statements of the companies predict tougher times ahead. Be it the slowdown or the boom, the stakeholders in the business keep continuously predicting the financial performance of the company to safeguard their vested interests. To survive today‘s volatile and vying environment, both business and its stakeholders need to be innovative and agile. But, no matter how efficiently planned and agile the business is, the key lies in accuracy and reliability of the information predicted in corporate and financial analyses. Which company or investment may give expected returns? How sound the operational and financial health of the company is? What financial information indicates high growth prospects and sound health of a company? Answers of all such crucial questions lie upon the accurate prediction and a correct set of predictors. This is even more tricky and subjective in nature to chose which variables are true or significant indictors among the plenty of information. There has always been debate upon the selection of different financial and managerial variables, and also upon the statistical tools adopted to shortlist such variables. The present study attempts to give a function of key financial ratios and financial indicators which are significant in predicting the financial performance of the companies. The Discriminant Function Analysis has been applied to derive the variate significant for the revenue of a company.
Keywords: Discriminant Function Analysis, Financial performance, GDP Ratio Analysis, Revenue, Shareholder‘s funds, Stakeholders Variate.
—————————— ——————————
1.
INTRODUCTION
The social life has always been multidimensional in nature, driven by immense needs and desires. But, the central economic adjustment of unlimited needs and limited resources is quite tricky as well as crucial in today‘s dynamic competitive environment. Moreover, planning as well as allocation of resources, while meeting the higher aspirations at all levels from an individual to organisational to national level, is itself an intricate exercise. Whether it‘s a firm or an individual, the primary objective is to survive the intense competition and uncertainties, and later to grow or achieve the heights. The business strives for the survival amidst unlimited range of unforeseen circumstances. Holding the grip firmly, the business then aims for achieving sky-scraping growth prospects. The business which is efficient in encashing the opportunities before it and fusing the potential threats, may make its vision a reality. But the business which fails to do so, it fails and may even collapse to insolvency. The business operates in vulnerable ecosystem where small or big, financial or managerial, relevant or irrelevant, microlevel or macroeconomic information has an impact upon its performance. In the ecosystem all the stakeholders, having vested interests in the business, continuously assesses the financial performance of the business and aim to ensure the expected returns or meet the desired goals. The business performance is affected by wide range of financial variables such as sales revenue, profitability, liquidity position etc.;
managerial factors such as board of directors and management capabilities, vision and leadership of top management, working culture etc.; operational factors such as production capacity, cost of production, logistics and efficiency related factors etc.; industry specific and macroeconomic variables etc. There have been different approaches adopted by the researchers or academicians to provide set of significant factors to related parties for making decisions. There is a wide range of financial ratios and other financial variables which present the position of a business in terms of profitability, liquidity, solvency and efficiency of the asset‘s utilisation. The pioneers in applying ratio analysis in predicting bankruptcy - Romser and Foster1 in 1931, found eleven key financial ratios which distinguished the successful companies with the failed ones. In 1959, Walter was the pioneer to derive the function predicting the corporate bankruptcy of industrial companies using the key earning- price ratios. The relevance of traditional ratio analysis gradually declined because of some transitional changes on two ends. With the passage of time, on one hand, the size of the business has grown exponentially and so the complexity or multidimensionality of the factors affecting the performance; and on other hand, there has been significant advancements in the statistical tools or techniques and their prediction accuracy. Across the globe, many academicians have worked upon wide range of statistical and econometric tools, from univariate to multivariate models to logistic regression models etc., to develop a set of variables which may assess, evaluate and predict the financial spectrum of companies operating at different levels across all sort of industries.
1.1. Literature Review
Beaver2 in 1966 and 1968 applied univariate technique with key financial ratios as tools to predict insolvency. He found Cash flow to Total Debt ratio to be the best predictor during a time period of five years preceding failure. Altman was the
————————————————
Jayant is working as Assistant Professor in Government College Chhara (Jhajjar) , India.
1269 first one to use multiple discriminant analysis, the significant
advancement over univariate analysis. Altman3 (1968) departing traditional ratio analysis, in his landmark paper used multiple discriminant analysis to predict corporate failure with a sample size of sixty-six companies, which discriminated between companies into two groups – non-bankrupt companies and non-bankrupt companies. Both groups- bankrupt and non-bankrupt companies, stratified randomly selected, were matched by various indicators such as industry, scale of operation, nature of business, scope etc. The MDA model included 22 variables- both financial and non-financial ratios to finally establishing Z function among five ratios. These ratios were retained earnings/ total assets, working capital/total assets, market value equity/book value of total debt, EBIT/ Total assets, and Sales/Total assets. The model correctly classified 95% of firms in predicting the bankruptcy. Altman, Halderman and Narayanan4 (1977) later gave the improved version and gave composite of seven variables called Zeta on the basis of study during the period of 1969-1975 having a sample of 111 companies of USA, Joy and Tollefson5 (1975), Moyer6 (1977), Kavery7 (1980), Bhattacharya8(1982), and many others tested the potency of Altman‘s Z score in different industries adopting the similar model of paired sample. Argeni9 in 1983 and Kip10 in 2002 found Altman model to be ineffective in prediction because of its limited scope. It was stressed to try out new models with more diversified sample for more accurate prediction. Appiah in 2011 followed Argenti‘s (1983) and Moyer‘s (1977) method in predicting financial distress on fifteen listed companies of Ghana. Based on paired sample the paper concluded that Z score misclassified manufacturing, food, retail and printing companies. Wijekoon and Azeezini11 in 2015 developed an integrated model in Sri Lanka for predicting insolvency or failure with more than 80% predictive accuracy. Three models were tried out- one model with financial ratios, second with corporate governance variables, and third model with both categories. Mihalovic12 (2016) compared prediction performance of two models estimated with discriminant analysis and logistic regression. The research was conducted on a sample of 236 firms operating in Slovakia the paper concluded that second model based on logit function outperforms classification accuracy of first one i.e. discriminant model. Another observation may be made from review of such studies is that majority of work has been done in developed nations (Beaver (1966); Altman(1968); Altman13(1973); Edmister14 (1972); Sinkey(151975); Deakin16 (1977); Aly, Barlow & Jones17 (1992)). The studies were limited to paired sample research design aimed at deriving the function at the time of insolvency. There is a need to develop the model in predicting financial performance of the companies- growing not stressed ones in developing nations like India. The present article attempts to develop a variate of such financial variables which are significant in predicting financial performance in terms of revenue. The model has been developed by using Discriminant Function Analysis with revenue as a dependent variable and key financial ratios and financial variables as independent variables. The study is aimed to derive a function from a set of 32 financial variables using Discriminant Function Analysis.
2.
METHODOLOGY
The research design of the present study is a multivariate correlational design having dependent variable (Revenue) as classificatory variable and independent variables (32 key financial variables) in interval scale. These variables have been selected based on rational theoretical framework and past researches, representing all the aspects of the business such as size of business, liquidity position, solvency- short term and long term, profitability, and market position. The sample size of the study was initially 270, selected by using multilevel stratified random sampling technique. The criteria for stratification was ET500 (Economic Times 500) of year 2017 published by Economic Times Intelligence Group, which follows an eightfold criterion to rank top 500 companies listed in Bombay Stock Exchange. These 500 companies were divided into three equal groups of 166 each based on ranks- High Revenue, Medium Revenue and Low Revenue. Finally, 90 companies from each group were randomly selected. The data for the study for the year 2017 was collected from CMIE ProwessIQ, India‘s one of the most comprehensive database of financial performance of the companies. The data collected was then prepared for the analysis which involved replacement of missing values using multiple imputation, fixing the outliers etc. through SPSS. The data was further transformed into normal distribution to meet the assumptions of the Discriminant Function Analysis. Discriminant Function Analysis is a statistical technique developed by Sir Robert Fisher to predict the grouping variable by two or more independent variables or predictors. The technique predicts the category to which an object must lie. In the present study, the technique gives a function of significant financial variables which predicts the category- High Revenue companies, Medium Revenue companies and Low Revenue companies, to which a company shall belong in comparison to priory classification.
2.1 The dependent variable- Revenue
The financial purpose of the company, may be measured in terms of many parameters such as sales revenue, total assets, net profit, operational efficiency, cash flows etc. Among these parameters revenue or net sales is undoubtedly one of the most prominent, as revenue indicates the potency of the business to create, sustain and to respond the prevailing demand in the market to overcome the cutthroat competition. Revenue may be defined as the gross inflows of cash, receivables or other consideration arising out of normal business operations during a period. In the present article, financial performance has been measured in terms of revenue of the company. Revenue has been taken as the dependent variable and categorical in nature which depends upon the assets size, operational efficiency, profitability, liquidity position etc ‗to encash the potential customers.
2.2 Independent Variables
1270 the basis of rational theoretical framework. In absolute
measure, some of the variables are total assets, net worth, enterprise value etc. while in relative measures, key financial ratios have been chosen fairly representing all dimensions of the business financial performance such as assets utilisation, liquidity, market position, return on investment, operational profitability etc. Finally, 31 financial variables were selected for the analysis. The univariate statistics of 270 companies showed that there is a significant number of missing values. Moreover, the data had higher degree of dispersion because of the nature of data. The technique of multiple imputation in SPSS was applied to replace the missing values of only those cases where missing values were less than 20% Thus, the cases which had 20% of the variables or more missing, and outliers traced through Mahalanobis Distances method, were eliminated from the study for better results. After analyzing the normal curve plots, it was found that data needed to be transformed into normal distribution using natural logarithms.
3.
DISCRIMINANT FUNCTION ANALYSIS
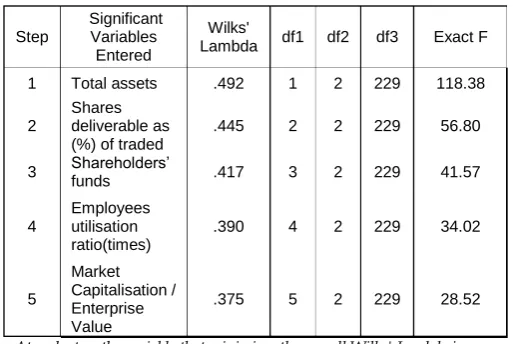
Discriminant function analysis predicts the classification of unknown values into some category by determining the factor coefficients of the predictor variables. For N number of categories, the technique estimates N-1 functions. There are two ways to derive the variate, one takes all independent variables together, while in other one, it takes independent variables stepwise to predict classification power of each variable. In the present study, Stepwise Discriminant Function Analysis has been used to derive two functions for three categories. The stepwise method starts with a model with no variables at the initial stage. At each step, the variables with the largest F value to Enter are added, which indicates the most significance in prediction of the model. The process is repeated to include the variables one by one in the model until the variables with F value to Enter greater than 3.84. The variables having F value to Enter less than 3.84 are not included as these variable failed tolerance level. The final model found five variables significant in predicting the revenue of a company under stepwise method of Discriminant Function Analysis.
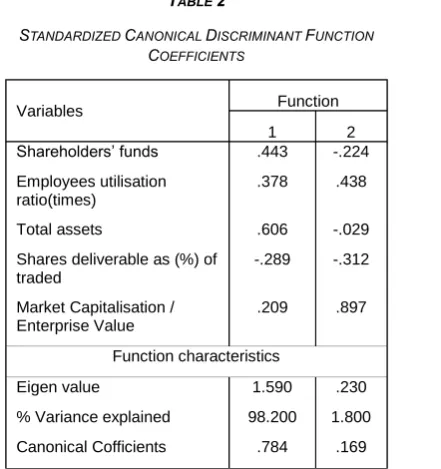
Table 1 shows the summary of stepwise method of discriminant function by entering and removing variables based on Exact F and Wilks‘ Lambda. The findings revealed five variables solution with significant contribution which were Total Assets, Shareholder funds, Shares deliverable as % of traded, Employees utilization ratio and Market capitalization/Enterprise value. Rest of 26 variables were removed as they failed to be significant. Since the discriminant function analysis with three dependent variables was used, there would be two functions. Table 2 shows the variables entered for both functions which were significant. The Eigen value and the percent variance in the table shows that Function 1 is the primary function explaining 98.2% variance. The canonical coefficients depict the relevance of the Function 1 is 0.784 while that of function 2 is 0.169. The variable of Total Assets loaded the highest with 0.606 on the function whereas shares deliverable as (%) of traded was a negative contributor of the function-1. On the other hand, the second function was mainly because of Market capitalization/Enterprise value
TABLE 1
STEPWISE STATISTICS OF FIVE SIGNIFICANT VARIABLES ENTERED
Step
Significant Variables
Entered
Wilks'
Lambda df1 df2 df3 Exact F
1 Total assets .492 1 2 229 118.38
2
Shares deliverable as (%) of traded
.445 2 2 229 56.80
3 Shareholders’
funds .417 3 2 229 41.57
4
Employees utilisation ratio(times)
.390 4 2 229 34.02
5
Market Capitalisation / Enterprise Value
.375 5 2 229 28.52
At each step, the variable that minimizes the overall Wilks' Lambda is entered.
a. Maximum number of steps is 60. b. Minimum partial F to enter is 3.84. c. Maximum partial F to remove is 2.71.
1271 with a loading of 0.897. It further revealed that Employee
utilization ratio was positively loading on this function.
The discriminant function analysis is such a technique which itself validates the variate by dividing sample into analysis sample and holdout sample. The model compares the priori probabilities with the probabilities of classifying the company based on the function derived.
TABLE 3
CLASSIFICATION RESULTS
Category
Predicted Group
Membership Total
1 2 3
Original
Count
1 60 11 0 71.0
2 8 51 27 86.0 3 0 18 57 75.0
%
1 84.5 15.5 0.0 100.0 2 9.3 59.3 31.4 100.0
3 0.0 24.0 76.0 100.0
Cross-validatedb
Count
1 58 13 0 71.0 2 8 50 28 86.0 3 0 19 56 75.0
%
1 81.7 18.3 0.0 100.0 2 9.3 58.1 32.6 100.0 3 0.0 25.3 74.7 100.0 a. 72.4% of original grouped cases correctly classified. b. Cross validation is done only for those cases in the analysis. In cross validation, each case is classified by the functions derived from all cases other than that case. c. 70.7% of cross-validated grouped cases correctly classified.
Table 3 shows the classification matrix of the function indicating the percentage of cases correctly classified into
three groups of High Revenue, Medium Revenue and Low Revenue. The table gives insights to analyze the percentage of cases which have been misclassified from the original distribution. The model correctly classified 84.5% of cases in group 1 of High Revenue while 15.5% cases were classified into Medium Revenue which belonged to high revenue category as per the prior distribution. In case of medium revenue category, the model misclassified around 40% of the cases. There were 8 companies of medium revenue group classified into high revenue category and 21 companies were classified as low income group. While predicting the category for low revenue companies, the model correctly classified 76% of the cases and misclassified 24% companies into Medium Revenue group. The model had 72.4% of total cases classified correctly to the category to which it belonged.
4.
CONCLUSION
The business operates in an ecosystem comprising of all the stakeholders, safeguarding their interests; controllable and uncontrollable forces; microeconomic and macroeconomic dynamics; ample opportunities and uncertainties. The perquisite for right understanding of all such multidimensional aspects is accurate forecast of the most relevant information. In the present study, the model derived using Discriminant Function Analysis has given five such financial indicators which are most significant in predicting financial performance of the company in terms of revenue. The five variables are Total Assets, Share deliverable as % of traded, Employees utilisation ratio, Shareholder funds and Market Capitalisation/Enterprise Value.
Total assets of any company, an aggregate of both current and non-current assets, is a true indicator of the operational and financial capacities or scale of operations. The business whose assets size expands, may achieve its objectives with sustainable growth.
The second variable contributing significantly in the variate is the Shares deliverable as % of traded shares. Deliverable shares are the inter day transactions in which shares(ownership) are transferred from one demat to other person‘s demat account. The variable indicates the market sentiments and investors‘ confidence in favor of the company in long term.
Employees utilisation ratio is the ratio representing the efficiency of the employees in performing the tasks assigned to them. Employees are one of the most valuable resources of any organisation. The financial health of organisation is affected by the employees in two ways. One, the resource utilisation and billable utilisation of the employees have a direct bearing upon the financial position. Other, the efficiency of the employees has indirect but greater impact, the absence of which may lead to bear very high costs- both money costs as well as opportunity costs.
Shareholders are the owners for whom the business comes into very existence, operates and grows. Shareholder funds is the amount or return which the shareholders may get from their TABLE 2
STANDARDIZED CANONICAL DISCRIMINANT FUNCTION
COEFFICIENTS
Variables Function 1 2 Shareholders’ funds .443 -.224
Employees utilisation ratio(times)
.378 .438
Total assets .606 -.029
Shares deliverable as (%) of traded
-.289 -.312
Market Capitalisation / Enterprise Value
.209 .897
Function characteristics
Eigen value 1.590 .230
% Variance explained 98.200 1.800
1272 investment. The business strives for maximising
the value of shareholder funds because of its widely acceptance as a parameter of profitability and solvency of the business.
Market Capitalisation to Enterprise Value is the market indicator which compares the market value of outstanding shares to the enterprise value of the company. Enterprise value is a comprehensive term used to calculate value which includes equity market capitalisation and total debt- short term and long term.
The variate is a combination of these five variables representing different aspects of the financial performance of the business i.e. scale of operations and the efficiency of the assets size, investment in long term, returns to shareholders, worth of the business etc. The variate correctly classified 72.4% of 232 companies among three groups – High Revenue, Medium Revenue and Low Revenue. The procedure followed in this study offers reliable model to predict financial health of business irrespective of the nature of industry. The results of the study having implications for watching or observing the variables of the variate for making investment decisions and predicting the revenue.
5. REFERENCES
[1] J.R. Ramser and L.O. Faster (1931), ― A Demonstration of Ratio Analysis‖, Bulletin no 4, Bureau of Business Research, University of Illinois.
[2] W. H. Beaver (1968), ―.Alternative Accounting resources as proctors of failure‖, The Accounting Review, vol 43, no 1, pp. 113-122.
[3] E. L. Altman (1968), ―Financial ratios, Discriminant analysis and prediction of corporate bankruptcy‖, The Journal of Finance, vol 23, no 4, pp., 589-609.
[4] E.L. Altman, P. Narayanan, and R.G. Halderman (1977, ―.Zeta analysis- A new method to identify bankruptcy risk of corporations‖, Journal of Banking and Finance, vol 1, no 1, pp. 29-51.
[5] M.O. Joy,and I.O. Tollefson (1975), ―On the financial applications of discriminant analysis‖ Journal of Financial and Quantitative Analysis, vol 10, pp.723-739.
[6] V,S, Kavery (1980), ―Financial Ratios as predictors of borrower‘s health: With special reference to small scale industries in India‖, Sultan Chand & Sons, Delhi. [7] R,C, Moyer (1977), ―Forecasting financial failure: A
re-examination‖, Financial Management, vol 6, no 1, pp. 11-17.
[8] C.D. Bhattacharya (1982), ―Discriminant Analysis between sick and healthy units‖, The Chartered Accountant, pp. 498-505.
[9] J. Argenti,(1983), ―Predicting corporate failure‖,
Accountants digest, Institute of Chartered Accountants in England and Wales, no 138, pp. 1-25.
[10]E.J. Kip (2002), ―Solvency evaluation, bankruptcy prediction and corporate re-structuring‖, Retrieved from http://www.solvency.com/bankpred.htm.
[11]N. Wijekoon, and A.A. Azeez (2015), ―An Integrated Model to predict corporate failure of listed companies in Sri Lanka‖, International Journal of Business and Social Research, vol 5, no 7, pp. 1-14 . retrieved from
https://thejournalofbusiness.org/index.php/site
[12]E.L. Altman (1973), ― Predicting railroad bankruptcies in America‖, The Bell Journal of Economics and Management Science, vol 4, no 1, pp. 184-211.
[13]E.L. Altman (1984), ―The success of business failure prediction models—An international survey‖, Journal of Banking and Finance, vol 8, no 2, pp. 171-198.
[14]Edmister, R. (1972). An empirical test of financial ratio analysis for small business failure prediction. Journal of Financial and Quantitative Analysis, 7(2), 147-193. [15]J.F. Sinkey (1975), ―A multivariate statistical analysis of
the characteristics of problem banks‖, Journal of Finance, vol 30, no 1, pp. 21- 31.
[16]E.B. Deakin (1972), ―A discriminant analysis of predictors of business failure‖, Journal Accounting of Researc, vol 10, no 1, pp. 167-179.
[17]J.M. Aly, H.A. Barlow, and R.W. Jones (1992), ―The usefulness of Sfas No. 82 (current cost) information in discriminating business failure: An empirical study‖,. Journal of Accounting, Auditing and Finance, vol 7, no2, pp. 217-229.
[18]L. Fisher (1959), ―Determinants of risk premiums on corporate bonds‖, The Journal of Political Economy, vol 67, no 3, pp. 217-237.
[19]K.O. Appiah (2011, ― Corporate failure prediction: Some empirical evidence from listed firms in Ghana‖, China-USA Business Review, vol 10, no 1, pp. 32-41.
[20]J. Baldwin, and G.W. Glezen,(1992), ‖Bankruptcy prediction using quarterly financial statement data.‖, Journal of Accounting, Auditing and Finance, vol 7, no 3, pp. 269-290.
[21]J.E. Walter (1959). ―A Discriminant Function for Earning Price ratios of large industrial corporations‖, The Review of Economics and Statistics, vol 41, no 1, pp.,44-52. [22]C. Casey, and N. Bartczak (1985), ―Using operating
cash flow data to predict financial distress: Some extensions‖, Journal of Accounting Research, vol 23, no 1, pp. 384-401
[23]R. Morris (1997), ―Early warning indicators of corporate failure: A critical review of previous research and further empirical evidence‖, Aldershot: Ashgate Publishing Ltd. [24]G.E. Pinches,and J.S. Trieschmann (1977),
―Discriminant analysis, classification results and financial distressed P-L insurer‖, .Journal of Risk and Insurance, vol 44,pp. 289-298.
[25]C.M. Daily and D.R. Dalton (1994), ―Corporate governance and the bankrupt firm: An empirical assessment‖, Strategic Management Journal, vol 15, no 8, pp. 643-654.
[26]http://www.etintelligence.com/etig/et500/et500.jsp [27]http://economictimes.indiatimes.com/markets [28]https://www.nseindia.com/