Reliability Analysis of Structural Beam Section Using First
Order Reliability Method (FORM)
P. Hari Prasad *1, M. Tirumala Devi2, T. Sumathi Uma Maheswari2 1CVR College of Engineering, Hyderabad, Telangana, India
2Department of Mathematics, Kakatiya University, Warangal, Telangana, India
ABSTRACT
Reliability is the ability of the structure to meet the construction requirements set under specified conditions during the service life, according which it is designed. It refers to the capacity, serviceability and durability of construction and according to them different techniques of reliability can be defined. In this paper the reliability index
is used to present the size of uncertainty in the theory of reliability. Two types of techniques are used to obtain the reliability index, which are First Order Reliability Method and Hosofer-Lind Method. The design of rectangular reinforced concrete section of beam is considered. The llablty and flexural failure caused by tension of the beam section are discussed. The methodology involved in determining the reliability to the design variables which are bending moment, cross sectional area, specified yield strength, specified compressive strength of concrete.Keywords: Structural reliability, First order reliability method, Hosofer-Lind method, Rectangular reinforced concrete section of the beam, Bending moment, Moment capacity.
I.
INTRODUCTION
Reliability is defined as the probability that a system performs its intended function without failure during a specified time period. The subject of structural reliability provides the tools and methodology to explicitly determine the probability of such failures by taking into account all relevant uncertainties. These techniques can be used to design new structures with specified reliabilities, and to maintain existing structures at or above specified reliabilities. The study of structural reliability is concerned with the calculation and prediction of the probability of limit state for engineering structures at any stage. Reliability is therefore the branch of structural engineering which is concerned with the analysis and probabilistic assessment of design random variables in order to predict whether specified limit state would be violated.
This paper determines the reliability index for the rectangular reinforced concrete section of the beams in flexural limit state by failure due to tension. The problem is formulated as reliability problem and concerns the reliability of the beam in flexure. Various parameters like, bending moment, cross sectional area, specified yield strength, specified compressive strength of concrete are modeled as random variables. First Order Reliability Method (FORM) and Hosofer-Lind Method are used to determine the reliability Index.
R.A.Canfield (2007) discussed reliability based structural design. Robert C.Wetherhold and Anthony M.Ucci used probability techniques for reliability analysis of composite materials. Stefan Conic, NemanjaMarkovic, Nikola Velimirovic and Nikola Stojic(2014) analysed reliability for timber structures. Abubakar Idris and Pius Edache(2007) evaluated the reliability of simple supported steel beams.
II.
STATISTICAL METHODOLOGY
If the system has a deterministic resistance (strength)
X, and a random applied load(stress) Y then the reliability of the system is the probability that the resistance is greater than the load, P(X>Y). Failure probability is the probability that the load is greater than the strength(Y>X). In the specific case of a Gaussian random variable the load Y can be reduced into standard normal variable y,
Y Y y
Y
Y Y
Y
y
(1)Where
Y is the mean of Y and
Y is the standard deviation of Y, then the Reliability of the system) (
) / ) ((
) (
y P R
y X
P R
y X
P R
Y Y
Y Y
(2) where
is the reliability indexIn the single variable case, this inequality is a safe region. This region is the set of values of y for which the structure will not fail. The probability of failure is the complement of the reliability.
) ( 1
1 R P y
Pf (3)
The probability of failure
P
f is the probability thatthe load is greater than the resistance, P(Y>X).Let )
(x
fX and fY(y) are the probability density functions of strength X and load Y then the distribution function F is defined by
) ( )
(y P Y y
FY = f u du
y
Y
)
( (4)
The probability of failure becomes
0
) ( ) ( )
(Y X F y f y dy
P
Pf X Y
0
) ( ) (
y
Y
X u f y dudy
f (5)
A. First Order Reliability Technique
Let (
X
1,
X
2,...
X
n) be the set of random variables(structural design variables) .The limit state equation for the failure surface of the structure is
0
)
,...
,
(
X
1X
2X
n
g
(6) Collapse of the structure or failure is defined by the failure condition as
g
(
X
1,
X
2,...
X
n)
0
.Probability of failure is
)
0
)
,...
,
(
(
1 2
nf
P
g
X
X
X
P
and the reliability ofthe system is
P
(
g
(
X
1,
X
2,...
X
n)
0
)
.Methods for the determination of this probability depend on the complexity of the limit state function. The limit state function is the limit at which the performance transits from acceptable to unacceptable. There are different types of limit states: strength or ultimate limit states, serviceability limit states, fatigue limit states, and extreme event limit states. The limit state function g is given as:
g = S – Q (7) In the above expression S and Q are random variables. S is the resistance (strength of the system) and Q is the load (stress).If g<0 it leads to breakage of the structure i.e failure and ifg 0then the structural reliability is high. In case of bending of beams S represents the ultimate moment capacity and Q represents the bending moment. In the case of serviceability limit state of deflection, S represents the maximum acceptable deflection and Q represents the deflection caused by the load.
random variables S and Q are reduced into SNV S1 and Q1:
S S S
S
S
S
S
S
11 (8)
Q Q Q Q Q Q Q
Q
1 1 (9))
(
)
(
S
1 S SQ
1 Q QQ
S
g
Q S
Q
S
S
Q
g
(
)
1
1
(10)
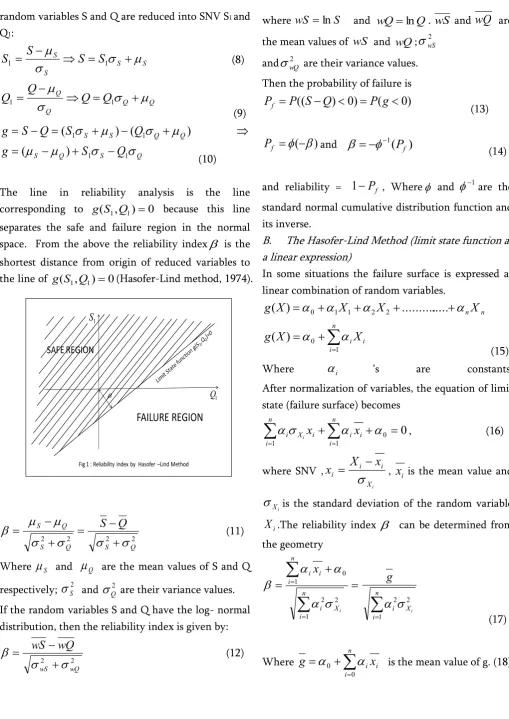
The line in reliability analysis is the line corresponding to g(S1,Q1)0 because this line
separates the safe and failure region in the normal space. From the above the reliability index
is the shortest distance from origin of reduced variables to the line of g(S1,Q1)0(Hasofer-Lind method, 1974).1 S 1 Q
FAILURE REGION
SAFE REGIONFig 1 : Reliability index by Hasofer –Lind Method
2 2 2 2 Q S Q S Q
S S Q
(11)
Where
S and
Q are the mean values of S and Qrespectively;
S2 and
Q2 are their variance values. If the random variables S and Q have the log- normal distribution, then the reliability index is given by:2 2 wQ wS wQ wS
(12)
wherewS lnS and wQlnQ. wS and
wQ
arethe mean values of wS and wQ;
wS2and
wQ2 are their variance values.Then the probability of failure is
)
0
(
)
0
)
((
P
S
Q
P
g
P
f (13))
(
fP
and
1(
P
f)
(14) and reliability =
1
P
f , Where
and
1are thestandard normal cumulative distribution function and its inverse.
B. The Hasofer-Lind Method (limit state function as a linear expression)
In some situations the failure surface is expressed as linear combination of random variables.
n n
X
X
X
X
g
(
)
0
1 1
2 2
...
...
n i i iX
X
g
1 0)
(
(15) Where
i ’s are constants.After normalization of variables, the equation of limit
state (failure surface) becomes
0
0 1 1
i n i i i X n ii i
x
x
, (16)where SNV ,
i X i i i
x
X
x
,x
i is the mean value andi
X
is the standard deviation of the random variablei
X
.The reliability index
can be determined fromthe geometry
n i X i n i i i i x 1 2 2 1 0
n i X i ig
1 2 2
(17)Where
ni i i
x
g
0
0
is the mean value of g. (18)C. The Hasofer-Lind Method (limit state is a nonlinear)
This is the simplest first order second moment reliability method (FOSMRM) used to evaluate reliability. This technique approximates the failure surface by a hyperplane tangent to the failure surface. Consider a limit state (failure surface) equation of random variables
X
1,
X
2,...
X
n .
n
i i
i i
X g x X g
X X
X g
1 2
1, ,... ) ( ) 0
(
(19)
Where
g
the mean value of g:g
g
(
x
i,
x
2,...
x
n)
The reliability index ,
n
i
i i
X
g
1
2
)
(
withi i
X
g
(20) The reliability index
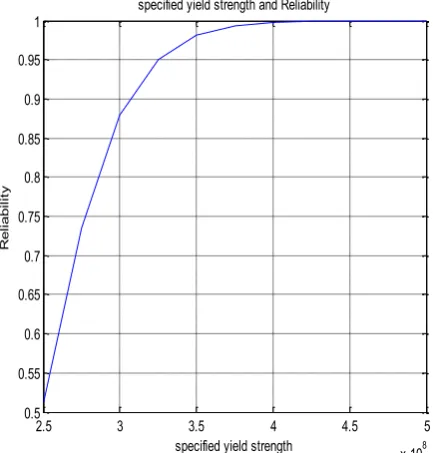
is a measure of reliability ofthe system. Table 1 shows the values of R for selected values of
, given in the limits that are applied in engineering.Table 1. Probability of success for selected value of reliability index
S.No
R1 1 0.81 2 1.5 0.9332 3 2 0.9772 4 2.5 0.99379 5 3 0.99865 6 3.5 0.999767 7 4 0.9999683 8 4.5 0.9999966 9 5 0.999999713 10 5.5 0.999999981
III.
FLEXURAL FAILURE OF A RECTANGULAR
REINFORCED CONCRETE SECTION OF THE
BEAM
The design of different rectangular reinforced concrete section of beam is considered. The main task of a structural engineer is the analysis and design of structures. The design of a section implies that the external moment is known, and it is required to compute the dimensions of an adequate concrete section and the amount of steel reinforcement. Concrete strength and yield of steel used are assumed. The dimensions and steel used in the section are given. It is required to calculate the ultimate moment capacity of the section.
The assumptions are made in flexural theory are (i) Plane section is remain same after bending.
(ii) Strain in concrete is the same as in reinforcing bars, provided that the bond between the steel and concrete is sufficient to keep them acting together under the different load stages i.e., no slip can occur between the two materials.
(iii)The stress-strain curves for the steel and concrete are known.
(iv)The tensile strength of concrete may be neglected. (v) At ultimate strength, the maximum strain at the extreme compression fiber is assumed to 0.003.The assumption of plane sections remaining plane (Bernoulli’s principle) means that strains above and below the neutral axis NA is proportional to the distance from the neutral axis.
A.Tension Failure
commences in the compressed region of the concrete. This type of failure, because it is initiated by yielding of the tension steel, could be referred to as a tension failure. hy 0.67hcu 003 . 0 cu Stress-strain curves b c d-c 003 . 0 cu a hy
section strain Actual stresses
d=0.5a D
T
Fig 2: Reinforced section when tension failure
Internal forces
In tensile failure
h
s
h
y; D=T;y s
h
B
T
andD
0
.
67
h
cuba
(21)From the above equation
ba
h
h
B
s y
0
.
67
cub
h
h
B
a
cu y s67
.
0
(22)The nominal strength of the cross section
N
u(capacity of the cross section) is
b h h B d h B a d T N cu y s y s u 34 . 1 ) 5 . 0 ( (23) where
B
s =cross sectional area,h
y =specified yieldstrength,
h
cu =specified compressive strength ofconcrete,
N
u= Ultimate moment capacity of the crosssection, d=distance between the steel reinforcement and the extreme compressive fiber, b= width of the section.
B. Reliability Calculations for Flexural Failure of a Rectangular Reinforced Concrete Section
The flexural limit state function for rectangular reinforced concrete section is
Q S
g (24)
Where S is the strength of the cross section (the Ultimate moment capacity that it can carry) and Q is the bending moment.
Q b h h B d h B g cu y s y
s
34 .
1 (25)
Design parameter’s variability: The application of the reliability model assumes that the covariances of the parameters are known so that the design parameter’s variability can be estimated. The coefficient of variance of specified yield strength is 10% to 12%.The cross sectional area has a coefficient of variance of 2 to 5%. The coefficient of variance of specified compressive strength of concrete is 10% -15%.The coefficient of variance of bending moment is 8%-10%.Table 2 shows the coefficient of variance of the design parameters.
Table 2. Summary of Design Parameter and Coefficient of variance
Design parameter Cov (%) Cross sectional area 2.17 Specified yield strength 11.5 Specified compressive strength of concrete
14.28
Bending moment 8
Consider the cross section area2.3103m2, specified yield strength is 350MPa, specified compressive strength 28MPa, bending moment is250103Nm, width of the section is 0.25 and d=0.42.
B
s,
h
s,
h
cu,
Q
are the random variables normally distributed having
mean and SDvalues:
B
s2
.
3
10
3m
2
; 200005
.
0
m
s B
;h
y
350
MPa
;
hy
40
MPa
;MPa
h
cu
28
;
hcu
4
MPa
;Q
Nm
3
10
200
;Nm
Q 310
16
.The mean value of the limit state function
Q b h h B d h B g cu y s y s 34 . 1 Nm 3 10 0142 . 69
The partial derivatives at the mean values are
m
N
B
g
X
g
s/
86925373
11
3 6
2
2
571
.
2
10
m
h
g
X
g
y
3 6
3
3
2467
10
m
h
g
X
g
cu
1
4
4
Q
g
X
g
The reliability index result is
n
i
i i
X
g
1
2
)
(
=2.3077
The reliability of the flexural rectangular concrete section and probability of failure are
Reliability=0.9896,
P
f
10
.
4
10
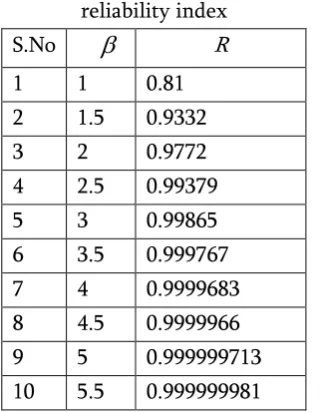
3.Table 3, shows the values of reliability index and probability of failure when cross sectional area, specified yield strength, specified compressive strength of concrete, distance and width of the section are constant and bending moment changing. It is observed that reliability decreasing as shown in fig 3. So that for the design of the structure, the bending moment should lies between 180000Nm and 280000Nm.
Table 3
Bending Moment is Increasing and other parameters keeping constant
Bs=0.0025,hs=350*10^6,hcu=28*10^6,d=0.42,b=0.25
Q
g
Pf R 180000 105876.8657 3.5137 1E-04 0.9999 190000 95876.86567 3.1411 0.0002 0.9998 200000 85876.86567 2.7766 0.0028 0.9972 210000 75876.86567 2.4203 0.0078 0.9922 220000 65876.86567 2.0725 0.0192 0.9808 230000 55876.86567 1.7333 0.0418 0.9582 240000 45876.86567 1.403 0.0808 0.9192 250000 35876.86567 1.0814 0.1401 0.8599 260000 25876.86567 0.7687 0.2216 0.7784 270000 15876.86567 0.4647 0.3228 0.6772 280000 5876.86567 0.1694 0.433 0.567Figure 3. Reliability and bending moment
From table 4, it is obtained the reliability index and probability of failure when bending moment, specified yield strength, specified compressive strength of concrete, distance and width of the beam are changing and cross sectional area is changing. It is observed that reliability is increased as shown in fig4.
Table 4
Cross sectional area is changing and other parameters keeping constant
hs=350*10^6,hcu=28*10^6,d=0.42,b=0.25,Q=220*10^3
Bs
g
Pf R0.0018 2286.5671 0.0816 0.4681 0.5319 0.0019 12154.4776 0.4248 0.336 0.664 0.002 21761.19 0.7457 0.228 0.772 0.0021 31106.71 1.046 0.148 0.852 0.0022 40191.044 1.3276 0.0926 0.9074 0.0023 49014.17 1.5918 0.0559 0.9441 0.0024 57576.1194 1.8397 0.033 0.967 0.0025 65876.8656 2.0725 0.0192 0.9808 0.0026 73916.41 2.2908 0.011 0.989 0.0027 81694.77 2.4953 0.0064 0.9936 0.0028 89211.9403 2.6866 0.0037 0.9963
1.8 1.9 2 2.1 2.2 2.3 2.4 2.5 2.6 2.7 2.8
x 105 0.55
0.6 0.65 0.7 0.75 0.8 0.85 0.9 0.95 1
Bending Moment
R
e
lia
b
ili
ty
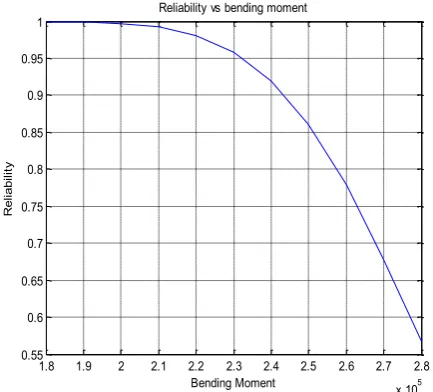
Figure 4. Reliability vs cross sectional area In table 5, when cross sectional area, specified compressive strength of concrete, distance and width of the section keeping constant and specified yield strength is increasing, it is observed that the reliability is increasing as shown in figure 5.
Table 5
Specified yield strength is increasing and other parameters keeping constant
Bs=0.0025,hcu=28*10^6,d=0.42,b=0.25,Q=220*10^3
hs
g
Pf R250*10^6 855.54371 0.0306 0.488 0.512 275*10^6 18360.20789 0.63357 0.2643 0.7357 300*10^6 35031.9829 1.1689 0.1215 0.8785 325*10^6 50870.8688 1.6462 0.05 0.95 350*10^6 65876.8656 2.0725 0.0192 0.9808 375*10^6 80049.9733 2.4527 0.0071 0.9929 400*10^6 93390.1919 2.79 0.0026 0.9974 425*10^6 105897.5213 3.0865 0.001 0.999 450*10^6 117571.9616 3.34279 0.0005 0.9995 475*10^6 128413.5128 3.5588 0.0002 0.9998 500*10^6 138422.1748 3.7341 1E-04 0.9999
Figure 5. Reliability vs specified yield strength
In table 6, When Distance between the steel reinforcement and the extreme compressive fiber is increasing and bending of beam, cross sectional area, specified yield strength, specified compressive strength of concrete keeping constant thenthe Reliability index is increasing as shown in figure 6.
Table 6
Distance between the steel reinforcement and the extreme compressive fiber is changing and other parameters keeping constant
Bs=0.0025,hs=350*10^6,hcu=28*10^6,b=0.25,Q=220*10 ^3
d
g
Pf R0.35 4626.8656 0.1721 0.4325 0.5675 0.37 22126.8657 0.7851 0.2177 0.7823 0.39 39626.8657 1.3399 0.0901 0.9099 0.41 57126.8657 1.8408 0.0329 0.9671 0.43 74626.8657 2.2924 0.011 0.989 0.45 92126.8657 2.6993 0.0035 0.9965 0.47 109626.866 3.0664 0.0013 0.9987 0.49 127126.866 3.3979 0.0012 0.9988 0.51 144626.866 3.6978 1E-04 0.9999 0.53 162126.866 3.9698 1E-04 0.9999
1.5 2 2.5 3
x 10-3 0.5
0.55 0.6 0.65 0.7 0.75 0.8 0.85 0.9 0.95 1
Cross sectional area
R
e
lia
b
ili
ty
cross sectional area and reliability
2.5 3 3.5 4 4.5 5
x 108 0.5
0.55 0.6 0.65 0.7 0.75 0.8 0.85 0.9 0.95 1
specified yield strength
R
e
li
a
b
il
it
y
Figure 6. Reliability vs d
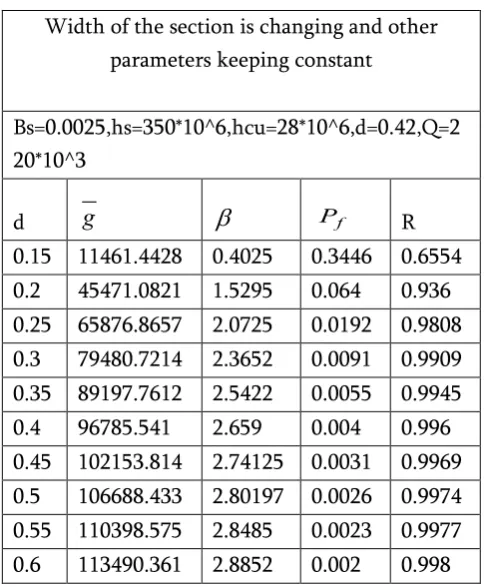
In table 7, when width of the section is increasing and rest are keeping constant, it is observed that the reliability index is increasing as shown in figure 7.
Table-7
Width of the section is changing and other parameters keeping constant
Bs=0.0025,hs=350*10^6,hcu=28*10^6,d=0.42,Q=2 20*10^3
d
g
Pf R0.15 11461.4428 0.4025 0.3446 0.6554 0.2 45471.0821 1.5295 0.064 0.936 0.25 65876.8657 2.0725 0.0192 0.9808 0.3 79480.7214 2.3652 0.0091 0.9909 0.35 89197.7612 2.5422 0.0055 0.9945 0.4 96785.541 2.659 0.004 0.996 0.45 102153.814 2.74125 0.0031 0.9969 0.5 106688.433 2.80197 0.0026 0.9974 0.55 110398.575 2.8485 0.0023 0.9977 0.6 113490.361 2.8852 0.002 0.998
Figure 7. Reliability when width of the section is increase
IV.
CONCLUSION
One of the best ways of representing the capacity, serviceability and durability of the structure in the theory of reliability is the reliability index
.Most of the engineering constructions consist of a system with connected components and its elements. When thinking about the reliability of the system, it is important to note that whether failure of the individual elements cause a failure of the entire structure.By using the Hasofer-Lind Method, the reliability of the structural design (A Rectangular Reinforced Concrete Section) was calculated for its capacity, durability and serviceability. Failure occurs due to the heavy bending moment of the rectangular concrete section. It is observed that if cross sectional area increased then the failure rate decreased. It is also observed that when the value of the other design parameters like specified yield strength, specified compressive strength of concrete, distance between reinforcement and the extreme compressive fiber and width of the section increased then the system reliability increased.
0.34 0.36 0.38 0.4 0.42 0.44 0.46 0.48 0.5 0.52 0.54
0.55 0.6 0.65 0.7 0.75 0.8 0.85 0.9 0.95 1
d
re
lia
b
ili
ty
Distance vs Reliability
0.1 0.15 0.2 0.25 0.3 0.35 0.4 0.45 0.5 0.55 0.6
0.65 0.7 0.75 0.8 0.85 0.9 0.95 1
width of the section
R
e
lia
b
ili
ty
Several factors must be considered in the structure to improve system reliability; those are security, usability, strength and flammability of construction.
The structure should be designed and implemented in such a manner that during its life cycle, with a certain degree of reliability, it will not collapse due to an explosion, shock, loads or human error.
V.
REFERENCES
[1]. Gunjan Agrawal and Baidurya Bhattacharya, "Partial safety factor design of rectangular partially pre- stressed concrete beams in ultimate flexural limit state", Journal of structural Engineering", volume 37, No.4, October-November 2010 pp.257-267.
[2]. T.micic,"Structural Reliability applications", Faculty of civil Engineering and architecture in University of Nis, Serbia 2012.
[3]. S.Choi, R.V.Gradnhi and R.A.Canfield,"Reliability based structural Design", Springer-Verlag London Limited, 2007. [4]. Robert.C.Wetherhold and Anthony M.Ucci,
"Probability Techniques for Reliability Analysis of composite Materials", Department of Mechanical and Aerospace Engineering, State university of Newyork.
[5]. StefanConic, Nemanja Markovic, Nikola Velimirovic and Nikola Stojic,"Reliability analysis of timber structures", Journal of faculty of civil Engineering. April 2014.Serbia.
[6]. AbubakarIdris and PiusEdache,"Reliability of simple supported steel beams", Australian journal of basic and applied sciences, 1(1):20-29, 2007.
[7]. Balaguruswamy, E., "Reliability Engineering", Tata McGraw-Hill, Publishing Company Limited, New Delhi, 1984.
[8]. Barlow R. E., "Theory of reliability: A historical perspective", IEEE Transactions on Reliability, vol. 33, pp. 16-20, 1984.
[9]. Kapur, K. C. and Lamberson L. R., "Reliability in Engineering design", John Wiley and Sons, Inc. U. K. 1997.
[10]. Marvin Raus and, Arnljot Heyland, "System reliability theory models, statistical methods and its applications", A John Wiley & Sons, Inc., Publication, 2004.
[11]. Choi, S., Gradnhi, R. V. and Canfield R. A., "Reliability based structural design", Springer-Verlag London Limited, 2007.
[12]. Antanas Kudzys and Romualdas Kliukas., "Reliability index design in Reinforced concrete structures of annular cross sections", ModernBuilding Materials and Techniques, the 10th International Conference, 2010, Lithunia. [13]. W.S.Lin, "The Reliability analysis of cutting
tools in the HSM processes" Archives of Materials science and Engineering. Volume 30, issue 2, April 2008, pp.97-100.
[14]. Gollwitzer, S. and Rackwitz R., Equivalent Components in First-order System Reliability. Reliability Engineering, Vol. 5, 1983, pp. 99-115.
[15]. Thoft-Christensen, P. and Baker M. J., "Structural Reliability Theory and its Applications.Springer-Verlag, Berlin -Heidelberg - New York, 1982.
[16]. Lloyd, D. K. and Lipow, M., "Reliability management methods and mathematical methods", Printice Hall, In., Englewood Cliffs, New Jersey, 1962.
[17]. Eryilmaz Serkan, "On Stress- Strength reliability with a time-dependent strength", Hindawi Publishing Corporation , journal of Quality and Reliability Engineering, vol.2013, Article ID 417818, 6 pages.