NBER WORKING PAPER SERIES INCENTIVES TO LEARN Michael Kremer Edward Miguel Rebecca Thornton Working Paper10971 http://www.nber.org/papers/w10971
NATIONAL BUREAU OF ECONOMIC RESEARCH 1050 Massachusetts Avenue
Cambridge, MA 02138 December 2004
The authors thank ICS Africa and the Kenya Ministry of Education for their cooperation in all stages of the project, and would especially like to acknowledge the contributions of Elizabeth Beasley, Pascaline Dupas, James Habyarimana, Sylvie Moulin, Robert Namunyu, Petia Topolova, Peter Wafula Nasokho, Owen Ozier, Maureen Wechuli, and the GSP field staff and data group, without whom the project would not have been possible. George Akerlof, David Card, Angus Deaton, Rachel Glennerster, Brian Jacob, Matthew Jukes, Victor Lavy, Michael Mills, Antonio Rangel, Joel Sobel, Doug Staiger, and many seminar participants have provided valuable comments. We are grateful for financial support from the World Bank and MacArthur Foundation. All errors are our own. The views expressed herein are those of the author(s) and do not necessarily reflect the views of the National Bureau of Economic Research.
© 2004 by Michael Kremer, Edward Miguel, and Rebecca Thornton. All rights reserved. Short sections of text, not to exceed two paragraphs, may be quoted without explicit permission provided that full credit, including © notice, is given to the source.
Incentives to Learn
Michael Kremer, Edward Miguel, and Rebecca Thornton NBER Working Paper No. 10971
December 2004
JEL No. I21, O15, C93
ABSTRACT
We report results from a randomized evaluation of a merit scholarship program for adolescent girls in Kenya. Girls who scored well on academic exams had their school fees paid and received a cash grant for school supplies. Girls eligible for the scholarship showed significant gains in academic exam scores (average gain 0.12-0.19 standard deviations) and these gains persisted following the competition. There is also evidence of positive program externalities on learning: boys, who were ineligible for the awards, also showed sizeable average test gains, as did girls with low pretest scores, who were unlikely to win. Both student and teacher school attendance increased in the program schools. We discuss implications both for understanding the nature of educational production functions and for the policy debate surrounding merit scholarships.
Michael Kremer Department of Economics Harvard University Littauer 207 Cambridge, MA 02138 and NBER [email protected] Edward Miguel Department of Economics
University of California, Berkeley 549 Evans Hall, #3880 Berkeley, CA 94720-3880 and NBER [email protected] Rebecca Thornton Department of Economics Harvard University Littauer 207 Cambridge, MA 02138 [email protected]
1. Introduction
This paper examines the impact of a merit scholarship program introduced in rural Kenyan primary schools. The scholarship program schools were randomly selected from a group of candidate schools, allowing us to attribute differences in educational outcomes between the program and comparison schools to the scholarship. Both student and teacher attendance increased in program schools. Girls in the
program schools had significantly higher test scores than comparison school girls. Moreover, test scores also increased for boys (who were ineligible for the scholarship), as well as for girls with low pretest scores, who had little chance of winning the prize.
The results have implications both for understanding the nature of educational production functions and for the policy debate surrounding merit scholarships.While most education research focuses on the effect of material inputs, class size, or school organization, the most important input in the education production function may be study effort. Our results suggest study effort is responsive to incentives. The increased attendance not only among initially high-scoring girls but also among boys, girls with low test scores, and teachers suggests that there may be strategic complementarity in effort choices. This could potentially be strategic complementarity between student effort and teacher effort, with the increases in effort by academically strong girls leading to an increase in teacher effort and that in turn causing other students to increase their effort. There could also be direct strategic complementarity between the effort choices of different students, as would be suggested by Lazear (2001), for example.
The findings also speak to the debate over merit scholarships. Historically, a high proportion of scholarships in many countries were merit-based. However, many educators have opposed merit
scholarships on equity grounds, fearing that benefits would disproportionately flow to pupils from better-off families (Orfield 2002). In the United States there was a dramatic move toward need-based awards during the 1960s and 1970s. While more than three-quarters of all state-funded college scholarships in the United States are now based on financial need, recently, however, there has been a resurgence in merit scholarships: merit funds have grown by almost 50% in the past five years (College Board 2002). In less developed countries, recent education finance reforms have focused on reducing the cost of education
across the board by eliminating primary school fees, as in Kenya, Cameroon, Ghana, Lesotho, Malawi, Rwanda, Tanzania, and Uganda (United Nations 2003), or by subsidizing primary school attendance, as in Mexico’s PROGRESA program or India’s school lunch program. However, for many of the poorest countries, it will be impossible to also provide free universal secondary schooling in the short run. In Kenya, for example, we estimate the cost of funding secondary school to the entire age cohort at 18 % of GNP (based on figures in World Bank 2004). In such circumstances merit scholarships may be worth considering.
Our finding of higher test scores for boys and for girls with low initial test scores suggests there may be positive classroom externalities to study effort. Such externalities would create a new rationale for merit scholarships. In our context, substantial externality benefits for students at the bottom of the
baseline test distribution suggests that merit scholarships would be justified even under a social welfare function that put no weight on test score gains for students in the top half of the distribution. Education externalities in production are often cited as a justification for government education subsidies (Lucas 1988). However, empirical studies suggest human capital externalities are small, if they exist at all (Acemoglu and Angrist 2000, Moretti 2004). Our results suggest it may well be that the largest positive externalities from investments in education occur earlier, within the classroom. The apparent strategic complementarity in student effort levels suggests that minor changes in exogenous factors could lead to large changes in effort. It also opens up the possibility of multiple equilibria in effort and educational outcomes. Several pieces of empirical evidence are consistent with the hypothesis of multiple equilibria in classroom culture, including the finding that conventional educational input measures explain only a modest fraction of the variation in student test scores (Summers and Wolfe 1977, Hanushek 2003).
We find little evidence supporting common criticisms of merit scholarships. The scholarship program does not appear to have led students to focus on test performance at the expense of other dimensions of learning. This stands in sharp contrast to another project conducted by the same non-governmental organization which provided incentives for teachers based on students’ test scores. That teacher incentive program had no measurable effect on either student or teacher attendance, but increased
the frequency of test preparation sessions known as “preps” (Glewwe et al. 2003). Students’ scores increased on the exam for which the teacher incentives were provided, but did not remain high afterwards. In contrast, in the merit scholarship program we study, both student school participation and teacher school attendance increased in program schools, test score gains remain large in the year following the competition, and there is no increase in the frequency of test preparation sessions.
There is also no evidence (from surveys of students) that program incentives weakened the intrinsic motivation to learn in school. While standard economic models suggest incentives should increase individual study effort, an alternative theory from psychology asserts that extrinsic rewards may interfere with intrinsic motivation and actually reduce effort.1 A weaker version of this view is that
incentives lead to better performance in the short-run, but have negative effects after the incentive is removed by weakening intrinsic motivation, but we find no evidence of this when we examine test scores in the years following the scholarship competition (or, at least, we find that any reduction in intrinsic motivation was offset by other factors). Similarly, there are no statistically significant changes in
students’ self-expressed attitudes toward school or toward their own academic ability, or in students’ time use outside of school, in the program schools.
The program was implemented in two districts, Busia and Teso. In Teso, the smaller of the two districts, the program was not as well received as in Busia, due in part to a lightning incident that occurred in Teso around the time the program was introduced. There was substantial attrition from the program in Teso, and attrition was asymmetric between program and comparison schools there, complicating causal inference. The preferred program impact estimates in Teso are also smaller than estimates in Busia. The main test score results are estimated across the entire sample, but we also use a variety of strategies to try
1 Early experimental psychology research in education supported the idea that reward-based incentives lead to
increased effort in students (Skinner 1961). However, laboratory research conducted in the 1970’s studied behavior before and after individuals received “extrinsic” motivational rewards and found that these external rewards produced negative impacts in some situations (Deci 1971; Kruglanski et al. 1971; Lepper et al. 1973). Later laboratory research attempting to quantify the effect of external factors on intrinsic motivation has yielded mixed conclusions: Cameron et al. (2001) conducted meta-studies of over 100 experiments and found that the negative effects of external rewards were limited and could be overcome in certain settings – such as for high-interest tasks – but in a similar meta-study Deci et al. (1999) conclude that there are usually negative effects of rewards on task interest and satisfaction. The current study differs from much of the existing work by estimating impacts in a real-world context rather than the laboratory, and by exploring spillover effects on third parties.
to estimate impacts in the presence of attrition in Teso, including non-parametric bounds on the treatment effect which take into account the possibility of bias due to sample attrition.
In the work most closely related to the current study, Angrist and Lavy (2002) find that cash awards raised test performance among 500 high school students in Israel. They examine a pilot
scholarship program that provided cash for good performance on matriculation exams in twenty schools. Students offered the merit award were approximately 6-8 percentage points more likely to pass their exams than comparison students in a pilot program that randomized awards among schools, with the largest effects among the top quartile of students at baseline. A second pilot which randomized awards at the individual level within schools (in a different set of schools) did not produce significant impacts.
This program differs from ours in several ways. First, due to political and logistical issues, the program in Israel and its evaluation, which was meant to run for three years, were discontinued after the first year, making it impossible to estimate longer-term impacts and impacts once the incentive was removed. Second, the sample in the current study includes more than three times as many schools as their pilot study, leading to more balanced program and comparison groups. Third, in addition to test score outcomes, we collected data on student school attendance, teacher attendance, purchases of school supplies, student time use, and a range of student attitudes which allow us to explore the mechanisms through which merit scholarships affect learning. Finally by examining a program in which girls’
scholarships were randomized at the school level, we are able to estimate externality impacts of increased student effort.2 Our results raise the possibility that the weak program impacts estimated in Angrist and Lavy’s second pilot could potentially be due in part to positive classroom externalities of student effort.
2 Leuven et al (2003) also use an experimental design, to estimate the effect of a financial incentive on the
performance of Dutch university students, but their small sample size limits statistical precision, complicating inference. Ashworth et al. (2001) study Education Maintenance Allowances (EMA), weekly allowances given to 16-19 year old students from low-income U.K. households based on school enrollment and academic achievement. Initial findings indicate that EMA raised school enrollment among eligible youth by 5.9 percentage points and by 3.7 percentage points among the ineligible, suggesting externalities. It is unclear how much of these impacts are due to rewarding students for enrollment versus achievement. Since program areas were not randomly selected – EMA was targeted to poor urban areas – the authors resort to propensity score matching to estimate impacts. Croxford et. al. (2002) find similar EMA impacts in Scotland. Angrist et al (2002) show that a Colombian program that provided private school vouchers to students conditional on their maintaining a satisfactory level of academic performance led
A number of studies suggest university scholarships increase enrollment (for instance, Dynarski 2003) though the few studies that examine the incentive effects of merit scholarships find mixed impacts. Binder et al. (2002) show that while scholarship eligibility in New Mexico increased student grades, the number of credit-hours students completed decreased, suggesting that students took fewer courses in order to keep up their grades. Similarly, after the HOPE college scholarship program was introduced the average SAT score for Georgia’s high school seniors rose almost 40 points (Cornwell et al. 2002), but it resulted in a 2% average reduction in completed college credits, 12% decrease in full course-load completion, and 22% increase in summer school enrollment (Cornwell et al 2003), thus undermining the program objective of increasing learning. But these potential distortions are not relevant in the setting we examine where courses and the curriculum are fixed.
The paper proceeds as follows. Section 2 provides information on schooling in Kenya and on the scholarship program. Section 3 discusses incentives, externalities, and study effort. Section 4 discusses the data and estimation strategy, section 5 presents the results, and section 6 compares the cost
effectiveness of merit scholarships to other programs. The final section concludes.
2. The Girls Scholarship Program
2.1 Schooling in Kenya
Schooling in Kenya consists of eight years of primary school followed by four years of secondary school. While most children enroll in primary school – approximately 85% of children of primary school age in western Kenya are enrolled in school (Central Bureau of Statistics 1999) – there are high dropout rates in grades 5, 6, and 7, about one-third finish primary school, and only a fraction of these students enter secondary school. The dropout rate is especially high for teenage girls.3
Secondary school placement, and to some extent admission, depend on performance on the government Kenya Certificate of Primary Education (KCPE) exam in grade 8, and students take that to academic gains, although it is unclear how much of this impact came from the expanded range of school choice participants experienced, and how much from the incentives.
3 For instance, girls in our baseline sample (in comparison schools) had a dropout rate of 9% from January 2001
exam quite seriously. To prepare for the KCPE, students in grades 4-8 typically take standardized exams at the end of each school year – although these exams are sometimes canceled, for example, due to teacher strikes or fears of election year violence. End-of-year exams are standardized for each district and test students in five subjects: English, geography/history, mathematics, science, and Swahili. Students must pay a fee to take the exam, US$1-2 depending on the year, and we discuss implications of this fee below. Kenyan district education offices have a well-established system of exam supervision, with “invigilators” from outside the school monitoring all exams, and teachers from that school playing no role in either exam supervision or grading. Invigilators document and punish all instances of cheating, and report these cases back to the district education office.
When the scholarship program was introduced (described below), primary schools in Busia and Teso districts charged school fees to cover non-teacher costs that included textbooks, chalk, and
classroom repair. These fees averaged approximately US$6.40 (KSh 500)4 per family each year. In
practice, while these fees set a benchmark for bargaining between parents and headmasters, most parents did not pay the full fee. In addition to this per family fee, there were also fees for particular activities, such as taking standardized exams (noted above), and families had to pay for their children’s school supplies, certain textbooks, and uniforms (the average uniform costs US$6.40). The scholarship project was introduced by the NGO in part, to assist families of high-scoring girls to cover these costs.
2.2 Project Description and Timeline
The Girls Scholarship Program (GSP) was carried out by a Dutch non-governmental organization (NGO), called ICS Africa, in two rural districts in western Kenya, Busia and Teso. Busia district is mainly
populated by a Bantu-speaking ethnic group (the Luhya) with agricultural traditions while Teso district is populated primarily by a Nilotic-speaking ethnic group (the Teso) with pastoralist traditions. These groups differ in language, history, and certain present-day customs, although not typically along observed household assets. The two districts were originally part of a single district which was partitioned in 1995.
ICS Africa is headquartered in Busia district, and most of its staff (including those who worked on the scholarship project) are ethnic Luhyas.
Half of the 127 sample primary schools were randomly invited to participate in the program in March 2001. The randomization was stratified by administrative divisions (divisions are subsets of districts, with eight divisions in Busia and Teso districts), and by participation in a past NGO assistance program which had provided classroom flip charts to some schools.5 Randomization was carried out using
a computer random number generator, and as we discuss below (Section 4) this procedure was successful at creating treatment groups largely comparable along observable characteristics.
The program provided incentives for students to excel on academic exams. The scholarship program provided winning grade 6 girls with an award for the next two academic years, grades 7 and 8 (through the end of primary school – the selection of winners is described below). In each year, the award consisted of: (1) a grant of US$6.40 (KSh 500) intended to cover the winner’s school fees and paid to her school; (2) a grant of US$12.80 (KSh 1000) for school supplies paid directly to the girl’s family; and (3) public recognition at a school awards assembly organized by the NGO. Although there was no
enforcement to make sure that parents spent the award money on school supplies, the fact that the money was presented to parents in a public ceremony is likely to have increased community pressure on them to use the money in ways that benefited their daughter’s education.6 Since many parents would not
otherwise have fully paid school fees, primary schools with winners benefited to some degree from the award money that paid winners’ fees. Some of the funds paid to the schools may have also benefited teachers, if they were used to improve the staff room or pay for refreshments for teachers, for instance, although the amounts dedicated to this were likely small.
5 All GSP schools had previously participated in an evaluation of a flip chart program, and are a subset of that
sample. These schools are representative of local primary schools along most dimensions, but exclude some of the most advantaged schools as well as some of the worst off – see Glewwe et al. (2004) for details on the sample. The flip chart program did not affect test scores.
6 It is impossible to formally test how the funding was actually spent without detailed household consumption
expenditure data, which we do not have. Note that there may be benefits for winners’ siblings because: (i) primary school fees were levied per household rather than per student, so the cost of schooling declined for siblings as well, and (ii) within household learning spillovers. We plan to estimate sibling impacts in future research.
Two cohorts of grade 6 girls competed for scholarships. Girls registered for grade 6 in January 2001 in program schools were the first eligible cohort (cohort 1) and those registered for grade 5 in January 2001 made up the second cohort (cohort 2), and they competed for the award in 2002. The NGO restricted eligibility to girls already enrolled in a program school in January 2001, before the program was announced. Thus there was no incentive for students to transfer into program schools, and incoming student transfer rates were low and nearly identical in program and comparison schools (not shown).
Cohort 1 students took end-of-year grade 5 exams in November 2000, and these are used as baseline test scores in the evaluation.7 In March 2001, the NGO held meetings with the headmasters of
schools invited to participate in the program to inform them of program plans and to give each school community the choice to participate. Headmasters were asked to relay information about the program to parents via a school assembly. Because of variation in the extent to which headmasters effectively disseminated this information, the NGO held additional community meetings in September and October to reinforce knowledge about program rules in advance of the November 2001 district exams. After the meetings, enumerators began collecting school attendance data during unannounced visits.
Students took district exams in November 2001, and each district gave a separate exam. Scholarship winners in grade 6 were chosen based on their total score across all five subject tests. The NGO then awarded scholarships to the highest scoring 15% of grade 6 girls in the program schools in each district (this amounted to 110 girls in Busia district and 90 in Teso). Schools varied considerably in the number of winners, but 57% of program schools (36 of 63 schools) had at least one 2001 winner; among schools with at least one 2001 winner, there was an average of 5.6 winners per school. The NGO then held school assemblies – for students, parents, teachers, and local government officials – in January 2002 to announce and publicly recognize the 2001 winners.
7 A detailed project timeline is presented in Appendix Table A. Unfortunately, there is incomplete 2000 baseline
exam data for cohort 2 (when these students were in grade 4), especially in Teso district where most schools did not offer the grade 4 exam in 2000, and thus baseline comparisons focus on cohort 1. Average 2000 scores for cohort 1 students are used to control for baseline differences across schools, as described below.
Scholarship winners differ from non-winners in some family background dimensions. Most importantly, average years of parent education is nearly three years greater for scholarship winners than losers (7.7 years for winners versus 4.8 years for non-winners), and this large effect is statistically significant at 99% confidence. However, there is no statistically significant difference between winners and non-winners in terms of household ownership of iron roofs or latrines (not shown), suggesting that children from wealthier households in terms of asset ownership were no more likely to win (though this remains somewhat speculative in the absence of detailed household consumption expenditure data). An alternative approach, in which an indicator for winning the award is regressed on household
characteristics, yields similar patterns.8
Children whose parents have more years of schooling are somewhat more likely to be in the top 15% of test performers in program schools than in comparison schools (regressions not shown). This is consistent with a model in which test scores depend on effort and family background (as well as other factors) and there is considerable heterogeneity in effort in the absence of a merit scholarship, but much less heterogeneity under a scholarship program. However, there are no robust differences across the top 15% (on the 2001 exams) of cohort 1 girls in program versus comparison schools in terms of observed household asset ownership or demographic characteristics.
The NGO visited all schools during 2002 to conduct unannounced attendance checks and administer questionnaires to grade 5-7 students. These surveys collected information on study effort, habits, and attitudes toward school (described below). Official exams were again held in late 2002 in Busia district. The 2002 exams in Teso district were canceled because of possible disruptions in the run-up to run-upcoming 2002 national elections and a threatened teacher strike, so the NGO instead administered standardized academic exams in February 2003. Thus the second cohort of scholarship winners were chosen in Busia district based on the official 2002 district exam, while Teso district winners were chosen based on the NGO exam. In this second round of the scholarship competition, 70% of the program
8 Baseline 2000 test score is a strong predictor of being a top 15% performer in both program and comparison
schools (44 of 63 schools) had at least one winner, an increase over 2001, and 78% of program schools had at least one winner in either 2001 or 2002.
The student survey data indicates that most girls understood program rules by 2002: 89% of cohort 1 and 2 girls in Busia district claimed to have heard of the program, and knowledge levels were similar in Teso district (86%). Girls had somewhat better knowledge about program rules governing eligibility and winning than boys: Busia girls were 7 percentage points more likely than boys to know that “only girls are eligible for the scholarship” (86% for girls versus 79% for boys), although the proportion among boys is still high, suggesting that the vast majority of boys knew that they were ineligible, and patterns are again similar in Teso district (not shown). Note that random measurement error is likely to be reasonably large for these survey responses, since rather than being filled in by an enumerator who individually interviews students, the surveys were filled in by students (at their desks) with the
enumerator explaining the questionnaire to the class as a whole; thus values of 100% are unlikely even if all students had perfect program knowledge. Girls were very likely (70%) to report that their parents had mentioned the program to them, suggesting some parental encouragement.
In late 2001 then-president Daniel Arap Moi announced a national ban on primary school fees, but the central government did not provide alternative sources of school funding and other policymakers made unclear statements on whether schools could impose “voluntary” fees. Schools varied in the extent to which they continued collecting fees, but it is difficult to quantitatively assess fee the extent to which fees were collected in 2002 given the political sensitivity of the issue. Mwai Kibaki became president of Kenya following the December 2002 elections, and eliminated primary school fees in early 2003. This policy was followed by primary school committees, in part because the national government made substitute payments to schools to replace local fees, financed by a World Bank loan. Even under the new policy, students’ families remained responsible for many school costs such as uniforms. This national policy change came into effect after the study period (which ended in February 2003), and is thus unlikely to have affected our results, although to the extent that households anticipated the policy shift, this would
have partially blunted program incentives. The NGO preserved the original program design even after the policy change, so continued to make payments to winners’ families and schools in 2003 and 2004.
Lightning struck a primary school in Teso district (Korisai Primary School, not in the GSP sample) in June 2001, severely damaging the school, killing seven students, and injuring 27 others. Because the NGO had been involved with another assistance program in that school, and due to strange coincidences – for instance, the names of several lightning victims were the same as the names of NGO staff members who had recently visited the school – the deaths were associated with the NGO in the eyes of some community members, and the incident led some schools to pull out of the program: of the original 58 sample schools in Teso district, five pulled out of the program at that time, and one Busia school located near the Teso district border also pulled out; Figure 1 presents the location of the lightning strike and of the schools that pulled out, four of which are located near the lightning strike. Three of the six schools that pulled out of the program were treatment schools, and three were comparison schools. Moreover, one girl in Teso district who won the ICS scholarship in 2001 refused the scholarship award (Figure 1). We discuss implications for econometric inference in Section 4 below.
Structured interviews were conducted during June 2003 with a representative sample of 64 teachers in 18 program schools, and these suggest there were stark differences in the reception of the program across Busia and Teso districts, perhaps in part due to the lightning strike. When teachers were asked to rate local parental support for the program, 90% of the Busia teachers claimed that parents were either “very positive” or “somewhat positive” toward the scholarship program, but the analogous rate in Teso was only 58%, and this difference across the districts is statistically significant at 99% confidence. Speaking in broad terms, a common perception in western Kenya is that the Teso community is less “progressive” than the Luhya community. Historically, Tesos were educationally disadvantaged relative to Luhyas, with fewer Teso than Luhya secondary school graduates, for example. Project survey data (described below) confirms this disparity between the districts: parents of students in Teso district have 0.4 years less schooling than Busia district parents on average. There is a tradition of suspicion of outsiders in Teso district, and this has at times led to misunderstandings between NGO’s and some people
there. It has also been claimed that indigenous religious beliefs, traditional taboos and witchcraft practices remain stronger in Teso than in Busia (Government of Kenya 1986), and this underlying cultural
environment may exacerbated to the negative community reaction there after the deadly lightning strike.
3. Incentives, Externalities, and Study Effort
A stylized framework illustrates several channels through which merit awards could affect academic test scores. The key behavioral change induced by a merit award is likely to be increased study effort. The program we study directly affected incentives for girls to exert study effort, since greater effort increased the probably they would win. Even though the monetary value of the award was identical everywhere, the local social prestige associated with the award may differ across communities due to variation in non-monetary benefits.9
Academic performance may also be a function of the study effort of other students in the class, since it may be easier to learn when classmates are also studious, and of teacher effort. Performance also depends on the child’s academic ability (or “human capital”), and this in turn may be a function of the past effort exerted by the child, by her classmates, and her teacher, as well as innate ability. We ignore other inputs into educational production (e.g., textbooks and chalk) in the discussion below for simplicity.
The efforts of a child and her classmates, and a child and her teacher could theoretically be either complements or substitutes. Similarly, own effort and current academic ability may be either
complements or substitutes, and thus own effort at one point in time may complement or substitute effort at other times. Yet it seems plausible that own effort, effort of other students, and teacher effort are complements in practice, in which case programs which increase effort by some students could generate multiplier effects in average individual effort. This opens up the possibility of multiple classroom equilibria, some with high effort by students and others with a poor overall learning environment.
9 Field interviews conducted by the authors in July 2002 indicate that girls actively competed for the scholarship.
One headmaster reported that the program “awakened our girls and was one step towards making the girls really enjoy school.” One winning girl who was asked about her own performance versus those students who did not win remarked, “they tried to work hard for the scholarship but we defeated them.” It is plausible that this spirit of competition drove some girls to work harder, providing utility benefits beyond the monetary awards.
Related arguments suggest that teachers in program schools should also exert more effort than teachers in comparison schools. If teachers experience benefits from having more winners in their class (e.g., ego rents, social prestige in the community, or even gifts from parents) then they should increase their work effort, for instance, by attending school more or improving their lesson plans. If there are complementarities to effort in educational production, teachers might also find coming to work (or more generally, exerting additional effort) more attractive when their students are also putting more effort into their studies.
Greater informal social sanctions against shirking teachers on the part of parents or the headmaster might also boost teacher effort, and such sanctions could differ across communities as a function of local parent support for the program. In that case, the merit award would generate larger gains where parents are more supportive, and this may account in part for the differences across Busia and Teso districts. The June 2003 structured interviews with teachers provide some evidence on how parental support may have contributed to program success in Busia. For instance, one teacher mentioned that after the program was introduced, parents began to “ask teachers to work hard so that [their daughters] can win more scholarships.” A teacher in a different Busia school asserted that parents visited the school more frequently to check up on teachers, and to “encourage the pupils to put in more efforts.”
Individuals in program schools who are ineligible for awards (i.e., boys), or who are eligible but have little realistic change to win (i.e., girls with low initial academic ability), might thus benefit from the program through several possible channels. First, greater effort by classmates competing for the merit award could improve the classroom learning environment and boost scores directly through a peer effect. Second, to the extent that student effort complements classmates’ and the teacher’s effort in educational production, even children without direct incentives might optimally exert additional effort, boosting average test scores through a multiplier effect. To illustrate, studying becomes more attractive relative to daydreaming in class if the teacher is present in the classroom, and one's classmates are also studying hard and learning (Lazear 2001). Third, all students could benefit from increased teacher effort, to the
extent this effort is not targeted solely to the girls with a good chance at winning a merit award.10 Of course, it is also possible that program school teachers could respond to the program by diverting effort from students who are not eligible for awards to students who were eligible, for example, by calling on girls more than boys in class, but we find no evidence of this below.
In the empirical work, we focus on reduced form estimation, in other words, the impact of the incentive program on test scores. We also estimate program impacts on multiple possible channels linking individual behavior to test scores – in particular, measures of student and teacher effort – to better
understand the mechanisms underlying the reduced form estimates.
4. Data and Estimation
4.1 The Dataset
Test score data were obtained from the District Education Offices (DEO) in Busia district and Teso district. Test scores were normalized in each district such that scores in the comparison school sample (girls and boys together) are distributed with mean zero and standard deviation one, the standard approach in the economic of education literature in order to facilitate comparison of results across studies. The complete dataset with both the cohort 1 and cohort 2 students enrolled in school in January 2001 is called
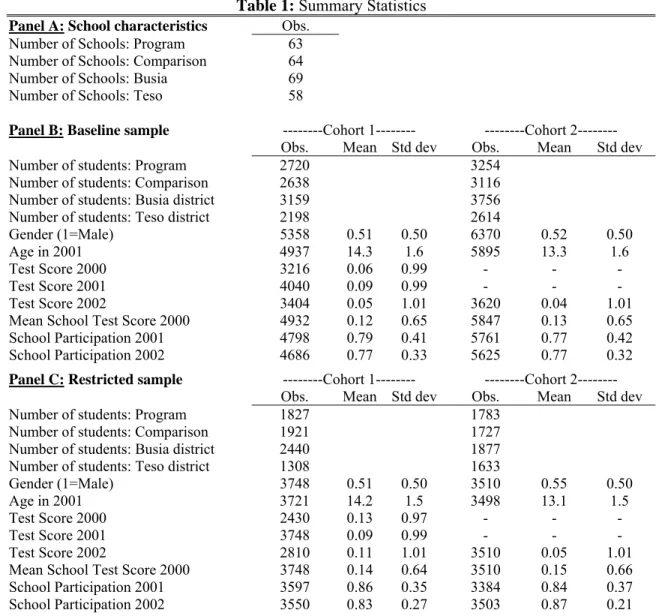
the baseline sample (Table 1, Panel B). In the main analysis, we focus primarily on students in schools
that did not pull out of the program and for which we have mean school baseline 2000 test scores, and call this the restricted sample (Panel C). Average test scores are slightly higher in the restricted sample than
in the baseline sample, since the students dropped from the sample are typically somewhat below average in terms of academic achievement, as discussed below. The longitudinal sample contains restricted
sample cohort 1 students with individual 2000 baseline test scores. Note that 2000 test scores are missing for most cohort 2 students in Teso district because many schools there did not view grade 4 exams as a priority and did not offer them, so we focus on the 2002 exam for cohort 2.
10 The July 2002 field interviews conducted by the authors suggest that a desire to compete with girls also drove
some boys to study harder. To the extent that this “gendered” competition was an important determinant of boys’ gains in program schools, it is an open question how large externality gains would be under an alternative program that targeted boys rather than girls, or in which they competed against each other for the same awards.
As discussed above, six of the 127 schools invited to participate decided to pull out of the
program following the lightning strike, leaving 121 schools. Five additional schools, three in Teso district and two in Busia, with incomplete exam scores for 2000, 2001 or 2002 were also dropped, leaving 116 schools and 7,258 students in the restricted sample. The restricted sample contains data for 91% of schools in the baseline sample. Students in program schools account for 51% of the restricted sample.
School participation data are based on four unannounced checks, one conducted in September or October 2001, and one in each of the three terms of the 2002 academic year. Collected by NGO
enumerators, these data record as “participants” those baseline students who were actually in school on the day of the unannounced check. School participation rates are somewhat below 80% for the baseline sample and approximately 85% for the restricted sample in both years (Table 1, Panels B and C). We use data from these unannounced checks rather than official school registers, since registers are often
unreliable in less developed countries. Finally, student surveys were collected in 2002 from all cohort 1 and cohort 2 students present in school at the time of data collection.
4.2 Estimation Strategy
The main estimation equation is:
(1) TESTist =Zist′
β
+(Zist*Ts)′γ
+δ
Xist +µ
s +ε
istTESTist is the test score for student i in school s in year t. Zist is a vector of demographic indicator
variables, for instance, for gender, or for each cohort and year (i.e., cohort 1 in year 1, cohort 1 in year 2, etc.), and Ts is an indicator for the program schools. In specifications where the goal is to estimate the
overall program impact across all cohorts and years, we exclude the Zist*Ts term and instead estimate the
coefficient estimate on the treatment indicator. Xist is the mean school baseline (2000) test score in
specifications using the restricted sample, and the individual baseline (2000) test score in specifications using the longitudinal sample. Error terms are assumed to be independent across schools, but are allowed to be correlated across observations within the same school. The disturbance terms consist of µs, a school
effect perhaps capturing common local or headmaster characteristics, and an idiosyncratic term, εist,
which captures unobserved student ability or shocks. We use similar methods to estimate impacts on behavioral channels (e.g., school attendance) potentially linking the program to test scores.
The non-parametric locally weighted regression technique (Fan 1992) allows us to estimate average program impacts across individuals with different baseline scores.
4.3 Sample Attrition
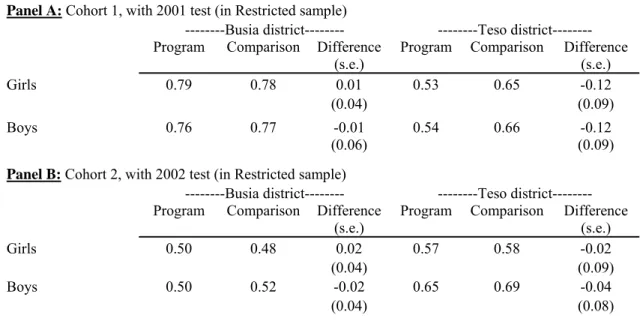
There are large differences in attrition across program and comparison schools in Teso district, but much less so in Busia district. For cohort 1, 79% of girls (76% of boys) in Busia program schools and 78% of girls (77% of boys) in comparison schools took the 2001 exam (Table 2).11 Thus there are small and
statistically insignificant differences between program and comparison schools in Busia. Among cohort 2 students in Busia, there is again almost no difference between the program school students and
comparison school students in the proportion who take the 2002 exam (50% versus 48% for girls, and 50% versus 52% for boys). For both program and comparison students, there is more attrition by 2002 as students drop out of school or transfer to other schools, or decide not to take the exam.
Attrition patterns in Teso district schools, however, are strikingly different. For cohort 1, 53% of girls in program schools (54% of boys) took the 2001 exam, but the rate for comparison school girls is much higher, at 65% (and similarly high for boys, at 66%, Table 2). Although these differences are not statistically significant at traditional confidence levels, they are large gaps. Attrition gaps across program and comparison schools in Teso are smaller among cohort 2 students. To perhaps understand why, recall that the 2002 district exams for Teso were canceled in the run-up to Kenyan national elections, and the NGO instead administered its own exam, modeled on the official government exam, in Teso in early 2003. Students did not need to pay a fee to take the NGO exam, unlike the government test, and this may account at least in part for different attrition patterns across the two cohorts.
11 The rates in Table 2 exclude schools that pulled out of the program entirely from the calculation, but differential
attrition patterns are even more pronounced using that data (not shown). We present program impact estimates using all 127 baseline schools in Table 5 Panel B below.
Non-parametric Fan locally weighted regressions – presenting the proportion of cohort 1 students taking the 2001 exam as a function of their baseline 2000 test score for cohort 1 – indicate that Busia district students across all levels of initial academic ability have a similar likelihood of taking the 2001 exam and remaining in the sample (Figure 2, Panels A and B). Although theoretically, the introduction of a scholarship could have induced poorer, but high-achieving students to take the exam in program
schools, leading to an upward bias, we do not find evidence of this in either Busia district or Teso district. Students with low initial ability are somewhat more likely to take the 2001 exam in Busia program
schools relative to comparison schools, and this difference is statistically significant in the left tail of the baseline 2000 distribution. This slightly lower attrition rate among low achieving Busia program school students may lead to a downward bias (toward zero) in estimated program effects there, but the figures suggest any bias is likely to be small.
In contrast, not only were attrition rates high and unbalanced across treatment groups for cohort 1 in Teso district, but significantly more high-achieving students took the 2001 exam in comparison schools relative to program schools, and this is likely to bias estimated program impacts toward zero in Teso (Figure 3, Panels A and B). To illustrate, among high ability girls in Teso with a score of at least +1 standard deviation on the baseline 2000 exam, comparison school students were over 20 percentage points more likely to take the 2001 exam than program school students, and this difference is statistically significant at 95% confidence over parts of this range. The comparable gap among high ability Busia girls is near zero and not statistically significant. There are similar though less pronounced gaps between comparison and program schools for Teso district boys (Panel B). Pooling boys and girls, in the Teso district program schools, students who did not take the 2001 exam scored 0.05 standard deviations lower at baseline on average (on the 2000 test) than those who took the 2001 exams, but the difference is 0.57 standard deviations lower in the Teso comparison schools, and the estimated difference in differences is significant at 95% confidence (regression not shown). These attrition patterns in Teso may be due to some high ability individuals in program schools feeling especially “vulnerable” to the program in communities
where there was mistrust of the NGO, since they were likely to win an award, and to the fact that several schools that pulled out of the program had high average baseline 2000 test scores.
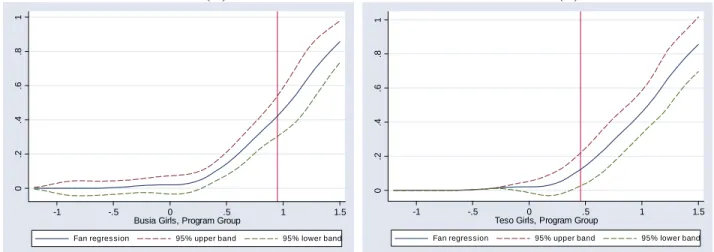
Individuals with high baseline 2000 test scores were much more likely to win an award in 2001 in both Busia and Teso districts, as expected: cohort 1 girls with below average baseline test scores had a miniscule change of winning (Figure 4), but the likelihood of winning rises rapidly and monotonically with the baseline score. The proportion of cohort 1 program school girls taking the 2001 exam as a function of the baseline score (Figure 2 Panel A and Figure 3 Panel A) does not correspond closely to the likelihood of winning a 2001 award in either study district, and this pattern, together with the high rate of 2001 test taking for boys and for comparison school girls, all suggest that competing for the NGO award was not the main reason most students took the test.
To summarize, Teso district primary schools had higher rates of sample attrition than Busia schools in 2001, the gap in attrition across the program versus comparison schools was large in Teso district but zero in Busia, and a much higher proportion of high ability students (according to baseline exam scores) took the exam in Teso district comparison schools than Teso program schools, likely biasing program impact estimates toward zero.
In what follows, we use the non-parametric bounding method in Lee (2002) to gauge the possible extent of attrition bias, and also impute test scores for students lost from the sample as a function of their baseline 2000 score to obtain another estimate of attrition bias. However, the attrition patterns in Teso district schools complicate the interpretation of program impact estimates there, and thus in the following analysis we focus on Busia district, where any bias from attrition is likely to be minimal.
4.4 Other Econometric Identification Issues
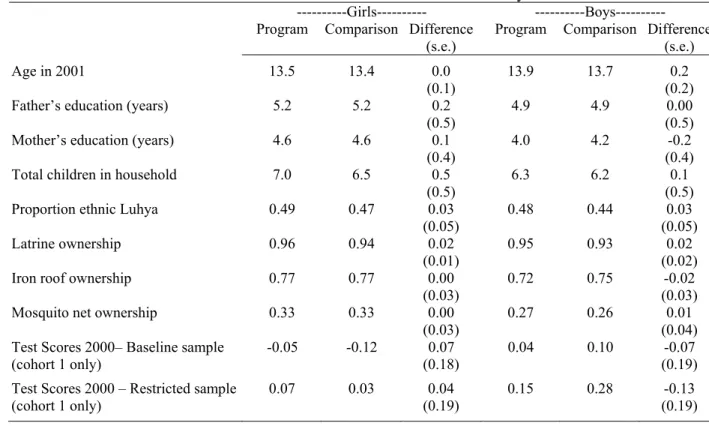
Household characteristics are similar across Busia district program and comparison schools (Table 3): there are no significant differences in parent education, number of siblings, proportion of ethnic Luhyas or the ownership of a latrine, iron roof, or mosquito net, using data from the 2002 student surveys, indicating that the randomization was largely successful in creating comparable groups. Unfortunately,
there is no comparable baseline survey data from 2001, but it is reasonable to assume that the
characteristics we examine, including parent education, fertility, ethnicity, and asset ownership, were stable between 2001 and 2002 and not considerably affected by the program.
The 2000 (baseline) test score distributions for cohort 1 provide further evidence on the
comparability of the program and comparison groups. Formally, we cannot reject the hypothesis that the mean baseline test scores are the same across program and comparison schools for either girls or boys. The distributions are similar graphically (Figure 5, Panels A and B), and we cannot reject the equality of the program and comparison school distributions using the Kolmogorov-Smirnov Test (p-value = 0.33 for cohort 1 Busia girls). Baseline characteristics are also similar across program and comparison schools in the Teso district restricted sample, but there are certain statistically significant differences across the groups, including for 2000 test scores (results not shown), likely due, in part, to the different attrition patterns across Teso program and comparison schools discussed above.
Another estimation concern is the possibility of cheating on the district exam in program schools, but this appears unlikely for a number of reasons. First, district records from external exam invigilators indicate there were no documented instances of cheating in any sample school during either the 2001 or 2002 exams. Several findings reported below also argue against the cheating explanation: test score gains among cohort 1 students in scholarship schools persisted a full year after the exam competition, when there was no longer any direct incentive to cheat, and there were substantial, though smaller, gains among program school boys ineligible for the scholarship, who had no clear benefit from cheating (although cheating by teachers could still potentially explain that pattern). There are also program impacts on several objective measures of student and teacher effort, most importantly, school attendance measured during unannounced enumerator school visits.12
12 Jacob and Levitt (2002) develop an empirical methodology for detecting cheating teachers in Chicago primary
schools, which relies on identifying classes where test scores rose sharply in a single year (the year of the cheating) and not in other years, and where many students had suspiciously similar answer patterns. Although we cannot examine the second issue, since we only have total test scores on the district exams, the finding of persistent test score gains in the year following the competition argues against cheating as an explanation for our main result.
A final issue is the Hawthorne effect, namely, an effect since students knew they were being studied rather than due to the particular intervention, but this too is unlikely for at least two reasons. First, both program and comparison schools were visited frequently to collect data, and thus mere contact with the NGO and enumerators alone cannot explain differences across the groups. Moreover, five other primary school program evaluations have been carried out in the study area (as discussed in Section 6), but in few cases do these other programs lead to substantial changes in student behavior and outcomes.
5. Empirical Results
5.1 Academic Test Score Impacts
We first present graphical evidence on program test score impacts, and then regression estimates.
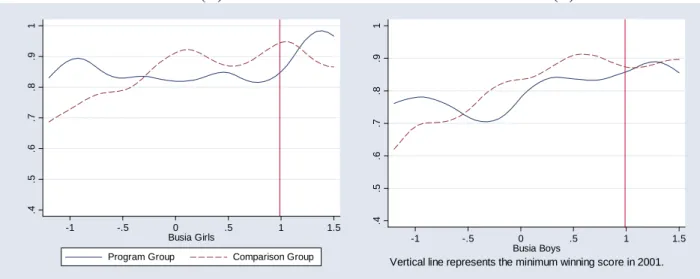
Baseline 2000 test score distributions are similar across program and comparison schools in Busia district, for both girls and boys (Figure 5). The test score distribution in program schools shifts markedly to the right for cohort 1 girls and boys in the first year of the program (Figure 6), cohort 1 girls and boys in the year post-competition (Figure 7), and for cohort 2 girls and boys in year 2 when they were competing for the scholarship (Figure 8).13 The vertical lines in these figures indicate the minimum score necessary to
win an award by year. The sample for Figures 5, 6, and 7 is the cohort 1 longitudinal sample, namely, those restricted sample students who have 2000 individual test scores – and thus the sample in Figures 5 and 6 is identical, although sample size falls somewhat for the 2002 results presented in Figure 7. The sample for Figure 8 consists of cohort 2 restricted sample students.
In the case of Busia girls, the largest gains appear to be most pronounced for students at two parts of the distribution: first, for those near the minimum winning score threshold – consistent with the view that students exerting the most additional effort were those who believed extra effort would make the greatest difference in their chances of winning – and second, in the left tail of the distribution (Figure 6 Panel A). Test gains do not appear as large visually for boys, but there are perceptible shifts in both the left and right tails of the program school distributions (Figure 6 Panel B).
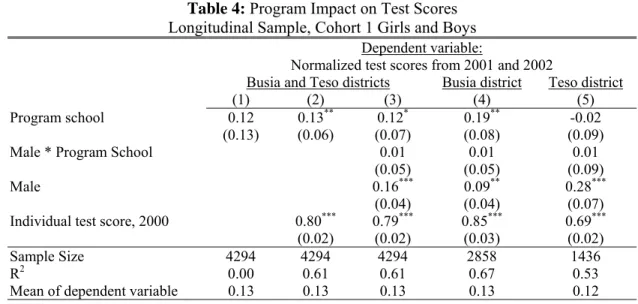
We first focus the regression analysis on the cohort 1 longitudinal sample (the same sample included in Figures 5 and 6 above). The program raised test scores by 0.12 standard deviations on average among girls and boys in 2001 and 2002, among all Busia and Teso district students from both cohorts (Table 4, regression 1). The average impact rises slightly to 0.13 standard deviations (standard error 0.06, regression 2) and becomes statistically significant at 95% confidence when the individual baseline 2000 test score is included as an explanatory variable, as this baseline control reduces residual variation. The 2000 test score is strongly related to the 2001 test score as expected (point estimate 0.80, standard error 0.02). The estimated impact of the program is nearly identical and statistically significant for both girls and boys overall for both Busia and Teso schools (regression 3). Note that boys score much higher than girls on average, with a gender gap in the longitudinal sample of 0.16 standard deviations (standard error 0.04) even with the inclusion of the individual baseline test control, suggesting a widening gender gap.
The estimated impact in the longitudinal sample is considerably larger for Busia district (0.19 standard deviations, standard error 0.08, Table 4, regression 4) than for Teso district (-0.02, standard error 0.09, regression 5). This is consistent with the hypothesized sample attrition bias in Teso district. Program impact point estimates increase slightly in both districts when the individual baseline test control is not included as an explanatory variable (in a specification analogous to Table 4, regression 1), but standard errors increase sharply: the estimate for Busia district schools is 0.22 standard deviations (standard error 0.19) and for Teso becomes positive but small at 0.08 standard deviations (standard error 0.15 –
regressions not shown).
We next construct non-parametric bounds on program effects using the trimming method
developed in Lee (2002). The bounds for Busia schools are tight since there was essentially no differential attrition across program groups there (Table 2), but the bounds for cohort 1 girls in Teso district are wide, ranging from -0.24 standard deviations as a lower bound up to 0.22 standard deviations as an upper bound (in a specification analogous to Table 4, regression 5). Using this conservative method, it is difficult to draw conclusions about program treatment effects in Teso district.
In an attempt to better estimate the likely bias due to sample attrition, we imputed missing 2001 test scores among longitudinal sample students as a linear function of their 2000 score. This exercise suggests that program impacts for cohort 1 girls in Teso district in the absence of attrition would have been positive and reasonably large: the estimated impact for Teso district girls using the imputation for missing data becomes 0.12 standard deviations (standard error 0.14 – regression not shown) when the individual baseline 2000 score is not included as a control. However, this estimate is only suggestive given the likely omitted variable biases. Another approach for addressing sample attrition bias in Teso district is to focus on impacts for cohort 2, since attrition patterns are similar in cohort 2 for Teso program and comparison schools (Table 2), although we unfortunately cannot determine the exact attrition patterns for cohort 2 due to the lack of baseline 2000 data for them. The estimated program impact among cohort 2 Teso district girls in 2002 is near zero and not statistically significant (estimate 0.00 standard deviation, standard error 0.11 – regression not shown), evidence that program impacts were negligible.
Whatever interpretation is given to the Teso district results – either no actual program impact, or simply unreliable estimates due to attrition – the fact remains that the program was less successful in Teso at a minimum in the sense that fewer schools chose to take part. It remains unclear whether the problems encountered in Teso district would have arisen in the absence of the lightening tragedy of 2001, and whether they would arise in other settings.14 Thus while we cannot rule out that the program had a moderate positive impact in Teso, the high and unbalanced attrition in Teso district makes it difficult to draw firm conclusions. Despite this, however, analyses estimating the Busia and Teso pooled program effects yield overall positive and significant coefficents.
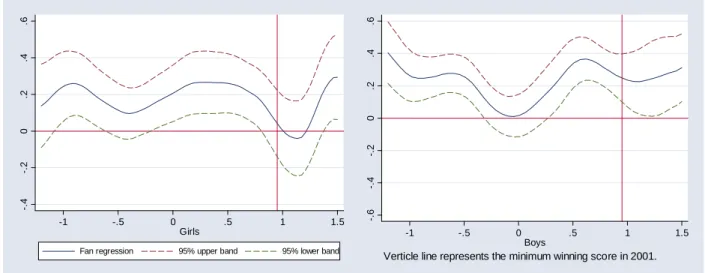
Program effects at different regions of the initial 2000 test score distribution are estimated using a non-parametric Fan locally weighted regression (with bootstrapped standard errors clustered by school,
14 To potentially disentangle the effect of being in a Teso district school from the effect of the lightning strike (in a
specification that pools the Busia and Teso data for girls and boys of all cohorts), we included an indicator variable for Teso district, and an interaction of the Teso indicator with the program indicator, as well as an indicator for schools located with 6 km of the lightning strike, and the interaction of this distance term with the program indicator: the coefficient estimate on the lightning distance and program indicator interaction term is negative but not statistically significant (-0.05, standard error 0.09 – regression not shown), while the coefficient estimate on the Teso-program interaction term remains negative and significant. Still, these results do not rule out that program impacts in Teso district might have been positive in the absence of the lightning strike.
Figure 9). Busia girls just below the winning threshold had large test score gains, as suggested by the previous figures, and there are also marked and statistically significant gains at the bottom of the baseline distribution among girls (Figure 9 Panel A). This is evidence of positive spillover benefits of the program since girls with below average baseline scores have essentially zero chance of winning (Figure 4 Panel A), and so their gains are unlikely to be the results of attempts to win the award. It is impossible to reject the hypothesis that program impacts at the bottom of the baseline distribution are the same as gains elsewhere, however, due to limited statistical power. Busia boys show similar patterns (Panel B), although gains at the top of baseline test distribution are somewhat more pronounced for boys.
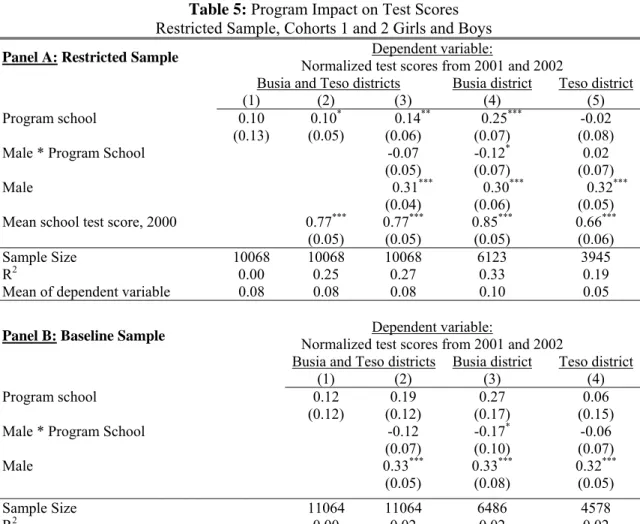
We next extend the analysis to the restricted sample for both cohort 1 and cohort 2 boys and girls, again pooling Busia and Teso district schools, and find an overall impact of 0.10 standard deviations (Table 5, Panel A, regression 1). The overall program effect remains 0.10 standard deviations (standard error 0.05, regression 2) and becomes statistically significant at 90% confidence when the mean school 2000 test score (computed among students in the restricted sample) is included as an explanatory variable. The average program effect for girls, pooled for Busia and Teso schools, remains large and statistically significant in the restricted sample at 0.14 standard deviations (standard error 0.06, regression 3), but the average effect for boys falls to 0.07 standard deviations – the most noteworthy difference between the results for the longitudinal sample (Table 4) versus the restricted sample (Table 5, Panel A). The estimated gender gap doubles in the restricted sample to 0.31 standard deviations (regression 3).
The average program impact for Busia district girls is 0.25 standard deviations (standard error 0.07, statistically significant at 99% confidence – Table 5, Panel A, regression 4) 15, again much larger than the estimated effect for Teso girls, at -0.02 standard deviations (standard error 0.08, regression 5). The estimate effect for Busia boys is reasonably large and marginally statistically significant, at 0.13 standard deviations (standard error 0.07, statistically significant at 90% confidence), while the analogous effect for Teso boys is near zero. The externality effects for Busia boys suggest that merit award programs
15 Among Busia restricted sample girls, impacts are somewhat larger for mathematics, science, and geography /
that randomize eligibility within schools (such as one pilot study described in Angrist and Lavy 2002) could systematically understate program impacts. For instance, here the gap between girls and boys is only 0.12 standard deviations, less than half magnitude of the preferred program estimate for Busia girls.
Point estimates are broadly unchanged using the full baseline sample, containing test score data for all 127 of the original schools, in an intention to treat (ITT) analysis. These regressions do not include the mean school 2000 test control as an explanatory variable, however, since that data is missing for several of the schools in this sample, and thus standard errors are considerably larger in these
specifications. A number of the schools added to these specifications have extensive missing data for either the 2001 or 2002 exams (and hence their exclusion from the restricted sample in some cases). The overall point estimate is 0.12 standard deviations (Table 5, Panel B, regression 1), and is larger for girls at 0.19 standard deviations (standard error 0.12, regression 2) than for boys on average (0.07 standard deviations). The average program impact for Busia girls is 0.27 standard deviations and nearly
statistically significant at 90% confidence (standard error 0.17, regression 3), and smaller for boys at 0.10 standard deviations. The ITT estimated program impact for Teso girls is again positive but not statistically significant at 0.06 standard deviations (standard error 0.15, regression 4). Thus using the larger baseline sample leads to somewhat more positive average estimated program impacts in both Busia and Teso districts, consistent with the hypothesized downward sample attrition bias discussed above (in Section 4.3), but standard errors are larger in the absence of the baseline test control.
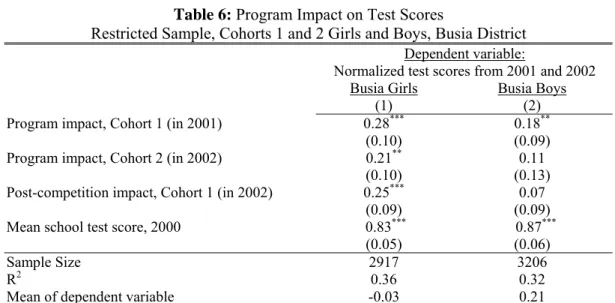
We next separately estimate effects for girls and boys across both cohorts and years, focusing on the Busia district restricted sample. The program effect for cohort 1 girls in 2001 – the year these girls were competing for the merit award – is 0.28 standard deviations (standard error 0.10, statistically significant at 99% confidence, Table 6, regression 1), and the effect for cohort 2 in 2002, when they were competing for the award, is 0.21 (standard error 0.10, significant at 95% confidence).
These are large impacts: to illustrate with previous findings from Kenya, the average test score for grade 7 students who take a grade 6 exam is approximately one standard deviation higher than the average score for grade 6 students (Glewwe et al 1997), and thus the average estimated program gain for
Busia girls competing for the award corresponds roughly to an additional 0.21-0.28 grades of primary school learning. These effects are slightly smaller than the test score gender gap between boys and girls in the Busia district restricted sample (Table 5). To further illustrate the magnitude of program impacts, these effects are similar to the estimated effect of reducing class size by ten students in Israeli primary schools (Angrist and Lavy 1999).
Estimates are unchanged when individual characteristics collected in the 2002 student survey – including student age, parent education, and household asset ownership – are included as explanatory variables.16 Interactions of the program indicator with these characteristics are not statistically significant
at traditional confidence levels (regressions not shown), implying that test scores did not increase more on average for students from higher socioeconomic status households.17 Similarly, neither the mean 2000
school test score nor the proportion of female teachers in the school significantly affects average program impacts (regressions not shown).
The program not only raised test scores for cohort 1 girls in Busia district when it was first introduced in 2001, but also continued to boost their scores in 2002: the estimated program impact for cohort 1 girls in 2002 is 0.25 standard deviations (standard error 0.09, statistically significant at 99% confidence, Table 6, regression 1). This suggests that the program had lasting effects on learning, rather than simply being due to cramming for, or cheating on, the 2001 exam. The ICS exams administered in February 2003 provide further evidence on post-competition impacts. Although originally administered to obtain test scores in Teso district in order to determine award winners (after the official 2002 Teso exams were canceled), they were also administered in the Busia sample schools. In the standard specification (like those in Table 6), the average program impact for cohort 1 Busia girls in early 2003 was 0.19 standard deviations (standard error 0.07, statistically significant at 99% confidence), and the gain for
16 These are not included in the main specifications in part because some were only collected for a subsample of
students (those present in the school on the day of survey administration), thus reducing the sample size and
changing the composition of students. Results are also unchanged when school average socioeconomic measures are included as controls (regressions not shown).
17 Note that although the program had similar test score impacts across socioeconomic backgrounds, students with
cohort 2 girls is positive and marginally statistically significant at 0.15 standard deviations (standard error 0.08 – regression not shown). Though impacts fall somewhat for cohort 1 over time – from 0.28 standard deviations in the year of the competition (2001), to 0.25 standard deviations in the year following the competition (2002), to 0.19 at the start of the second year after the competition (2003) – program impacts remain remarkably persistent, and we cannot reject the hypothesis that effects in 2001, the competition year, are equal to the 2002 and 2003 post-competition effects (p-values 0.96 and 0.38, respectively).
As discussed above, boys in Busia district program schools also have higher test scores than comparison school boys despite not being eligible for the scholarship themselves. The average program impact for cohort 1 Busia boys in 2001 is 0.18 standard deviations (standard error 0.09, statistically significant at 95% confidence, Table 6, regression 2). The survey data presented above (in section 2.2) suggests that few boys were confused as to whether they too were eligible for the scholarship, and so a desire to win an award is unlikely to be driving the results. In the second year of the program (2002), there are again positive though not statistically significant program impacts for boys (regression 2), although we cannot reject that effects for boys are the same across both cohorts in 2001 and 2002 at traditional confidence levels.
The focus so far has been program impacts on the first moment of the test score distribution, but program impacts on inequality are also of interest. Point estimates suggest a small overall increase in test score variance for girls in program schools relative to comparison schools in the restricted sample: the overall variance of test scores rises from 0.88 in 2000 at baseline, to 0.94 in 2001 and 0.97 in 2002 for Busia district program school girls, while the analogous variances for Busia comparison girls are 0.92 in 2000, 0.90 in 2001 and 0.92 in 2002, but the difference across the two groups is not statistically
significant at traditional confidence levels in any year.18 The changes in test score variance over time for
boys in Busia program versus comparison schools are similarly small and not statistically significant (results not shown). One potential concern with these figures is the changing sample size, as different
18 The slight (though insignificant) increase in test score inequality in program schools is inconsistent with one
particular naïve model of cheating, in which program school teachers simply pass out test answers to their students. This would likely reduce inequality in program relative to comparison schools. We thank Joel Sobel for this point.
individuals took the 2000, 2001, and 2002 exams. But even if we consider the Busia girls cohort 1 longitudinal sample, where the sample is identical across 2000 and 2001 tests, there are again no
statistically significant differences in test variance across program and comparison schools in either 2000 (program school girls variance 0.89, comparison schools 0.92) or in 2001 (0.97 versus 0.89, respectively).
5.2 Channels: School Participation, Behaviors and Attitudes
It is useful to explore potential channels for test score gains, since some mechanisms, such as increased test coaching or cramming, might raise test scores without improving actual learning. Using the same set of educational measures as Glewwe et al. (2003), we find starkly different patterns. In particular, we consider school participation and test score effects after incentives are removed as two indicators of effort aiming to increase long-run human capital, but treat extra test preparation sessions as having a larger component of effort to increase short-run test scores.
The scholarship program significantly increased student school participation measured during unannounced enumerator visits in 2001 and 2002 in Busia district: for cohort 1 and cohort 2 in the restricted sample, the program increased school participation by 4.7 percentage points (standard error 2.5 percentage points, statistically significant at 90% confidence, Table 7, Panel A, regression 1), and this corresponds to an approximately 30% reduction in absenteeism. Average gains are slightly larger among Busia girls, at 5.0 percentage points (standard error 2.4 percentage points, significant at 95% confidence, regression 2). Since school participation information was collected for all students, even those who did not take the 2001 or 2002 exams, these estimates are not subject to sample attrition bias to the same extent as test scores. Yet school participation impacts are near zero and not statistically significant in Teso district (estimate -2 percentage points, standard error 2 percentage points, regression not shown), further evidence that the program had limited impact in Teso.
The program increased average school participation by 6.2 percentage points (standard error 4.2 percentage points, Table 7, Panel A, regression 3) among Busia cohort 1 girls in 2001, and by an even larger 9.4 percentage points (standard error 4.9 percentage points) among cohort 2 in 2001 in a