Examining User-Developer Feedback Loops in the iOS App Store
Kendall Bailey Oregon State University
Meiyappan Nagappan University of Waterloo [email protected]
Danny Dig Oregon State University [email protected]
Abstract
Application Stores, such as the iTunes App Store, give developers access to their users’ complaints and requests in the form of app reviews. However, little is known about how developers are responding to app reviews. Without such knowledge developers, users, App Stores, and researchers could build upon wrong foundations. To address this knowledge gap, in this study we focus on feedback loops, which occur when developers address a user concern. To conduct this study we use both supervised and unsupervised methods to automatically analyze a corpus of 1752 different apps from the iTunes App Store consisting of 30,875 release notes and 806,209 app reviews. We found that 18.7% of the apps in our corpus contain instances of feedback loops. In these feedback loops we observed interesting behaviors. For example, (i) feedback loops with feature requests and login issues were twice as likely as general bugs to be fixed by developers, (ii) users who reviewed with an even tone were most likely to have their concerns addressed, and (iii) the star rating of the app reviews did not influence the developers likelihood of completing a feedback loop.
1.
Introduction
Software distribution platforms (such as App Stores) have become a default means of acquiring mobile software and can host apps developed by a wide variety of companies. In addition to the software, App Stores provide channels of communication between users and developers. Acting as a third-party, App Stores moderate both the apps and app reviews, to ensure ethical treatment of both developers and users [1–3]. Users re-purpose App Store reviews to provide developers valuable information about bugs and future requirements [4–6] in the free text portion of their reviews.
Current research [4, 7–10] aims to help
developers identify actionable information from app reviews, but we know little about how developers are currently responding to the reviews from users. Ignoring this could lead to research and the development of tools that are ill-suited to developers’ needs. In this study we focus on feedback loops, which are instances of app reviews where developers respond to a user concern. We determine feedback loops using release notes and user reviews provided on the iTunes App Store [11]. We identify feedback loops by searching for instances where users gave their feedback in the form of users reviews addressed in the release notes of an application’s subsequent release. We automatically identify feedback loops using SVM classifiers and a semantic relatedness algorithm based upon release notes and user provided reviews. To conduct this study we analyzed a corpus of 1752 apps from the iTunes App Store consisting of 30,875 release notes and 806,209 user reviews. Using our corpus and the automated data analysis, we answer the following research questions:
RQ1: Are developers responding to feedback provided in user reviews? We found feedback loops present in 331 apps which represents 18.7% of the eligible applications in our corpus.
RQ2: What are the characteristics of these feedback loops? Among the feedback loops, Log-in Issues, Feature Requests, and Crashing information provided in app reviews were resolved by developers more often than general reports of bugs. When analyzing the categories of the feedback loops, we discovered developers of music and social networking apps responded to the most user feedback. Developers address the largest amount of feedback within 90 days of being reported.
RQ3: What do users do that enables a feedback loop? Through analysis of user ratings, we found Crashes and Log-in Issues elicited developer response in lower star ratings while Feature Requests comprised most of the developer response
Search Scope:
I love the app, but every Fme I try to post a video it crashes Fixed crashes when imporFng from video Time It's crashes whenever I try to make a gif. There's a lot of crashing errors also :( We've also fixed a few crashes and bugs 1 - we fixed a crash under iOS
6
Every Fme I add a video it the sound goes off and the
app crashes
IniFal Release
A B C
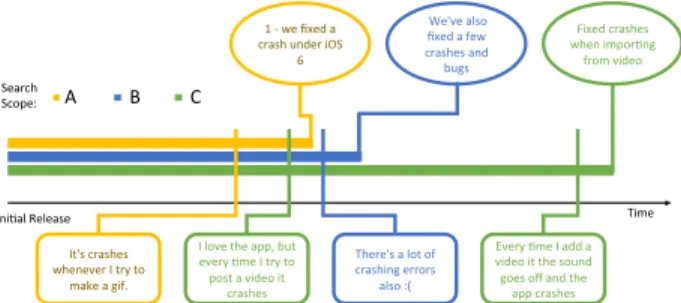
Figure 1: Examples of feedback loops. Ovals above the time line are statements from release notes. Rounded squares below the time line are statement from reviews. Same color marks a completed feedback loop. Examples are from GifBoom app.
in highly rated reviews. We analyzed sentiments and found the majority of the feedback addressed by developers is expressed using a neutral tone.
This paper makes the following contributions: 1. Case Study. We designed and answered
three novel research questions to understand the extent to which developers respond to feedback in App Stores.
2. Implications. Our study has implications for researchers, developers, users, and App Stores. We present these in Section 7.
2.
Feedback Loops
We define afeedback loopas an instance where a user review describes a short-coming or a request and at a later date the evidence of the change is found in the release notes of the corresponding mobile app. Our definition allows for feedback loops to be completed across multiple releases. Figure 1 shows examples of 4 feedback loops. In each case, the user submits a description of a bug that they encountered and gave the app a rating below 5 stars. Later, the developer is able to fix the bug mentioned in the app reviews.
After completed feedback loops, the users enjoy a better experience with their app. The developer should no longer receive low rated app reviews for the fixed issues. The iTunes App Store can generate more profit from more downloads of the now higher quality software. Therefore, completing feedback loops creates a win-win-win situation. However, there has been little work on feedback loops as we show in Section 6. Therefore, in this paper we examine the characteristics of such feedback loops. To identify feedback loops, we use a classification
tool developed by the first author, thoroughly described in her 2015 MS dissertation [12].
3.
Corpus of Data and Metholodogy
We collected our corpus from the iTunes App Store by scraping the information available on each app’s iTunes page and using a modified version of Kent Bye’s script 1 to collect reviews. Our corpusexpanded from an original list of 50 apps using lists of top apps, other apps by the same developer, and apps that other customers bought also provided on the iTunes pages. While we could have chosen an equal number of apps from all categories, we chose otherwise, since we wanted our dataset to be representative of the number of apps per category in the App Store. Our mining approach ensures that we have a proportional number of apps. We seeded our mining algorithm [12] with the top 50 iOS apps as determined by Distimo2 on December 30, 2014.
Subsequently we have collected 1752 different apps from the iTunes App Store consisting of 30,875 release notes and 806,209 app reviews.
We divided our corpus into three main parts, app metadata, release data, and review data. App metadata includes an app’s id number, price, category, and overall star rating. Release data includes a release’s publication date, version number, and release notes. Review data includes a review’s rating in stars, submission date, submitter’s user name, sentences in the freeform text portion. The submission dates of release notes range from July 7, 2008 to Feb 2, 2015 and the app reviews range from July 10, 2008 to Jan 28, 2015.
In this paper we chose to use apps from the iTunes App Store because despite its popularity, researchers study it much less than the Google Play Store. At the time of conducting this study, iTunes App Store saved the release notes for up to the previous 25 releases while the Google Play Store only displayed the most up-to-date release. To automatically analyze the large corpus we use a suite of ML and NLP tools: Support Vector Machines (i.e., LIBLINEAR library [13]), semantic relatedness tools to determine relatedness between words and short phrases (based on Wikipedia Miner [14]), and sentiment analysis (i.e., SentiStrength [15]). Our companion report [12] presents the best practices we used to ensure the highest quality of results, evaluating the accuracy of the tools with 3 independent human reviewers.
1https://gist.github.com/kentbye/3740357
Category Total Apps Apps with Feedback Loop Feedback Loops Games 41.3% 29.4% 27.7%
Photo & Video 12.8% 14.2% 13.7% Social Networking 9.9% 14.1% 13.7% Music 7.7% 13.4% 10.0% Entertainment 6.6% 7.0% 8.2% Navigation 10.6% 7.3% 6.7% Business 1.2% 1.7% 3.4% Utilities 2.1% 2.9% 3.3% Education 4.5% 2.9% 3.0% Productivity 2.3% 2.0% 2.5% Lifestyle 2.7% 3.5% 1.9% Travel 1.3% 1.7% 1.4% News 0.4% 0.6% 0.8% Reference 0.7% 0.9% 0.5% Finance 0.1% 0.3% 0.0% Books 0.2% 0.0% 0.0%
Health & Fitness 0.5% 0.0% 0.0%
Medical 0.1% 0.0% 0.0%
Sports 0.2% 0.0% 0.0%
Weather 0.1% 0.0% 0.0%
Total 1768 331 1220
Table 1: The distribution of feedback loops by category of application. The actual numbers in each column (and not percentages) and distribution plots for this table and other following tables are in [12].
4.
Results
4.1.
RQ1:
Are developers responding to
feedback provided in user reviews?
First, we wanted to determine if developers were responding to feedback submitted in app reviews. To reduce the false positives, we set the threshold for sentence semantic relatedness intentionally high. Therefore the number of feedback loops we detect is a lower bound to the feedback loops that exist. Additionally, we remove all reviews with a non-actionable label (“Not Specific”, “Content Related”, and “Use Limit”). This removes close to 75% of the app reviews from analysis, but is similar to findings by Chen et al. [4], who report that a majority of app reviews are not informative for developers. After these filters, we found feedback loops present in 331 apps, which represents 18.7% of the eligible applications in our corpus.
4.2.
RQ2:
What are the characteristics
of these feedback loops?
Now that we established the presence of feedback loops, we begin our analysis of the characteristics of feedback loops on the app level. This research question is divided into several sections based on focus: category of the application, label of the app reviews, and length of time for developer to respond.
4.2.1. Feedback Loops by Category We
looked at the distribution of feedback loops by category of the application, summarized in Table 1. We discuss interesting results below. Table 1 shows “Games”, “Photo & Video”, and “Social Networking” to have the highest absolute number of feedback loops.
However, in comparison to the category composition of the entire corpus, the number of game applications with feedback loops are underrepresented. The “Education” and “Navigation” category also had a smaller ratio of apps with feedback loops compared to others. Table 1 shows the “Music”, “Business”, and “Social Networking” apps to contain a higher proportion of apps with feedback loops.
Discussion: “Games” may be underrepresented because of less information provided in app reviews. The average length of a app review for an app in the “Games” category is 1.84 sentences, while the average is 2.23 sentences for apps in a non-game category. The “Education” category may be underrepresented due to the target audience. We looked over the top 10 paid apps in the category and found 9/10 of the apps were targeted at children under the age of 12. Though children are the users, their parents will write the reviews of the apps. Our results suggest that since the primary users are not writing the review, the app reviews provide a less informative information.
“Navigation” apps may have fewer feedback loops because “Navigation” apps often rely on information or functionality outside of the software and tend to use GPS as part of the services provided. For example, an app that shows public transportation routes will rely on information from the public transportation company for scheduling or location, something the developer may not be able to control. “Navigation” apps not only encounter external complications, but also contend hardware limitations. “Navigation” app reviews contain 15.72% of Resource Heavy complaints, second only
to the “Games” category. Many of the “Navigation” apps in our corpus make use of GPS, such as an app that gives real time directions. While developers can take steps to mitigate the battery consumption due to GPS, “Navigation” apps will consume resources at a faster rate than apps that do not use GPS.
One reason for the prominence of feedback loops in “Music”, “Business”, and “Social Networking” apps may be the dominance of certain apps in these categories, such as Facebook, Twitter, and iTunes. Familiarity with well-known apps may provide users with expectations for apps with similar functionality.
The “Business” Category not only contains a larger percentage of apps that have feedback loops, but also has the largest ratio of feedback loops to app at 7.2 : 1. The apps responsible for this high ratio are Citrix Receiver, Genius Scan, and SignEasy with feedback loops numbering 15, 12, and 9 respectively. Further analysis of the feedback loops in Citrix Receiver found that 11 of the feedback loops were tied to a single release. The users had encountered a bug that caused the Citrix Receiver app to show a black screen shortly after starting the application. This bug was both critical, as it prevented users from using the application, and easy to describe which is likely the reason that so many feedback loops are connected to this bug.
The high number of feedback loops in Genius Scan demonstrate a limitation in our current implementation for finding feedback loops. Genius Scan is an app centered around scanning, organizing, and sending documents from smart phones. Genius Scan saw a spike of 7 feedback loops in one of its releases, unfortunately this was caused by a number of false positives in our algorithm. EasySign suffered from the same language problem. EasySign and Genius Scan are both apps with specific functionality that focuses the language used by developers and users. The problems caused by language usage in niche purpose apps could be fixed in future work by restricting the tf-idf used in the semantic relatedness algorithm to each app. This would limit the impact of words like “scan” and “document” would have on the relatedness score in an app whose main service is scanning documents.
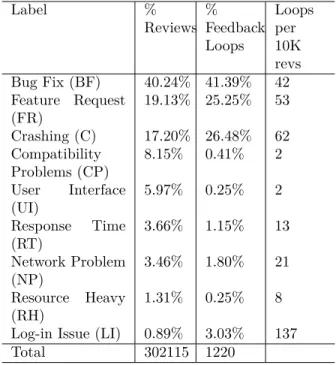
Observation 1: “Games”, “Education”, and “Navigation” apps have relatively fewer feedback loops while “Music” and “Social Networking” apps display relatively more feedback loops. Label % Reviews % Feedback Loops Loops per 10K revs Bug Fix (BF) 40.24% 41.39% 42 Feature Request (FR) 19.13% 25.25% 53 Crashing (C) 17.20% 26.48% 62 Compatibility Problems (CP) 8.15% 0.41% 2 User Interface (UI) 5.97% 0.25% 2 Response Time (RT) 3.66% 1.15% 13 Network Problem (NP) 3.46% 1.80% 21 Resource Heavy (RH) 1.31% 0.25% 8
Log-in Issue (LI) 0.89% 3.03% 137
Total 302115 1220
Table 2: The distribution of feedback loops by the type of feedback the user provided. The 2ndcolumn
shows the number of times feedback with a label appeared in the app reviews in the corpus. The 3rd column shows the number of feedback loops
completed of a label. The 4th column shows the
number of feedback loops completed relative to 10,000 statements of feedback with that label.
4.2.2. Feedback Loops by Label of app reviews Next we looked at the trends in feedback loops by the labels assigned by the app review SVM classifier [12]. Table 2 shows bug fixes are the most frequent type request and type of feedback loop, followed by Feature Requests and Crashing. All other types of feedback loops comprised a small portion of the total number of feedback loops (less than 25%).
Discussion: We suspect the reason most of the labels are so infrequently completed is due to users’ familiarity with the type of problem. Bugs and crashing have crept into the vernacular such that most people can understand how to describe the error. Far fewer users will be able to attribute their short battery life or slow response time to a specific application, and may just assume their phone or battery is old. However, the expansion of bugs and crashing terms into general English could cause over-reporting of general bugs and crashes when other problems to be under-reported. For example,
an app takes several minutes to download something from the Internet and the developer provides no indicator that the app is currently working (such as a progress bar), the user then thinks that the app has frozen and crashed because nothing is happening. The user could report this as a crash, when in reality the problem was Network Issue.
User Interface feedback loops are also sparse. The low number of completed loops could be attributed to the classification of User Interface statements, which included both positive and negative mentions. An app review stating,“Crisp, clean interface, easy to use, and so much fun.”, are not actionable for developers.
Next we determined the number of feedback loops completed compared to the total number of feedback with the same label provided in app reviews (shown on the far right of Table 2) We found that both Log-in Issues and Feature Requests were almost twice as likely as bug fixes to be addressed by developers. Log-in Issues may have a high response rate because they are both high on the triage list and can be quickly localized to the bug. Users being unable to login would preclude their use of app which could raise the importance to developers. Crashing problems are also more likely than Bug Fixes to be addressed by developers. One reason for this may be severity, small bugs may be tolerable to users whereas crashing would greatly inhibit users’ ability to use the app.
Finally, developers may not want to admit how many bugs they have introduced and simply add a blanket statement along the lines of “fixed some bugs”. Being vague allows the developer to both please the customer, who will find that the bug they experienced is gone when using the app, and save face. These vague Bug Fixes are ignored by our semantic relatedness algorithm and thus under-report the number of Bug Fix feedback loops.
'
&
$
%
Observation 2: Bug Fixes, Feature Requests, and Crashing compose most of the completed feedback loops. However, more Log-in Issues complete feedback loops relative to number reported. The spareness of other feedback loops could point to communication issues between users and developers.
4.2.3. Feedback Loops by Time to
Completion The length of time in days that developers took to complete a feedback loop is the final feature of application-feedback loop characteristics we analyze. Table 3 shows the
number of feedback loops completed within a certain period of time (e.g. “within 1 week”, or “within a month”). We found that the number of feedback loops completed remained fairly static over the time periods. We also observed developers had the highest number of most feedback loops completed within the 30-90 day period. Surprisingly, a large number of feedback loops were completed within a 7 day time period, even more than within 90-180 day time period.
To gain a better understanding of what type of feedback loops are completed over time we broke each of the time periods up by type. Table 3 shows that although still composing a significant portion of the feedback loops, in general Bug Fix feedback loops decrease over time. Unlike Bug Fixes, Crashing feedback loops comprise roughly the same percentage of feedback loops in all time periods except for those over 1 year in length. As the time from submission grows, Feature Request feedback loops comprise a larger portion of the feedback loops as the time between app review submission and developer completion grows. Discussion: The decrease in Bug Fixes over time could be because developers eradicate found bugs over time so there are less to fix later. The exception for this trend is feedback loops completed in more than 1 years time. The reason for this behavior could be that as new releases are pushed, newer, more visible bugs take priority over old bugs.
One of the reasons crashes may be so prevalent across all time periods can be attributed to the description provided by the user. For example, in the app “Slow Down Music Trainer”, one user submitted “It crashed once in a while, but functioned perfectly.” The developer now knows that their app crashes, but is not provided information on when or where the crash occurs. This could make it difficult to locate the crash until another user provides more information on where the crash is occurring. Crashes can also be the result of Compatibility Issues or problems interacting with other apps running on the same phone. One user of the “NYC Subway Map” app states “This app, if kept running in the background, may crash the iPhone4 running iOS 4.1.” In this case, there could be several sources of the crash; the app could have compatibility problems with iOS 4.1, the app could have compatibility problems with other apps concurrently running on the phone, or the app could be crashing due to any problem in its programming. Finally, though crashes are a critical problem, they may only occur when the user takes
Label <7 days 7-30 days 30-90 days 90-180 days 180-365 days 365+ days Bugfix 60.67% 39.78% 39.45% 34.30% 26.13% 49.78% Feature Request 8.99% 19.89% 26.56% 30.23% 34.17% 30.04% Network Problem 1.61% 1.56% 2.33% 2.51% 2.69% Response Time 1.12% 1.61% 0.39% 0.50% 3.14% Compatibility Issues 0.54% 0.58% 1.01% 0.45% Resource Heavy 0.50% 0.90% Crashing 29.21% 33.33% 27.34% 30.81% 28.64% 13.00% User Interface 0.54% 0.58% 0.50% Log-In Issue 2.69% 4.69% 1.16% 6.03%
Total Absolute Numbers 178 186 256 172 199 223
Table 3: Kinds of feedback loops completed by time period. The percentage are relative to other loops inside the same time period column (i.e., the numbers in each column add up to 100%). Empty positions denote 0%. Reading the table horizontally, over a period of 1-year, bug fixes decrease while feature requests increase. Crashes maintain a fairly significant portion of feedback loops over all but the longest time periods.
certain actions. If those actions are not central to the functionality of the application, they may be placed on lower level of triage than other reported problems. For example, in the app reviews of the app “Muzy”, one user commented “Only crashes when I pick a photo.” and another user submitted “It crashes when I click on my camera roll...” If choosing a photo from the camera roll is not the only way to import pictures to the application, the developers at Muzy may give this crash bug a lower priority than other bugs. The feedback loop mentioned by the two users was completed in just over 180 days.
The increase in Feature Request feedback loops can be attributed to this: features can be complex and take longer to implement and may have lower priority than fixing bugs. Additional features may also be planned according to development calendar. For example, a team plans to release new content for their app every quarter, but release every few weeks for maintenance on existing features.
Observation 3: There was no correlation between completion of feedback loops and time. Feedback loops completed within a week are likely to be bug fixes.
4.3.
RQ3:
What do users do that
enables a feedback loop?
Our third research question looks for what users can do to encourage developers to respond to their feedback. We divide this research question into three parts: feedback loops by star rating, bartering with the developer, and feedback loop by sentiment.
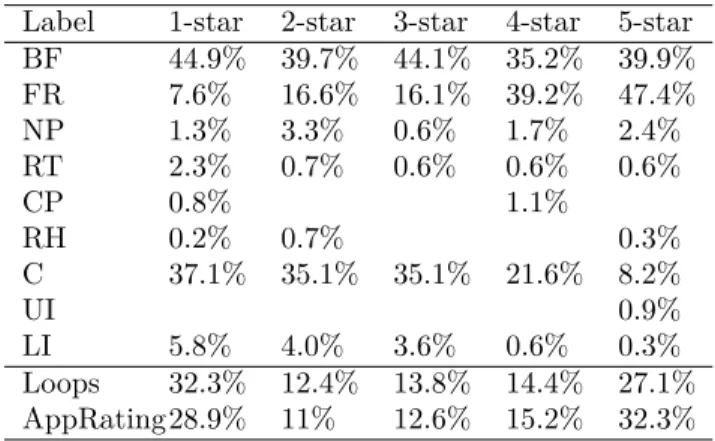
Label 1-star 2-star 3-star 4-star 5-star
BF 44.9% 39.7% 44.1% 35.2% 39.9% FR 7.6% 16.6% 16.1% 39.2% 47.4% NP 1.3% 3.3% 0.6% 1.7% 2.4% RT 2.3% 0.7% 0.6% 0.6% 0.6% CP 0.8% 1.1% RH 0.2% 0.7% 0.3% C 37.1% 35.1% 35.1% 21.6% 8.2% UI 0.9% LI 5.8% 4.0% 3.6% 0.6% 0.3% Loops 32.3% 12.4% 13.8% 14.4% 27.1% AppRating28.9% 11% 12.6% 15.2% 32.3%
Table 4: Distribution of type of feedback loop by star rating (total in each column is 100%). Empty positions denote 0%. Refer to Table 2 for acronyms in the first column. Crashes (C) and Login Issues (LI) decrease as the star rating increase while Bugfixes (BF) remain fairly constant.
4.3.1. Feedback Loops by Star Rating First we analyzed distribution of star ratings given by users across the corpus and throughout feedback loops. Table 4 last row shows that across the corpus the majority of the app ratings are 5-star ratings. The number of 5-star ratings may seem high, but our corpus formed by collecting information from the top ranking apps from the iTunes App Store, so the ratings are slanted towards the higher end.
Across the feedback loops (second to last row), the user ratings are more negative in comparison to app rating. We observed the number of 1-star reviews to be the most frequent user rating in feedback loops. When considered with distribution of type of feedback loop we found, this is not
surprising as Bug Fixes and Crashing comprised a majority of feedback loops observed. More surprising was the number of 5-star ratings. In theory, the 5-star rating should be used for perfect apps, not apps that are in some way lacking. To further explore the user ratings discrepancy, we looked at the distribution of feedback loop type within star ratings, shown in Table 4. We noticed that as the star rating increases the percentage of Feature Requests feedback loops completed also increases.
Conversely as the star rating decreases the number of Crashing feedback loops also increases. Log-in Issue feedback loops follow the same trend as Crashing feedback loops.
Discussion: Crashing and Log-in Issue feedback loops may follow a strong trend because they are issues that will prevent the user from using the app. We further examined the Crashing feedback loops with 5-star ratings. Of the 27 app review statements, 6 mentioned the app “never crashing”, 2 thanked the developers for fixing crashes in previous releases, and the remaining reviews discussed crashes experienced by users. One user states, “Luv it, BUT. It crashes a lot and has too many ads.” but gives “Breakfast Maker” a 5-star rating. Surprisingly, Bug Fixes remain a noticeable percentage of the feedback loops across all star ratings where we expected them to follow the same trends as Crashing and Log-in Issue feedback loops. However, Khalid et al. [5] found that while users complain about bugs in different star ratings, other issues eclipse the presence of bugs. In addition to Khalid et al.’s findings, our study suggests thatif users are provided the functionality they want, they will be able to overlook smaller problems.
Bartering with Developers: Among the
reviews, we noticed instances where the users would use star ratings as bartering chip with the developers. When trying to barter with the developer, the user will claim that if the developer adds or fixes some feature of the app then the user will return and replace the low rated review with a higher one.
We wanted to see if the user made good on their promises, so we searched the reviews found in feedback loops for bartering offers and compared the request in the review with the rating. For example, the following app review has a user rating of 3 stars, ”GIVE ME A BIG SELECTION OF DOGS THEN I WILL GIVE YOU 5 STARS!!!!!! ” The developer answers, ”New puppies have been added.”
It is possible that the user did not feel that the
developer added enough to the app to warrant a rating change, but of the 15 bartering offers reviews we found in the feedback loops, none of the users returned to change their ratings. In addition to the developer not doing enough for the user, it is also possible that the user forgot or did not care enough to return to update their review.
Not returning to change ratings could indicate that developers have no reason to acquiesce to users’ demands as none of the users updated their reviews.
#
" !
Observation 4: Bugfix feedback loops were present at all star levels. Log-in issues and Crashing feedback loops decreased with rating while Feature Requests increased with rating. Users did not return to adjust ratings when trying to barter with developers.
4.3.2. Feedback Loops by Sentiment The final user dimension we examined is sentiment expressed in the app reviews. Sentiment analysis, also called opinion mining, quantifies the emotion conveyed by the author in texts. For our research we elected to use SentiStrength [15], a lexicon based tool that calculates the sentiment expressed in short texts. When given a sentence, SentiStrength returns both a positive and a negative value on a scale of 1 to 5 where 1 is weakly expressed and 5 is strongly expressed emotion. We simplify these values to a single score by subtracting the score for negative emotion from positive emotion to get the net sentiment of the sentence as a value -4 to 4.
SentiStrength already considers emoticons when calculating sentiment [15], however it does not account for emoji. Originally from Japan, emoji are pictures used to convey emotions available for use in electronic messages, like less abstract emoticons. Technology providers such as Microsoft, Apple, and Google added emoji as default characters sets to their mobile devices as their popularity grew and eventually standardized the Unicode codes for a set of common emoji in 2010 [16]. We created a mapping of popular emoji to emoticons to adapt SentiStrength for more mobile based responses.
Research in sentiment analysis [17] shows that increased levels of sentiment relates to repeated letters. We created a spellchecker based on PyEnchant United States English Dictionary that would both correct misspelled words and preserve repeated letters.
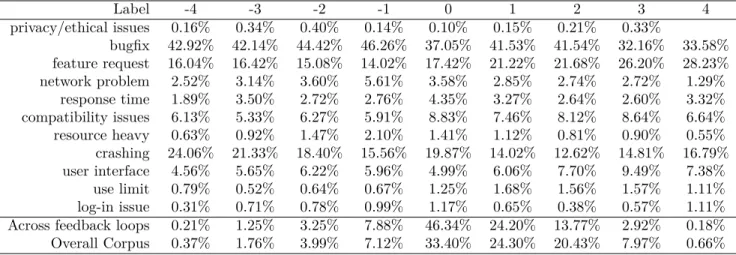
Table 5 shows the distribution of app review statements by net sentiment. Similar to the star ratings, app review statements in the overall corpus
Label -4 -3 -2 -1 0 1 2 3 4 privacy/ethical issues 0.16% 0.34% 0.40% 0.14% 0.10% 0.15% 0.21% 0.33% bugfix 42.92% 42.14% 44.42% 46.26% 37.05% 41.53% 41.54% 32.16% 33.58% feature request 16.04% 16.42% 15.08% 14.02% 17.42% 21.22% 21.68% 26.20% 28.23% network problem 2.52% 3.14% 3.60% 5.61% 3.58% 2.85% 2.74% 2.72% 1.29% response time 1.89% 3.50% 2.72% 2.76% 4.35% 3.27% 2.64% 2.60% 3.32% compatibility issues 6.13% 5.33% 6.27% 5.91% 8.83% 7.46% 8.12% 8.64% 6.64% resource heavy 0.63% 0.92% 1.47% 2.10% 1.41% 1.12% 0.81% 0.90% 0.55% crashing 24.06% 21.33% 18.40% 15.56% 19.87% 14.02% 12.62% 14.81% 16.79% user interface 4.56% 5.65% 6.22% 5.96% 4.99% 6.06% 7.70% 9.49% 7.38% use limit 0.79% 0.52% 0.64% 0.67% 1.25% 1.68% 1.56% 1.57% 1.11% log-in issue 0.31% 0.71% 0.78% 0.99% 1.17% 0.65% 0.38% 0.57% 1.11% Across feedback loops 0.21% 1.25% 3.25% 7.88% 46.34% 24.20% 13.77% 2.92% 0.18% Overall Corpus 0.37% 1.76% 3.99% 7.12% 33.40% 24.30% 20.43% 7.97% 0.66%
Table 5: Distribution of net sentiment across Feedback Loops by label (each column adds up to 100%). Empty positions denote 0%. The distribution of net sentiment across all reviews and the net sentiment across feedback loops. The net sentiment expressed over all reviews has positive sentiment, while feedback loops are mostly neutral in tone.
express more positive than neutral or negative sentiment; i.e. if you summed the number review statements with a sentiment score greater than one, it contain the majority of sentiment expressed. However, neutral sentiment describes the largest portion app reviews in the corpus. The sentiment expressed in feedback loops followed similar trends to total corpus; most of the app reviews statements in feedback loops were neutral with a larger number of positive reviews than negative ones. However, while the total corpus could be described as overall positive in sentiment, feedback loops are neutral. To further our understanding, we divide each level of sentiment into the label of the feedback loop (Table 5).
Discussion The neutrality of statements in feedback loops can be attributed to users communicating enough information for developers to act on. When divided by label Feature Requests follow the same trend as in star rating, increasing in proportion as the sentiment becomes positive. Log-in issues also follow the trend established in star rating, increasing in proportion as sentiment becomes negative. Bug Fixes follow a more downward trend as sentiment becomes more positive, which is different from the star ratings which remained more static across ratings. This shows that while users may be willing to overlook bugs in their rating, they won’t be happy about it. Crashing feedback loops increase with the positivity. However, crashing feedback loops illustrate a limitation of SentiStrength, which was
developed using comments from a social networking site. The sentiment scores given by SentiStrength is not calibrated for mobile applications. For example, the word “crash” has a sentiment score of 0.
Observation 5: The app reviews in a majority of feedback loops use a neutral tone.
5.
Threats to External Validity
We conducted our research on a sample of iOS mobile apps and the iTunes App Store. We cannot guarantee that the results will generalize to Android apps and the Google Play Store because it adds a dimension to the developer-user interaction by allowing developers to directly respond to user reviews. The ability to respond to app reviews could allow developers to extract extra information from users to better address their needs. Hence, by limiting our study to just iOS apps, we are able to study feedback loops between reviews and descriptions. We also do not know if our results will generalize to other iOS apps developed by other developers. However, we took a broad sample of apps and the iTunes App Store is one of the largest App Stores on the market so the results could be generalizable for a large portion of mobile apps.6.
Related Work
Studies on App Stores: Most prior work focuses on identifying and managing actionable feedback in app reviews, while our research focuses on how that feedback is used. Pagano and Maalej [18] performed an empirical study on user feedback found in App
Stores and found that more than 50% of app reviews contain a mixture of topics in text, supporting our choice to use sentence level granularity. Sarro et al. [19] use release notes to track feature migration through apps and found that features tend to spread within similar categories. Panichella et al. [7] develop an algorithm to classify the content of app reviews in App Store using a combination of text analysis, natural language processing, and sentiment analysis to derive a class.
Both Panichella et al. [7] and Pagano and Maalej [18] focus on the content of app reviews while our study focus on what developers respond to from app reviews. Sarro et al. [19] track software evolution through App Stores, but work at the App Store level while our study focuses on individual apps. Tools to Manage App reviews: Several tools [4, 6, 8, 20] have been introduced to help developers source their user reviews for features. Chen et al. [4] focus on extracting informative app reviews from App Stores. While highly accurate, the A.R. Miner only divides the app reviews into non-informative (equivalent to our “Not Specific” and “Content Related” label) and informative reviews. WisCom [20] is a tool that traces user sentiment on three levels and helps identify sources of user complaints. Vu et al. [8] propose MARK, a tool designed to help analysts sift through a large volume of reviews. Our research examines feedback loops classified with an SVM, but as shown by Panichella et al. [7] could be improved by keywords.
Iacob and Harrison [9] developed the tool MARA, which identifies feature requests in app reviews. MARA uses a set of 237 linguistic rules to classify reviews where our research uses a text analysis approach, comparing text content to classify. Most of the tools focus on helping developers find actionable items within user reviews while our research focuses on what feedback the developers act on.
Studies on User Feedback: Paloma et
al. [6] introduce an approach called CRYSTAL which traces software changes suggested by app reviews to the actual changes implemented by the developers using both issue trackers and the apps (predominantly written in Java) in the Google Play store. However, in the case of the iOS App Store, the apps are written predominantly in Objective C, for which there are not any decompilers like the Java programming language. Therefore, since our research considered only apps from the iOS App Store, we did not have access to the source code, and thus we were unable to
use CRYSTAL. That was also the reason for us to find feedback loops using reviews and release notes, which are available for all apps in all App Stores.
Several studies explore untrained users’ ability to document software requirements both in situ and through social networking sites [21, 22]. Both Seyff’s and our research explore user’s competence in communicating with developers, though our research looks at a more ad hoc method of communication. Their research found that given opportunity, the users were able to provide understandable requirements to software engineers.
7.
Implications and Conclusions
For Developers: Communication with users does matter; users want to know that they count. Developers need to create an infrastructure for managing the feedback in user reviews to handle the sheer volume of app reviews some apps receive. The presence of bugs at all star ratings in feedback loops suggests that developers should handle exceptions as users are more tolerant of application’s unexpected behavior than of an app that crashes.For End Users: We found evidence that developers are indeed responding to user requests, thus users should continue to provide information. Addressing the developers in a neutral and professional tone is more likely to elicit a response than ranting and raving. Users who chose a 1-or 5-star rating had the highest likelihood of the developers addressing their concerns. Users should not be on the fence with their reviews when trying to make their voice heard.
For Application Stores: Since users have hijacked the application reviews as channels to report bugs and request features, we call for a dedicated channels to enable feedback and communication between users and developers. This would allow users to highlight what they want and concentrate the information for developers such that they can process volume of feedback received. App Stores could also create more accountability for developers by visibly showing users how likely a developer is to address their feedback. If App Stores can detect when a user is reporting an issue as they are typing a app review, it could be beneficial to prompt the user for more information. Finally, the App Stores may be able to trace power users who provide developers informative, actionable feedback.
For Researchers: There is room for HCI research on alternative models for structuring casual users
to submit feedback to developers. Additionally, there is another dimension to feedback loops not addressed in this paper, how other users respond to the presence of feedback loops.
In this paper, our most surprising findings include (i) log-in Issue, feature requests, and crashes had the highest likelihood of being addressed by developers, (ii) apps in the “Games” category comprise 61% of the feedback loops completed within a week of receiving feedback, (iii) users attempt to barter with developers using star ratings, but do not return to fulfill the promised rating change. We hope that this initial study of developer response to user feedback can provide information to facilitate the growth of developer-user interaction in App Stores. We would like to finally note that more examples, data, analysis, and discussions with respect to this topic (which we could not include in this paper due to space constraints) can be found in the Master’s thesis of the first author [12].
Acknowledgements: We thank the anonymous reviewers for their insightful feedback. This research was partially supported through NSF CCF-1553741 and CCF-1439957 grants and the NSERC Discovery grant.
References
[1] “App store review guidelines.”
https://goo.gl/MiToja.
[2] S. Perez, “Apple is taking action against fake ratings on the app store.” https://goo.gl/cguETh. [3] C. Arthur, “Apple is taking action against fake
ratings on the app store.” https://goo.gl/RvxySX. [4] N. Chen, J. Lin, S. C. Hoi, X. Xiao, and B. Zhang, “AR-Miner: mining informative reviews for developers from mobile app marketplace,” in 36th International Conference on Software Engineering, pp. 767–778, 2014.
[5] H. Khalid, E. Shihab, M. Nagappan, and A. E. Hassan, “What do mobile app users complain about?,”IEEE Software, vol. 32, no. 3, pp. 70–77, 2015.
[6] F. Palomba, M. Linares-V´asquez, G. Bavota, R. Oliveto, M. Di Penta, D. Poshyvanyk, and A. De Lucia, “User reviews matter! tracking crowdsourced reviews to support evolution of successful apps,” in IEEE International
Conference on Software Maintenance and
Evolution, pp. 291–300, IEEE, 2015.
[7] S. Panichella, A. D. Sorbo, E. Guzman, C. A. Visaggio, G. Canfora, and H. C. Gall, “How can i improve my app? classifying user reviews for software maintenance and evolution,” in 2015 IEEE International Conference on Software Maintenance and Evolution, pp. 281–290, 2015.
[8] P. M. Vu, T. T. Nguyen, H. V. Pham, and T. T. Nguyen, “Mining user opinions in mobile app reviews: A keyword-based approach,” CoRR, vol. abs/1505.04657, 2015.
[9] C. Iacob and R. Harrison, “Retrieving and analyzing mobile apps feature requests from online reviews,” in 10th Working Conference on Mining Software Repositories, pp. 41–44, 2013.
[10] F. Palomba, M. L. V´asquez, G. Bavota, R. Oliveto, M. D. Penta, D. Poshyvanyk, and A. D. Lucia, “User reviews matter! tracking crowdsourced reviews to support evolution of successful apps,” in 2015 IEEE International Conference on Software Maintenance and Evolution, pp. 291–300, 2015. [11] “iTunes store.” https://itunes.apple.com/us/store. [12] K. Bailey, “Out of the mouths of users : Examining user-developer feedback loops facilitated by app stores,” Master’s thesis, Oregon State University, 2015.
[13] R.-E. Fan, K.-W. Chang, C.-J. Hsieh, X.-R. Wang, and C.-J. Lin, “Liblinear: A library for large linear classification,” The Journal of Machine Learning Research, vol. 9, pp. 1871–1874, 2008.
[14] D. N. Milne and I. H. Witten, “An open-source toolkit for mining wikipedia,” Artif. Intell., vol. 194, pp. 222–239, 2013.
[15] M. Thelwall, K. Buckley, G. Paltoglou, D. Cai, and A. Kappas, “Sentiment strength detection in short informal text,” Journal of the American Society for Information Science and Technology, vol. 61, no. 12, pp. 2544–2558, 2010.
[16] U. Consortium et al., “The unicode standard, version 6.0. 0, defined by:,” the unicode standard, version 6.0. 0”,(Mountain View, CA: The unicode consortium, 2011. isbn 978-1-936213-01-6).” [17] M. Thelwall, “Myspace comments,” Online
Information Review, vol. 33, no. 1, pp. 58–76, 2009. [18] D. Pagano and W. Maalej, “User feedback in the appstore: An empirical study,” in 21st IEEE International Requirements Engineering Conference, pp. 125–134, 2013.
[19] F. Sarro, A. A. Al-Subaihin, M. Harman, Y. Jia, W. Martin, and Y. Zhang, “Feature lifecycles as they spread, migrate, remain, and die in app stores,” in23rd IEEE International Requirements Engineering Conference, pp. 76–85, 2015.
[20] B. Fu, J. Lin, L. Li, C. Faloutsos, J. I. Hong, and N. M. Sadeh, “Why people hate your app: making sense of user feedback in a mobile app store,” in The 19th ACM SIGKDD International Conference on Knowledge Discovery and Data Mining, KDD 2013, Chicago, IL, USA, August 11-14, 2013, pp. 1276–1284, 2013.
[21] N. Seyff, F. Graf, and N. Maiden, “Using mobile RE tools to give end-users their own voice,” in 18th IEEE International Requirements Engineering Conference (RE), pp. 37–46, IEEE, 2010.
[22] N. Seyff, I. Todoran, K. Caluser, L. Singer, and M. Glinz, “Using popular social network sites to support requirements elicitation, prioritization and negotiation,”Journal of Internet Services and Applications, vol. 6, no. 1, pp. 1–16, 2015.
![Table 1: The distribution of feedback loops by category of application. The actual numbers in each column (and not percentages) and distribution plots for this table and other following tables are in [12].](https://thumb-us.123doks.com/thumbv2/123dok_us/1385784.2685635/3.918.109.452.95.544/distribution-feedback-category-application-numbers-percentages-distribution-following.webp)