THE DISTRIBUTION OF PRODUCT SALES BY BUSINESS INTELLIGENCE
Lita Karlitasari1, Sufiatul Maryana2, Yuni Rahayu3
ABSTRACT
Every big distributor company always have branch distributor in every city to make the product distribution process to every consumer faster and easier. It is not an easy problem to manage the data of transaction activity in every distributor to support decision-making process by company management to improve selling in every branch. Moreover, the central office must monitor performance in every branch every time. The central office must answer all the important question accurately, such as how is the selling condition, what product that is in good selling condition, to the question about branch office overall performance. The research method that we use is SDLC (System Development Life Cycle). The first stage is planning stage, by identifying user needs to give the information to user. The second stage is requirement analysis, including analysis of the structure of the database to be processed, including progress assessments, problems identification, conclusion of analysis and solution results, and also data warehouse architecture which will be built. The next stage is system design process by doing the data warehouse design based on nine-step methodology, including choosing the process, choosing the grain, choosing the fact, storing pre-calculation in the fact table, choosing the duration of the database, deciding the query priorities and the query modes, star scheme, tracking slowly changing dimension, and completing dimension table. The fourth stage is Extract Transform Load (ETL) implementation, cube implementation, and then the cube will be processed into Online Analytical Processing (OLAP) database to become data source in report making. The report to be made in this system is sales report per region, report per branch, report per customer, report per outlet and report per product type. There is also software that is used is Microsoft SQL Server 2008 and SQL Server Business Intelligence Development Studio. The test stages include Structural Test, Functional Test, and Validation Test. Once the research is done, the expected benefit of data warehouse is to make enterprise data spread across different branches become integrated and in a more concise and supporting information required by the executive (Commissioner and Director, Finance Manager and Sales Manager). Then brief information on the data warehouse can make executives more easily and more quickly in analyzing the data, so that decision making process can be performed faster. Moreover, the last benefit is the Dashboard will ease user to read the report.
Keywords : Business Intelligence, Data Warehouse, Data Mining, Cube, OLAP.
1 Program Studi Ilmu Komputer, FMIPA, Universitas Pakuan 2 Program D3 Manajemen Informatika, FMIPA, Universitas Pakuan 3 Program Studi Ilmu Komputer, FMIPA, Universitas Pakuan
INTRODUCTION
Every large distributor company must always have branches in every city to speed up and simplify the process of distributing goods to every customer. It is not an easy problem to manage the data of transaction activity in every distributor to support decision-making process by company management to improve selling in every branch. Moreover, every time the central office is required to monitor the performance of every branch. Every moment must be able to accurately answer important questions such as how the sales, what products are rising sales in each branch, to questions about the overall performance of the branch.
Required information presented in different formats. For example, the report presented by the quality control report papers (hardcopy), inventory reports using spreadsheets and distribution report using database. However, the data presented will be much easier if the company is equipped with adequate system of information technology (IT). Notably, the company equipped with business application that is able to present the raw data into critical information from a variety of business applications such as ERP, SAP, Oracle, Sun Systems, Microsoft Axapta and other applications. The companies can leverage business intelligence solutions to improve the effectiveness of work. Business intelligence needed to turn raw data into supporting information for enterprise decision-making and business processes.
Today's business intelligence solution is still overshadowed EIS (Executive Information System) so that business intelligence is considered only for the executives, but now business intelligence can also be used for the operational levels seen from the ability to provide quick information. Business intelligence solution is a very comprehensive solution, very simple in its implementation, and can also integrate data from a variety of different applications. Company's business intelligence applications are necessary for collecting, storing, analyzing and providing access to data to help users make business decisions accurately. This application includes a variety of activities such as reporting, online analytical processing (OLAP) and data mining.
In terms of output, the business intelligence gives features that provide quick and accurate information. By using ETL (Extract Transform Load), we can collect data from a variety of applications that report is no longer just one application. From the side of flexibility of OLAP analysis, business intelligence provides information quickly in accordance with the data we want. Drill-down method also allows the user to more in-depth analysis, for example, from the level of the year, into the quarter level, month level and beyond.
This study aims to implement business intelligence systems on company sales distribution by using Microsoft SQL Server 2008 and SQL Server Business Intelligence Development Studio.
RESEARCH METHOD
In this case a large distributor companies have constraints to provide information about trends in the sale of each branch, the up-selling products in each branch, and the branch and sales performance overall. In the process of the sale of goods using Enterprise Resources Planning (ERP) SAP, data from SAP are
raw data that has not been able to provide informative and quick sales. However, the raw data is presented will be much easier if the company is equipped with a system of information technology (IT) is adequate. Companies can leverage business intelligence solutions to improve the effectiveness of its work. Business intelligence needed to turn raw data into information supporting decision-making and enterprise business processes.
The research method used in the implementation of Business Intelligence is the pattern of the system development life cycle / System Development Life Cycle (SDLC). The consideration of using this model is because it has a complete stage and structured. Data and information collecting is required in this study. This information regarding the steps is necessary to design the system. These studies used in the collection of information.
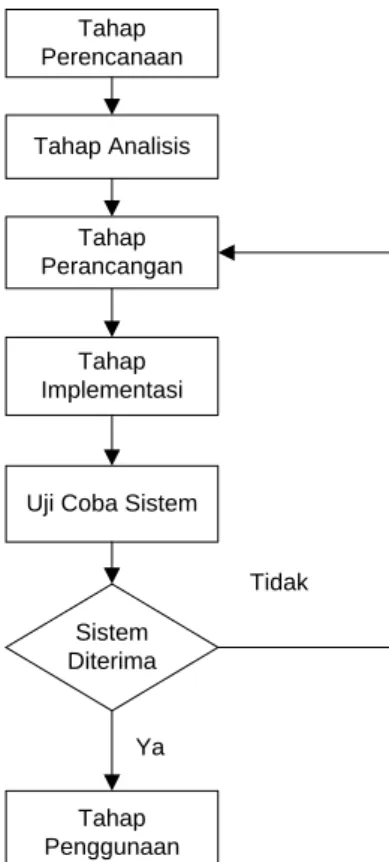
The design starts with analyzing system that encourages the implementation of design and implementation, ending with the reporting of research results. Here is figure of development processes carried out during the design phase. Tahap Perencanaan Tahap Analisis Tahap Perancangan Tahap Implementasi
Uji Coba Sistem
Sistem Diterima Tahap Penggunaan Ya Tidak
Figure 1. SDLC Development Diagram
From the analysis done on making Business Intelligence, it can be concluded that the requirement needed is information from PT. Sukanda Djaya the form of a database that will be processed into a data warehouse.
Design process began after analyzing the needs of the system to be developed. Phase to be performed are as follows:
2. Cube / OLAP (Online Analitycal Processing) Making 3. Data Mining Making
4. Report based on need Making 5. Dashboard Creation
At this stage of the implementation is divided into 3 (three) process is the implementation of a database using SQL Server 2008, implementation of the system using SQL Server Business Intelligence Development Studio, and the implementation of the report using Reporting Services.
In the test phase, the system are classified into 3 (three) categories include 1) Structural Test, the test is intended to determine whether the system has been structured properly with the design that has been made and the results to be achieved, 2) Functional Test, the test is based on navigation and validation processes are contained in a system, whether it has been functioning as expected by users of the system, and 3) Validation test, Validation of the system is done by testing whether the data and the results are in accordance with the feasibility analysis and delivery of decision Support Systems information. Validation test is successful if the function exists on the system according to the user expectation. RESULTS AND DISCUSSION
Report Page
Report page used as interaction media to the sub menus inside the program. Report page form that was used is dashboard that will be shown using Windows Internet Explorer.
Report Page Main Menu
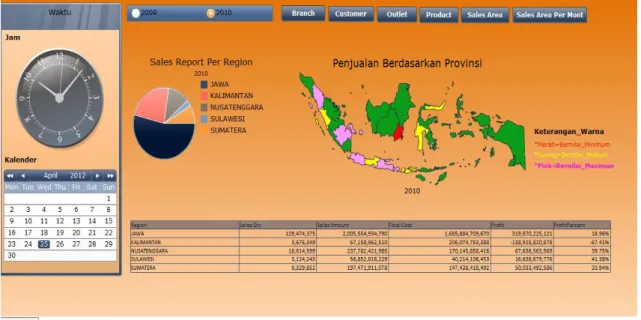
Report page main menu is a main view of the program in which there are other report page menus.
Figure 2. Report Page Main Menu Report Page Sales per Branch
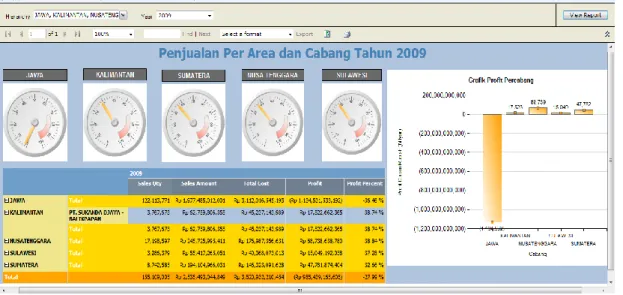
In this report page, there is a report sales qty per branch which is a report of sales by sales based on the branch. In this report, there are five regions, namely, Jawa, Kalimantan, Nusatenggara, Sulawesi, and Sumatera, and in the region, there are several branches in every region.
Figure 3. Report Page Sales Qty Per Branch Report Page Sales Based on the Customer
In this report page, there are reports sales qty per customer which is the sales report by sales based on the customer. In this report can be seen total customer at any company branch throughout Indonesia.
Figure 4. Report Page Sales Qty Per Customer Report Page Sales Based on the Outlet
Figure 5. Report Page Sales Qty Per Outlet Report Page Sales Based on Product Category
In this report page, there are reports of product sales by product category, in the report there are tables arrows when clicked arrows on behalf of the customer will see any item that is purchased by the customer.
Figure 6. Report Page Product Qty Per Category Report Page Sales Qty per Sales Area
Report page sales qty per area is based on sales reports by sales area. With the existence of this report, the user can view the data the sales made by each sales in various marketing areas.
Figure 7. Report Page Sales Qty Per Sales Area Report Page Sales Area Per Month
Report page sales area per month is reported by any sales proceeds in different area each month. With the existence of this report, the user can see how many items can be sold by sales per month.
Data Mining Analysis of Outlet Target Based on the Product Types
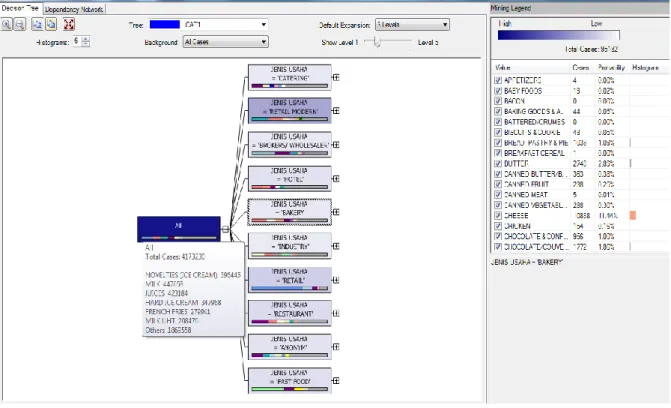
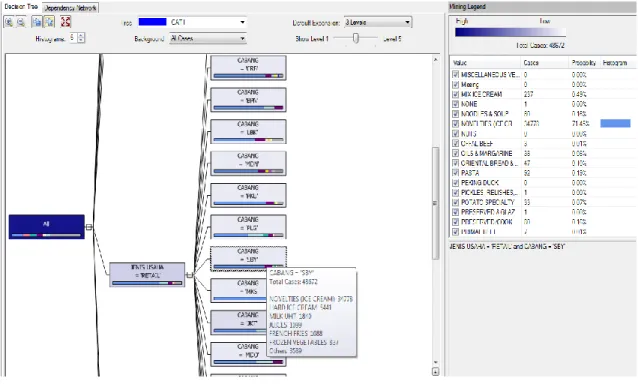
Data mining is carried out to analyze the outlet target based on the type of product that can be sold to the outlet views of the type of business. With the existence of data mining analysis, the executives can see the product sold in every type of business from existing outlets and executives can also see the probability of each product on each type of business.
Figure 9. Data Mining of Outlet Target Based on the Product Types Table 1. Model mining results table
Line of Business Types of products with the best potential to be marketed
Bakery Milk
Catering Hard Ice Cream Brokers/Wholesale Milk UHT Retail Modern Juices Industries Cream
Hotel Milk
Fast Food Uncategorized Products Anonym Hard Ice Cream
Figure 10. Data mining Level 3
Validation Trial
1. Validation of Sales Qty Per Branch
This validation done on Total Sales Qty in Java Island and the figure below is report from sales Qty per Branch in 2009.
1
4
5
-36,46 %
Validation description sales Qty Per Branch are as follows: 1. Sales Qty Validation of Java island
Sales Qty = The number of items are ordered by sales
Then the total sales Qty in Java island = 5.665.191 + 1.080.281 + 105.446.501 + 7.097.583 + 2.824.215 = 122.113.771
2. Sales Amount Validation of Cimahi branch
Sales Amount Validation of Cimahi branch have the following formula, Sales Amount = Sales Qty * Price.
The data retrieved was data warehouse price and sales Qty in Cimahi branch in 2009. The data can be seen in Figure 73.
2
Figure 12. Report Sales Qty Per Branch Sales Amount = Sales QTY x Price
Then one of Sales Amount of Java Island in Cimahi branch = 120 * 7.525,45 = 903.054
3. Validasi Total Cost
Total Cost = Cost x Sales Qty
Then one of Total Cost of Java Island in Cimahi branch = 200 * 738,2379935 = 147.647,5987
3
Figure 13. Report Sales Qty Per Branch 4. Profit Penjualan DiCimahi branch in 2009
Profit = Sales Amount – Total Cost
Profit of Cimahi branch in 2009 = 84.304.031.248 1.480.093.165.917 = -1.395.789.134.669 , this result together with the profit on Figure 72.
Profit of Cimahi branch in 2009 was minus, then cimahi branch sales in 2009 suffered losses.
5. Percent Profit Sales of Cimahi Branch in Year 2009
Percent Profit = ((Sales Amount – Total Cost) / Total Cost) x 100
Percent Profit of Cimahi branch in 2009 = ((84.304.031.248 - 1.480.093.165.917) / 1.480.093.165.917) x 100 = -94.30 %, the result is the same with percent profit on Figure 72. Percent profit of Cimahi branch in 2009 was minus, then cimahi branch sales in 2009 suffered losses. Validation formula for the other report is the same as the validation of report per branch.
CONCLUSION
The application of business intelligent on the distributor company has been implementated using Microsoft SQL Server 2008 and SQL Server Business Intelligence Development Studio. In this system, the master and transaction data entered to data warehouse using Extract Transform Load (ETL) process. After performing ETL process, the entered data into data warehouse has configured into become cube form, and then the cube has processed into Online Analytical Processing (OLAP) database to be data source in report making. OLAP database that has made, purposed to process many transaction data in every company branch into simple data and easy to understand (transaction process resume). The reports made in this system are sales report per region, report per branch, report per customer, report per outlet and report per product type. In those reports, contain summary sales qty, total sales amount, total cost, total profit and percent profit, which described the selling report based on the available report. The report served in dashboard form and report page can be opened with Microsoft Internet Explorer browser, so the report can be accessed with intranet or internet media. Besides the data warehouse used to create OLAP, the data warehouse can also used as data source to make data mining. Data mining implementation in this system used to determine the type of outlet based on product type that sold. In making of data mining model, decision tree algorithm used to find outlet target based on product types. Mining model obtained was served in form of mining model viewer, which is add ins from Microsoft Excel.
REFERRENCES
D J. Power, A Brief History of Decision Support Systems,DSSResources.com, 2002
Djoni Darmawikarta, Mengenal Data Warehouse, Ilmu Komputer, 2003
Ferenc Mantfeld, Why do BI implementation fails?, http://blogs.ittoolbox.com, 2006
Han, Jiawei & Kember, Michelin, Data mining Concepts & Techniques, Simon Fraser University Academic Press, USA 2001
Mike Steadman, The Value of BI for Association Executives, Association Xpertise Inc., 2003
Noverino Rifai, Kharizt Attria Gupta, Business Intelligence, ITB, 2004
Steve Williams, Nancy Williams, BI and Government Performance Management: Getting to Green, DM Review, 2004
__________, Data Warehouse, wikipedia.org
http://elib.unikom.ac.id/files/disk1/541/jbptunikompp-gdl-detianggru-27009-6-unikom_d-a.pdf