Blood Lead Levels and Mortality
Mark Lustberg, PhD; Ellen Silbergeld, PhD
Background:Despite declines in blood lead levels dur-ing the past 20 years, lead exposure continues to be a pub-lic health concern. Studies have linked lead exposure with increased risk for diverse health outcomes. Few studies have evaluated the association of lead exposure and mor-tality in the general population.
Methods:To evaluate the association of lead exposure and mortality in the United States, we used the recently released mortality follow-up data for participants of the Second National Health and Nutrition Examination Sur-vey, a national cross-sectional survey of the general popu-lation conducted from 1976 to 1980. Survey partici-pants aged 30 to 74 years with blood lead measurements were followed up through December 31, 1992 (n=4292). Results:After adjustment for potential confounders, in-dividuals with baseline blood lead levels of 20 to 29 µg/dL (1.0-1.4 µmol/L) had 46% increased all-cause mortality (rate
ratio [RR], 1.46; 95% confidence interval [CI], 1.14-1.86), 39% increased circulatory mortality (RR, 1.39; 95% CI, 1.01-1.91), and 68% increased cancer mortality (RR, 1.68; 95% CI, 1.02-2.78) compared with those with blood lead levels of less than 10 µg/dL (⬍0.5 µmol/L). All-cause mortality for those with blood lead levels of 10 to 19 µg/dL (0.5-0.9 µmol/L) was intermediately increased and not sta-tistically significant (RR, 1.17; 95% CI, 0.90-1.52). Conclusions:Individuals with blood lead levels of 20 to 29 µg/dL in 1976 to 1980 (15% of the US population at that time) experienced significantly increased all-cause, circulatory, and cardiovascular mortality from 1976 through 1992. Thus, we strongly encourage efforts to re-duce lead exposure for occupationally exposed workers and the 1.7 million Americans with blood lead levels of at least 20 µg/dL (ⱖ1.0 µmol/L).
Arch Intern Med. 2002;162:2443-2449
D
ESPITE THE DECLINEinblood lead levels during the past 20 years, lead continues to be a public health concern for indi-viduals with past and present lead expo-sure. Based on the 2000 census and analy-sis of the Third National Health and Nutrition Examination Survey (NHANES III) data by Pirkle et al,1we estimate that in the United States, at present 1.7 mil-lion people (0.6% of the population) have blood lead levels of at least 20 µg/dL (ⱖ1.0 µmol/L). Even more Americans have a his-tory of lead exposure. Based on the 2000 census and analysis of the Second Na-tional Health and Nutrition Examination Survey (NHANES II) data by Pirkle et al,1 we estimate that 29 million people (15% of the adult population older than 20 years) had blood lead levels of at least 20 µg/dL from 1976 to 1980.1A substantial num-ber of Americans, then, are currently ex-posed to lead or have a history of lead exposure.
The long-term consequences of lead exposure are not well understood. Re-sults of epidemiological and toxicologic studies have associated lead exposure with a number of disorders and disease pro-cesses, including learning and behavior orders, cardiovascular and kidney dis-eases, decreased fertility, and cancer.2-8On an individual level, the effect of lead on these disorders and disease processes may be subtle and dependent on age and sex as well as diverse genetic, dietary, and en-vironmental factors.9-11On the popula-tion level, however, lead exposure may contribute an important fraction to the morbidity and mortality associated with these disease processes.
Several occupational studies have evaluated mortality in lead-exposed work-ers, but no clear association of lead and mortality has emerged from these stud-ies.12-20For example, in a cohort of 3832 lead-exposed workers, Gerhardsson et al18 found significantly increased all-cause mortality in the cohort as a whole com-ORIGINAL INVESTIGATION
From the Department of Epidemiology and Preventive Medicine, University of Maryland School of Medicine (Dr Lustberg), and the Department of Environmental Health Sciences, Bloomberg School of Public Health, The Johns Hopkins University (Dr Silbergeld), Baltimore, Md.
pared with the general population, but decreased all-cause mortality in workers with the highest levels of lead exposure. Similarly, Wong and Harris19found signifi-cantly increased all-cause mortality in a cohort of 4518 lead-exposed battery workers, but decreased all-cause mortality in a cohort of 2300 lead-exposed smelter work-ers. Thus, occupational studies do not indicate either a dose-response relationship of industrial lead exposure and mortality, or a consistent association of lead exposure and mortality across cohorts.
Uncontrolled confounding and selection bias fur-ther complicate the picture, making interpretation of the occupational studies difficult. Lead-exposed workers may be different in many ways from the general population besides the lead exposure. Lead-exposed workers as a group may be more physically fit, and they may have dif-ferent diets and smoking patterns than individuals in the general population. The occupational studies generally do not present these types of data, so assessment of these effects as confounders or sources of selection bias is dif-ficult.12,13,15,16,18,20
Few studies have been conducted on lead and mor-tality in nonoccupationally lead-exposed individu-als.21,22 McDonald and Potter21conducted a follow-up study of 454 children who were hospitalized for lead poi-soning between 1923 and 1966. They found signifi-cantly increased all-cause mortality and signifisignifi-cantly in-creased cardiovascular and cerebrovascular deaths. Moller and Kristensen22conducted a population-based survey of 1052 men and women born in 1936 and living in Co-penhagen, Denmark. The authors found that, after ad-justment for potential confounders, blood lead levels were a significant predictor of all-cause mortality.
Similar studies of the general population of the United States are lacking. To evaluate the relation of lead exposure and mortality in the general population of the United States, we used the recently released mortality fol-low-up for participants of the NHANES II, which was con-ducted from 1976 to 1980.23,24
METHODS
The NHANES II was designed to provide a comprehensive evalu-ation of the health and nutritional status of free-living, nonin-stitutionalized individuals aged 6 months to 74 years in the United States. A total of 20 322 people were interviewed and examined for the survey. The interview included a detailed medi-cal history and an assessment of sociodemographic factors (eg, smoking, income, and education). Examination included a labo-ratory evaluation of hematologic and biochemical variables such as blood lead levels. Measurements of blood lead levels are avail-able for 10049 individuals (49.4% of the total study population). The plan and operation of the NHANES II and the methods for determining blood lead levels have been described previ-ously.23,25
Recently, the National Center for Health Statistics (Hy-attsville, Md) released mortality follow-up data for those indi-viduals aged 30 to 74 years at baseline in the NHANES II (n = 9252). The National Death Index and the Social Security Administration were used to ascertain vital status as of Decem-ber 31, 1992. Two individuals could not be followed up for vi-tal status owing to incomplete information and were excluded from the analysis (n = 9250). If no record of death was avail-able, individuals were assumed to be alive for the purpose of
analyses. During the course of follow-up, 2145 individuals died (crude mortality rate, 23.2%).24
Baseline measurements of blood lead levels were avail-able for 4292 individuals aged 30 to 74 years (46.4% of the mor-tality follow-up). As the purpose of this study was to examine the potential risks associated with lower levels of lead expo-sure, individuals with lead levels of at least 30 µg/dL (ⱖ1.4 µmol/L) were excluded from the analysis (n = 102). We chose this cut point because 30 µg/dL is the standard of the Occupa-tional Safety and Health Administration for monitoring of lead-exposed workers. Of the remaining 4190 individuals, 929 died during follow-up (crude mortality rate, 22.2%).
To allow for the complex, multistage survey design, all analyses were conducted using SUDAAN software (Research Triangle Institute, Research Triangle, NC). We chose to weight each individual equally in the analysis, as the weights pro-vided with the NHANES II data were designed to be used for individuals aged 6 months to 74 years. We analyzed the sub-group of individuals aged 30 to 74 years with mortality fol-low-up and blood lead levels of less than 30 µg/dL. Weights specifically appropriate for this group were not available. We also chose not to use the weights because we present exten-sive subgroup analyses in this report, and the weights were not designed for this.
Survival analysis was conducted using the proportional haz-ards models available in SUDAAN (PROC SURVIVAL; Re-search Triangle Institute). Covariates for the analysis were se-lected on the basis of well-established factors that are known to be associated with lead.26We considered the following 2 sets of models: age- and sex-adjusted (using age as a quadratic) mod-els and multivariate-adjusted modmod-els. The multivariate model contained the following covariates: age, sex, race (white vs Af-rican AmeAf-rican and other nonwhite), education (report of any vs no college education), income (represented as a 5-level vari-able), smoking (represented as lifetime nonsmoking, cur-rently smoking⬍1 pack/d, currently smokingⱖ1 pack/d, and former smoking), body mass index (BMI, calculated as weight in kilograms divided by the square of height in meters), exer-cise (report of moderate or frequent exerexer-cise), and location (ur-ban, rural, or suburban). Lifetime nonsmoking was defined as smoking less than 5 packs of cigarettes ever. Education and a 5-level representation of income were included in the model to control as thoroughly as possible for socioeconomic status. A small number of individuals did not report their incomes, so amissingcategory was created (n = 152 [3.6%]). In analyses of the association of lead level and mortality, lead level was in-corporated in the model as a 3-level categorical variable (⬍10 µg/dL [⬍0.5 µmol/L], 10-19 µg/dL [0.5-0.9 µmol/L], and 20-29 µg/dL [1.0-1.4 µmol/L]). The final regression models con-verged, so overparameterization was not a concern.
We performed stratified analyses of the association of lead levels and mortality. All models were sex and age adjusted. For the analysis, continuous variables such as BMI and age were dichotomized. In the age-stratified models (30-54 andⱖ55 years), age is represented as a covariate within the model to control for age. Subgroups for analysis were chosen to present as concise and meaningful an analysis as possible. Rather than looking at 5 subgroups of income, for example, reported in-come was dichotomized.
We used codes of theInternational Classification of Dis-eases, Ninth Revision(ICD-9) to provide cause-of-death infor-mation. To examine whether the relation of lead level and death varied by cause of death, we divided deaths into 3 categories based on theICD-9code: circulatory (45.6% of deaths;ICD-9
codes 390-459), cancer (25.8% of deaths;ICD-9codes 140-240), and all other causes (all otherICD-9codes).
Because the US lead standards are expressed in micro-grams per deciliter, we report lead concentrations in this
ar-ticle in these units; SI units (micromoles per liter) are given parenthetically at first mention of specific values and ranges.
RESULTS
Table 1presents descriptive characteristics of the study cohort. The cohort represented men and women of di-verse races, educational backgrounds, living locations, smoking histories, and incomes. The mean age of the co-hort was 54 years, with a range of 30 to 74 years at base-line. The median blood lead level of the cohort was 13 µg/dL (0.6 µmol/L). During follow-up, 929 individuals (22.2%) died, with 424 (10.1%) dying of circulatory dis-ease and 240 (5.7%) dying of cancer.
Table 2presents a multivariate linear regression model for blood lead level. Age, sex, race, location, smok-ing, BMI, exercise, education, and income were in-cluded in the model. Collectively these variables are as-sociated with 22.5% of the variance in blood lead levels. Male sex, increased age, urban location, exercise, in-creased smoking, and inin-creased BMI were all positively associated with baseline blood lead levels, whereas white race, college education, and increased income were all negatively associated with blood lead levels.
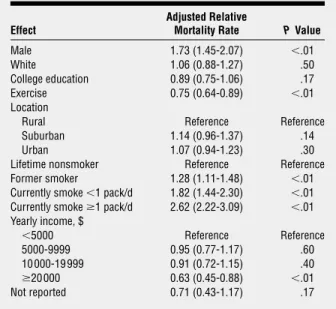
Table 3presents a multivariate proportional haz-ards model for mortality during follow-up. Blood lead level
was not included in this model. Age, sex, race, location, smoking, BMI, exercise, education, and income were in the model. Male sex, increased age, increased smoking, decreased exercise, and decreased income were all posi-tively associated with mortality, whereas BMI, educa-tion, race, and urban/suburban/rural location were not associated with mortality.
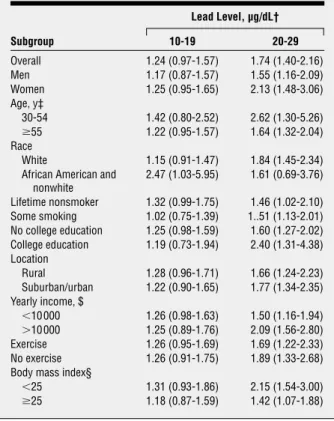
Table 4presents the association of blood lead lev-els and mortality, adjusted for age and sex, for the co-hort as a whole and subgroups of interest. In the coco-hort Table 1. Characteristics of the Study Population*
Characteristic Overall Cohort (n = 4190) Mortality During Follow-up (n = 929) Age, mean ± SD, y 54.1 ± 13.2 64.0 ± 8.6 Body mass index, mean ± SD† 26.1 ± 5.1 26.1 ± 5.2 Blood lead level, mean ± SD, µg/dL‡ 14.0 ± 5.1 14.9 ± 5.3 Male 1950 (46.5) 542 (58.3) Race White 3666 (87.5) 818 (88.1) African American 438 (10.5) 98 (10.5) Other nonwhite 86 (2.1) 13 (1.4) Exercise 2466 (58.9) 488 (52.5) College education 1024 (24.4) 156 (16.8) Location Urban 1864 (44.5) 411 (44.2) Suburban 698 (16.7) 163 (17.5) Rural 1628 (38.9) 355 (38.2) Lifetime nonsmoker 1809 (43.2) 320 (34.4) Former smoker 1030 (24.6) 271 (29.2) Currently smoke⬍1 pack/d 474 (11.3) 112 (12.1) Currently smokeⱖ1 pack/d 877 (20.9) 226 (24.3) Yearly income, $ ⬍5000 680 (16.2) 233 (25.1) 5000-9999 1022 (24.4) 297 (32.0) 10000-19999 1332 (31.8) 257 (27.7) ⱖ20000 1004 (24.0) 111 (11.9) Not reported 152 (3.6) 31 (3.3) Lead level, µg/dL‡ ⬍10 818 (19.5) 130 (14.0) 10-19 2735 (65.3) 605 (65.1) 20-29 637 (15.2) 194 (20.9) *Unless otherwise indicated, data are given as number (percentage) of subjects. Percentages have been rounded and may not sum to 100.
†Calculated as weight in kilograms divided by the square of height in meters. ‡To convert to micromoles per liter, multiply by 0.0483.
Table 2. Multivariate Regression Model for Associations With Baseline Blood Level*
Effect
Adjusted Relative
Lead Level, µg/dL† PValue Male 3.6 ± 0.2 ⬍.01 White −1.0 ± 0.4 .01 Exercise 0.7 ± 0.4 ⬍.01 College education −0.4 ± 0.2 .04 Location
Rural Reference Reference Suburban 0.6 ± 0.4 .11 Urban 1.9 ± 0.4 ⬍.01 Lifetime nonsmoker Reference Reference Former smoker 0.5 ± 0.2 .03 Currently smoke⬍1 pack/d 1.4 ± 0.2 ⬍.01 Currently smokeⱖ1 pack/d 2.5 ± 0.2 ⬍.01 Yearly income, $ ⬍5000 Reference Reference 5000-9999 −0.3 ± 0.3 .30 10 000-19 999 −0.6 ± 0.2 .02 ⱖ20 000 −0.9 ± 0.3 ⬍.01 Not reported −0.9 ± 0.4 .04 *Effects are also adjusted for age and body mass index (calculated as weight in kilograms divided by the square of height in meters).
†To convert to micromoles per liter, multiply by 0.0483.
Table 3. Multivariate Regression Model for Associations With Mortality During Follow-up*
Effect
Adjusted Relative
Mortality Rate PValue Male 1.73 (1.45-2.07) ⬍.01 White 1.06 (0.88-1.27) .50 College education 0.89 (0.75-1.06) .17 Exercise 0.75 (0.64-0.89) ⬍.01 Location
Rural Reference Reference Suburban 1.14 (0.96-1.37) .14 Urban 1.07 (0.94-1.23) .30 Lifetime nonsmoker Reference Reference Former smoker 1.28 (1.11-1.48) ⬍.01 Currently smoke⬍1 pack/d 1.82 (1.44-2.30) ⬍.01 Currently smokeⱖ1 pack/d 2.62 (2.22-3.09) ⬍.01 Yearly income, $ ⬍5000 Reference Reference 5000-9999 0.95 (0.77-1.17) .60 10 000-19 999 0.91 (0.72-1.15) .40 ⱖ20 000 0.63 (0.45-0.88) ⬍.01 Not reported 0.71 (0.43-1.17) .17 *Effects are also adjusted for age and body mass index (calculated as weight in kilograms divided by the square of height in meters). Data are given as rate ratio (95% confidence interval).
as a whole, blood lead levels of 20 to 29 µg/dL were as-sociated with an age- and sex-adjusted increase of 74% (rate ratio [RR], 1.74; 95% confidence interval [CI], 1.40-2.16) in all-cause mortality, and blood lead levels of 10 to 19 µg/dL, with an age- and sex-adjusted increase of 24% (RR, 1.24; 95% CI, 0.97-1.57) in all-cause mortal-ity compared with blood lead levels of less than 10 µg/ dL. These associations were reasonably consistent across subgroups defined by sex, age, race, smoking, educa-tion, income, exercise level, and BMI.
Table 5presents the association of blood lead level and mortality in the cohort as a whole, adjusted for mul-tiple potential confounding variables (using the model presented in Table 3). After adjustment for multiple po-tential confounders (specifically age, sex, location, edu-cation, race, income, smoking, BMI, and exercise), blood lead levels of 20 to 29 µg/dL were associated with a 46% increased mortality (RR, 1.46; 95% CI, 1.14-1.86) and blood lead levels of 10 to 19 µg/dL, with a 17% in-creased mortality (RR, 1.17; 95% CI, 0.90-1.52) com-pared with blood lead levels of less than 10 µg/dL.
As shown in Table 5, the crude mortality RRs were higher than the age-/sex- and multivariate-adjusted RRs, and the age-/sex-adjusted RRs were higher than the mul-tivariate-adjusted RRs. The difference between the age-/ sex-adjusted and multivariate-adjusted RRs was almost
completely attributable to introducing smoking into the regression model. Introducing location, education, race, income, BMI, and exercise into the age-/sex-adjusted model did not affect the age-/sex-adjusted RRs or the re-gression coefficients from which they were derived.
Table 5 also presents the association of blood lead level and mortality by cause of death, adjusted for mul-tiple potential confounders. Subjects with blood lead levels of 20 to 29 µg/dL had significantly increased mor-tality due to circulatory disease (RR, 1.39; 95% CI, 1.01-1.91;P= .04) and cancer (RR, 1.68; 95% CI, 1.02-2.78; P= .03) compared with those with blood lead levels of less than 10 µg/dL. Collectively, mortality due to circu-latory disease and cancer accounted for 71.4% of the mortality in this cohort.
Analysis by specific cancer-caused mortality indi-cates that blood lead level was associated with mortality due to lung cancer and nonlung cancers. After adjust-ment for multiple potential confounding variables (in-cluding smoking), individuals with blood lead levels of 20 to 29 µg/dL had 50% increased mortality due to non-lung cancers (RR, 1.50; 95% CI, 0.80-2.81) and 120% in-creased mortality due to lung cancer (RR, 2.20; 95% CI, 0.80-6.06) compared with those with blood lead levels of less than 10 µg/dL. Those with blood lead levels of 10 to 19 µg/dL experienced increased mortality due to non-lung cancers (RR, 1.45; 95% CI, 0.76-2.76) and non-lung can-cer (RR, 1.70; 95% CI, 0.60-4.81) as well, compared with those with blood lead levels of less than 10 µg/dL.
Close examination of Table 4 indicates that Afri-can AmeriAfri-can and other nonwhite subjects experienced increased mortality at lower blood lead levels than did white subjects. To explore this interaction, we evalu-ated a multivariate regression model for all-cause mor-Table 4. All-Cause Mortality by Lead Level and Subgroup*
Subgroup Lead Level, µg/dL† 10-19 20-29 Overall 1.24 (0.97-1.57) 1.74 (1.40-2.16) Men 1.17 (0.87-1.57) 1.55 (1.16-2.09) Women 1.25 (0.95-1.65) 2.13 (1.48-3.06) Age, y‡ 30-54 1.42 (0.80-2.52) 2.62 (1.30-5.26) ⱖ55 1.22 (0.95-1.57) 1.64 (1.32-2.04) Race White 1.15 (0.91-1.47) 1.84 (1.45-2.34) African American and
nonwhite 2.47 (1.03-5.95) 1.61 (0.69-3.76) Lifetime nonsmoker 1.32 (0.99-1.75) 1.46 (1.02-2.10) Some smoking 1.02 (0.75-1.39) 1..51 (1.13-2.01) No college education 1.25 (0.98-1.59) 1.60 (1.27-2.02) College education 1.19 (0.73-1.94) 2.40 (1.31-4.38) Location Rural 1.28 (0.96-1.71) 1.66 (1.24-2.23) Suburban/urban 1.22 (0.90-1.65) 1.77 (1.34-2.35) Yearly income, $ ⬍10 000 1.26 (0.98-1.63) 1.50 (1.16-1.94) ⬎10 000 1.25 (0.89-1.76) 2.09 (1.56-2.80) Exercise 1.26 (0.95-1.69) 1.69 (1.22-2.33) No exercise 1.26 (0.91-1.75) 1.89 (1.33-2.68) Body mass index§
⬍25 1.31 (0.93-1.86) 2.15 (1.54-3.00) ⱖ25 1.18 (0.87-1.59) 1.42 (1.07-1.88) *Subgroups are adjusted for age and sex. For purposes of analysis, the reference group is the lead level less than 10 µg/dL. Data are given as rate ratio (95% confidence interval).
†To convert to micromoles per liter, multiply by 0.0483.
‡In the age-stratified models, age is represented as a covariate to control for confounding by age in each age group.
§Calculated as weight in kilograms divided by the square of height in meters.
Table 5. All-Cause, Circulatory Disease, and Cancer Mortality by Lead Level*
Mortality Lead Level, µg/dL† 10-19 20-29 Crude All-cause 1.40 (1.16-1.69) 2.02 (1.62-2.52) Circulatory disease 1.27 (0.97-1.57) 1.74 (1.25-2.40) Cancer 1.95 (1.28-2.98) 2.89 (1.79-4.64) Sex and age adjusted
All-cause 1.24 (0.97-1.57) 1.74 (1.40-2.16) Circulatory disease 1.11 (0.87-1.42) 1.48 (1.10-2.01) Cancer 1.70 (1.04-2.78) 2.39 (1.46-3.90) Multivariate adjusted‡ All-cause 1.17 (0.90-1.52) 1.46 (1.14-1.86) Circulatory disease 1.10 (0.85-1.43) 1.39 (1.01-1.91) Cancer 1.46 (0.87-2.48) 1.68 (1.02-2.78) *For purposes of analysis, the reference group is the lead level less than 10 µg/dL.
†To convert to micromoles per liter, multiply by 0.0483.
‡The multivariate model includes the following covariates: age, sex, race (white and African American/other nonwhite); education (report of any vs no college education); income (represented as a 5-level variable); smoking (represented as lifetime nonsmoking, currently smoking⬍1 pack/d, currently smokingⱖ1 pack/d, and former smoking); body mass index (calculated as the weight in kilograms divided by the square of the height in meters); exercise (report of moderate or frequent exercise); and location (urban, rural, or suburban).
tality with interaction terms for race and blood lead level (using the same effects as previously described). The model indicates that even after adjustment for potential confounders, nonwhite subjects experienced signifi-cantly increased mortality at lower blood lead levels than did white subjects (P⬍.001 for the interaction). In Afri-can AmeriAfri-can subjects, blood lead levels of 10 to 19 µg/dL were associated with a 2.63-fold increase in multivari-ate adjusted all-cause mortality relative to blood lead lev-els of less than 10 µg/dL (RR, 2.63; 95% CI, 1.12-6.19; P= .02). In white subjects, blood lead levels of 10 to 19 µg/dL were associated with a 7% increase in multivari-ate adjusted all-cause mortality relative to blood lead lev-els of less than 10 µg/dL (RR, 1.07; 95% CI, 0.83-1.40). These data also indicated an interaction between heavy smoking (ⱖ1 pack/d) and blood lead level on mor-tality due to cancer (interaction,P= .07). Smoking was associated with higher cancer mortality in those with blood lead levels of 20 to 29 µg/dL compared with those with blood lead levels of less than 20 µg/dL. In those with blood lead levels of less than 20 µg/dL, smoking at least 1 pack/d was associated with a multivariate adjusted 2.70-fold increase in mortality due to cancer (RR, 2.70; 95% CI, 1.97-3.71) compared with those who currently smoked less or not at all. In those with blood lead levels of 20 to 29 µg/dL, smoking at least 1 pack/d was associated with an adjusted 4.67-fold increase in mortality due to can-cer (RR, 4.67; 95% CI, 2.13-10.25) compared with those who currently smoked less or not at all. These data did not indicate a similar interaction of smoking and mor-tality due to circulatory disease.
COMMENT
These data indicate that blood lead level is an important predictor of mortality due to all causes, circulatory dis-ease, and cancer. After adjustment for potential con-founding variables (including age, sex, smoking, BMI, edu-cation, loedu-cation, exercise, and income), individuals with baseline blood lead levels of 20 to 29 µg/dL experience 46% increased mortality due to all causes (RR, 1.46; 95% CI, 1.14-1.86;P= .003), 39% increased mortality due to circulatory disease (RR, 1.39; 95% CI, 1.01-1.91;P=.04), and 68% increased mortality due to cancer (RR, 1.68; 95% CI, 1.02-2.78;P= .04) relative to those with blood lead levels of less than 10 µg/dL. After adjustment for poten-tial confounding variables, individuals with blood lead levels of 10 to 19 µg/dL experience 17% increased mor-tality due to all causes (RR, 1.17; 95% CI, 0.90-1.52), 10% increased mortality due to circulatory disease (RR, 1.10; 95% CI, 0.85-1.43), and 46% increased mortality due to cancer (RR, 1.46; 95% CI, 0.87-2.48) relative to those with blood lead levels of less than 10 µg/dL.
Stratified analysis by age, sex, race, smoking, edu-cation, rural/suburban/urban loedu-cation, income, exer-cise, and BMI indicates that the association of blood lead level and all-cause mortality is reasonably consistent over-all and across subgroups and argues against confound-ing by these variables as an explanation for these data. If the association of blood lead level and all-cause mortal-ity is a product of confounding, the confounder would seem to be something other than a measured
socioeco-nomic factor (eg, education, income, or race) or a mea-sured lifestyle factor (eg, location of residence, smok-ing, or physical activity level).
Stratified analysis indicates that African American and other nonwhite subjects have increased mortality at lower blood lead levels than white subjects (the interac-tion effect is statistically significant in a multivariate model, withP⬍.001). In the nonwhite subjects, those with baseline blood lead levels of 10 to 19 µg/dL experi-ence a 2.63-fold increase in multivariate adjusted all-cause mortality compared with those with blood lead levels of less than 10 µg/dL (RR, 2.63; 95% CI, 1.12-6.19;P= .02). In white subjects, those with blood lead levels of 10 to 19 µg/dL experience only a 7% increase in multivariate adjusted all-cause mortality compared with those with blood lead levels of less than 10 µg/dL (RR, 1.07; 95% CI, 0.83-1.40).
It is unclear why nonwhite subjects experience in-creased mortality at lower blood lead levels than white sub-jects in these data. Several hypotheses could be advanced to explain this finding. Some unidentified factor could in-crease the sensitivity of African American subjects to the effects of lead exposure. Alternatively, a one-time cross-sectional blood lead level may describe different lead ex-posures in white and African American subjects. A one-time blood lead level may represent, on average, higher cumulative or past lead exposures in African American and other nonwhite subjects than the same blood lead level in white subjects. In African American subjects, then, mor-tality may increase at lower blood lead levels. In the NHANES II, no indices of cumulative lead exposure (such as bone lead levels) are included, so this hypothesis can-not be tested in these data. We have no way of correlating cumulative lead levels (the exposure of interest) with mor-tality. Instead, we are forced to rely on a one-time blood lead level as a biomarker for cumulative lead exposure. Thus, we recommend that future studies on lead and mor-tality (or more generally, morbidity) consider multiple blood lead levels over time or bone lead levels, so that cu-mulative and past lead exposures can be estimated. Such studies would have the advantage of mitigating method-ological concerns about the interpretability of a single cross-sectional blood lead measurement as a biomarker for cu-mulative or past lead levels.
Several occupational studies have attempted to evalu-ate the association of lead exposure and mortality. How-ever, no clear picture emerges from these studies be-cause of conflicting data and limitations in study design. Typically, the occupational studies use standardized mor-tality rates and compare mormor-tality in the occupational co-hort to what is expected in the general population. Al-though frequently used, this approach is limited by the fact that industrial workers often differ from individuals in the general population in additional ways besides the occupational exposure. Industrial workers, for ample, may be more physically fit and less likely to ex-perience certain forms of mortality (eg, ischemic heart disease), a phenomenon known as the healthy-worker effect.27Industrial workers may also have different life-style characteristics than the general population, such as different smoking habits. This finding may explain why investigators have found increased lung cancer
mortal-ity in some lead-exposed occupational cohorts and not others.15,18,20,28,29Confounding coexposures such as ar-senic, cadmium, and silica may also complicate the pic-ture further. Lead in these cases may be a marker for ex-posure to several metals (such as arsenic and cadmium) that often co-occur with lead exposure.12,13Thus, inter-pretation of the occupational literature is difficult.
Few studies have considered the association of nonoccupational lead exposure and mortality. Moller and Kristensen22conducted a population-based survey of 1052 men and women born in 1936 and living in Copenhagen. After adjustment for tobacco use, choles-terol level, physical activity, and sex, they found a sta-tistically significant association of total mortality and blood lead level.
Evidence is accumulating that lead exposure is as-sociated with increased blood pressure, and ultimately circulatory disease. Some studies indicate that lead-fed animals have increased pressor responses and increased vascular reactivity to norepinephrine.30Picomolar con-centrations of lead have been shown to activate protein kinase C,31a major regulator of vascular tone. Lead-fed rodents have increased blood pressure at doses that pro-duce blood lead levels similar to those found in hu-mans.32Epidemiological studies on the association of blood lead levels and hypertension have presented con-flicting findings. However, in a meta-analysis of 15 stud-ies on blood lead levels and blood pressure in men, Schwartz33concluded that a 5-µg/dL (0.2-µmol/L) in-crease in blood lead level (from 5-10 µg/dL [0.2-0.5 µmol/ L]) is associated with an increase in systolic blood pres-sure of 1.25 mm Hg (95% CI, 0.87-1.63 mm Hg).
The choice of blood lead level as a biomarker for lead exposure may be a reason for the inconsistent findings across epidemiological studies on lead and blood pres-sure. A recent prospective study by Cheng et al34 high-lights this point. They found that bone lead level pre-dicts the onset of hypertension, whereas blood lead level does not. If the effects of lead on hypertension accrue over time, a single cross-sectional blood lead level measure-ment (which would be heavily influenced by recent lead exposure) may not be expected to correlate very strongly with hypertension. Few studies have looked at the asso-ciation of cumulative measures of lead exposure and blood pressure.
Evidence also suggests that lead exposure may in-crease susceptibility to cancer. Lead may exert diverse toxic effects on cells, disrupting the ability of cells to develop appropriate and precise responses to genotoxic environ-mental agents.5By replacing zinc in zinc-finger loop pro-teins, lead is thought to alter the ability of some transcrip-tion factors to bind DNA and activate expression of genes that could be involved in a diversity of functions.35By bind-ing and depletbind-ing glutathione, a free radical scavenger and an antioxidant, lead may decrease the ability of cells to buffer the effects of certain genotoxins.36Lead may inter-fere with the ability of DNA to repair itself after geno-toxic insult.37By binding histones, lead may decrease the protection these proteins give DNA, directly increasing the exposure of DNA to damaging agents.38
Experimental studies on lead and cancer have gen-erally evaluated lead alone, usually at relatively high doses
of lead. The ability of lead to increase susceptibility to agents that cause cancer has been understudied.5Some investigators have found that lead in vitro increases the mutagenicity of radiation and carcinogens. Roy and Ross-man39found that in transgenic hamster cells, lead in-creased the mutagenicity of UV-C andN-methyl-N′ -nitro-N-nitrosoguanidine (a carcinogen) at doses at which lead is not otherwise mutagenic; this finding confirmed a similar report by Hartwig et al.40
These data lend support to the hypothesis that lead increases susceptibility to genotoxins. We observed an interaction between heavy smoking and blood lead lev-els on cancer mortality (P=.07). One explanation for these findings is that lead increases the sensitivity of lung cell DNA to damage by the carcinogens in cigarette smoke, and/or lead decreases the ability of the DNA to repair it-self after such damage.
CONCLUSIONS
These data indicate the importance of additional invtigations into the long-term effects of inorganic lead, es-pecially given the current Occupational Safety and Health Administration safety limits for lead. In this cohort, over-all, cardiovascular, and cancer mortality increase at lead levels of 20 to 29 µg/dL, well below the current Occu-pational Safety and Health Administration action level of 50 µg/dL (2.4 µmol/L) for removing workers who are occupationally exposed to lead.41We recommend addi-tional studies on the associations of lead and mortality due to cardiovascular disease and cancer in the general population (studies have generally focused on occupa-tional cohorts). We also recommend that future studies on lead evaluate it in combination with other agents to see whether lead increases the ability of these agents to cause disease.
We would like to comment on the range of lead lev-els represented in the NHANES II cohort.1,42Conducted from 1976 to 1980, the median blood lead level in the NHANES II was 13 µg/dL for individuals aged 30 to 74 years. The median blood lead level in the NHANES III, conducted from 1988 to 1994, was 3 µg/dL (0.1 µmol/L) for this same age group.42Thus, by today’s standards, the blood lead levels in the NHANES II are relatively high. However, it is important to remember that individuals presently 50 years or older experienced the more el-evated lead exposures these blood lead levels represent and may be at increased risk for mortality because of these exposures.
Given the strength and consistency of the associa-tion of mortality and lead observed in these data, we are particularly concerned for workers who are occupation-ally exposed to lead, many of whom continue to have blood lead levels of at least 25 µg/dL (1.2 µmol/L),43and the 1.7 million Americans with blood lead levels of at least 20 µg/dL. Thus, we strongly encourage programs of lead abatement and other efforts to reduce lead exposure. In light of these data and the literature on effects of lead lev-els of less than 30 µg/dL, we suggest that it may be pru-dent to reconsider the present occupational standards for blood lead levels.
Accepted for publication April 3, 2002.
This study was supported by a National Research Ser-vice Award from the National Institute of Environmental Health Sciences, Bethesda, Md (grant F30-ES05922-02), and grant ATPM TS288-14/14 from the Centers for Disease Con-trol and Prevention, Atlanta, Ga, through the Association of Teachers of Preventive Medicine, Washington, DC.
Corresponding author and reprints: Mark Lustberg, PhD, Department of Epidemiology and Preventive Medicine, Uni-versity of Maryland School of Medicine, 660 W Redwood St, Baltimore, MD 21201 (e-mail: [email protected]).
REFERENCES
1. Pirkle JL, Brody DJ, Gunter EW, et al. The decline in blood lead levels in the United States: the National Health and Nutrition Examination Surveys (NHANES).JAMA. 1994;272:284-291.
2. Rice DC. Behavioral effects of lead: commonalities between experimental and epidemiologic data.Environ Health Perspect. 1996;104:337-351.
3. Kopp SJ, Barron JT, Tow JP. Cardiovascular actions of lead and relationship to hypertension: a review.Environ Health Perspect. 1988;78:91-99.
4. Loghman-Adham M. Renal effects of environmental and occupational lead exposure.Environ Health Perspect. 1997;105:928-939.
5. Silbergeld EK, Waalkes M, Rice JM. Lead as a carcinogen: experimental evidence and mechanisms of action.Am J Ind Med. 2000;38:316-323. 6. Landrigan PJ, Boffetta P, Apostoli P. The reproductive toxicity and
carcino-genicity of lead: a critical review.Am J Ind Med. 2000;38:231-243. 7. Feldman RG, White RF. Lead neurotoxicity and disorders of learning.J Child
Neurol. 1992;7:354-359.
8. Hertz-Picciotto I, Croft J. Review of the relation between blood lead and blood pressure.Epidemiol Rev. 1993;15:352-373.
9. Onalaja AO, Claudio L. Genetic susceptibility to lead poisoning.Environ Health Perspect. 2000;108:23-28.
10. Mahaffey K. Environmental lead toxicity: nutrition as a component of interven-tion.Environ Health Perspect. 1990;89:75-80.
11. Gurer H, Ercal N. Can antioxidants be beneficial in the treatment of lead poison-ing?Free Radic Biol Med. 2000;20:927-945.
12. Lundstrom NG, Nordberg G, Englyst V, et al. Cumulative lead exposure in relation to mortality and lung cancer mortality in a cohort of primary smelter workers.Scand J Work Environ Health. 1997;23:24-30.
13. Cocco P, Hua F, Boffetta P, et al. Mortality of Italian lead smelter workers.Scand J Work Environ Health. 1997;23:15-23.
14. Anttila A, Heikkila P, Pukkala E, et al. Excess lung cancer among workers ex-posed to lead.Scand J Work Environ Health. 1995;21:460-469.
15. Cooper WC, Wong O, Kheifets L. Mortality among employees of lead battery plants and lead-producing plants, 1947-1980.Scand J Work Environ Health. 1985;11: 331-345.
16. Michaels D, Zoloth SR, Stern FB. Does low level lead exposure increase risk of death? a mortality study of newspaper printers.Int J Epidemiol. 1991;20:978-983.
17. Steenland K, Selevan S, Landrigan P. The mortality of lead smelter workers: an update.Am J Public Health. 1992;82:1641-1644.
18. Gerhardsson L, Lundstrom NG, Nordberg G, Wall S. Mortality and lead expo-sure: a retrospective cohort study of Swedish smelter workers.Br J Ind Med. 1986;43:707-712.
19. Wong O, Harris F. Cancer mortality study of employees at lead battery plants and smelters, 1947-1995.Am J Ind Med. 2000;38:255-270.
20. Gerhardsson L, Hagmar L, Rylander L, Skerfving S. Mortality and cancer
inci-dence among secondary lead smelter workers.Occup Environ Med. 1995;52: 667-672.
21. McDonald JA, Potter NU. Lead’s legacy? early and late mortality of 454 lead-poisoned children.Arch Environ Health. 1996;51:116-121.
22. Moller L, Kristensen T. Blood lead as a cardiovascular risk factor.Am J Epide-miol. 1992;136:1091-1100.
23. McDowell A, Engle A, Massey J, Maurer K. Plan and operation of the Second National Health and Nutrition Survey, 1976-1980.Vital Health Stat 1. 1981;No. 15:1-144.
24. Loria C, Sempos C, Vuong C. Plan and operation of the NHANES II Mortality Study, 1992.Vital Health Stat 1. 1999; No. 38:1-16.
25. Gunter EW, Turner WE, Neese JW, Bayse DB.Laboratory Procedures Used by the Clinical Chemistry Division, Centers for Disease Control, for the Second Na-tional Health and Nutrition Examination Survey (NHANES II), 1976-1980. At-lanta, Ga: US Dept of Health and Human Services, Centers for Disease Control, Center for Environmental Health, Nutritional Biochemistry Branch; 1982. 26. Brody D, Pirkle J, Kramer R, et al. Blood lead levels in the US population: phase
1 of the Third National Health and Nutrition Examination Survey (NHANES III, 1988 to 1991).JAMA. 1994;272:277-283.
27. Baillargeon J. Characteristics of the healthy worker effect.Occup Med. 2001;16: 359-366.
28. Malcolm D, Barnett HA. A mortality study of lead workers, 1925-1976.Br J Ind Med. 1982;39:404-410.
29. Dingwall-Fordyce I, Lane R. A follow-up study of lead workers.Br J Ind Med. 1963;20:313-315.
30. Chai SS, Webb RC. Effects of lead on vascular reactivity.Environ Health Perspect. 1988;78:85-89.
31. Markovac J, Goldstein GW. Picomolar concentrations of lead stimulate brain pro-tein kinase C.Nature. 1988;334:71-73.
32. Perry HM, Erlanger MW, Perry EF. Increase in the blood pressure of rats chroni-cally fed low levels of lead.Environ Health Perspect. 1988;78:107-111. 33. Schwartz J. Lead, blood pressure, and cardiovascular disease in men.Arch
Environ Health. 1995;50:31-37.
34. Cheng Y, Schwartz J, Sparrow D, Aro A, Weiss ST, Hu H. Bone lead and blood lead levels in relation to baseline blood pressure and the prospective develop-ment of hypertension: the Normative Aging Study.Am J Epidemiol. 2001;153: 164-171.
35. Zawia NH, Crumpton T, Brydie M, Reddy GR, Razmiafshari M. Disruption of the zinc finger domain: a common target that underlies many of the effects of lead.
Neurotoxicology. 2000;21:1069-1080.
36. Hunaiti AA, Soud M. Effect of lead concentration on the level of glutathione, glu-tathione S-transferase, reductase, and peroxidase in human blood.Sci Total Environ. 2000;248:45-50.
37. Hartwig A. Role of DNA repair inhibition in lead and cadmium induced genotox-icity: a review.Environ Health Perspect. 1994;102:45-50.
38. Quintanilla-Vega B, Hoover D, Bal W, Silbergeld EK, Waalkes MP, Anderson LD. Lead effects on protamine-DNA binding.Am J Ind Med. 2000;38:324-329. 39. Roy N, Rossman T. Mutagenesis and comutagenesis by lead compounds.
Mu-tat Res. 1992;298:97-103.
40. Hartwig A, Schlepegrell R, Beyersmann D. Indirect mechanism of lead-induced genotoxicity in cultured mammalian cells.Mutat Res. 1990;241:75-82. 41. Occupational Safety and Health Administration. Occupational exposure to lead.
43Federal Register54353-54616 (1978).
42. US Department of Health and Human Services (DHHS), National Center for Health Statistics.Third National Health and Nutrition Examination Survey, 1988-1994, NHANES III Laboratory Data File[CD-ROM]. Hyattsville, Md: Centers for Disease Control and Prevention; 1996. Public use data file documentation 76200.
43. Adult blood lead epidemiology and surveillance: United States, second and third quarters, 1998, and annual 1994-1997.MMWR Morb Mortal Wkly Rep. 1999; 48:213-216, 223.