Volatility modeling and
limit-order book analytics
with high-frequency data
MARTIN MAGRIS
Tampere University Dissertations 106
MARTIN MAGRIS
Volatility modeling and
limit-order book analytics
with high-frequency data
ACADEMIC DISSERTATION To be presented, with the permission of the Faculty of Engineering and Natural Sciences
of Tampere University,
for public discussion in the Lecture room K1702 of the Konetalo building, Korkeakoulunkatu 6, Tampere,
ACADEMIC DISSERTATION
Tampere University, Faculty of Engineering and Natural Sciences Finland Responsible supervisor and Custos Professor Juho Kanniainen Tampere University Finland
Pre-examiners Assistant Professor
Matthew Dixon
Illinois Institute of Technology USA
Associate Professor Marcelo C. Medeiros
Pontifical Catholic University of Rio de Janeiro Brazil Opponent Professor Michael McAleer Asia University Taiwan University of Sydney Australia
Erasmus University Rotterdam The Netherlands
Complutense University of Madrid Spain
Yokohama National University Japan
The originality of this thesis has been checked using the Turnitin Originality Check service.
Copyright ©2019 Martin Magris Cover design: Roihu Inc.
ISBN 978-952-03-1195-7 (print) ISBN 978-952-03-1196-4 (pdf) ISSN 2489-9860 (print) ISSN 2490-0028 (pdf) http://urn.fi/URN:ISBN:978-952-03-1196-4 PunaMusta Oy – Yliopistopaino Tampere 2019
PREFACE
I freshly remember the day I first arrived in Finland. Little I knew about this beautiful country. I’ve been told the language is impossible and unreadable, the climate severe, and people difficult to hang out with. Not at all, but I still had to find it out. On my first ride from Helsinki to Tampere, I clearly remember exclaiming: "Let’s see where this journey will take me", loosely translated. Well, the journey took me all around the globe, and finally here again, writing this Preface and thinking of all the wondrous things happened in the last three years and all the amazing people I met. Going through all the great memories would certainly take something like a hundred pages. Here I want to thank the closest and most important ones who shared this journey with me. If unintentionally I forget someone, please forgive me: I aged a lot by completing this dissertation. For all the others I cannot mention, remember that good memories and great time simply do not vanish and easily come back to mind: believe me, while writing these lines I had a thought for all of you.
I can do no other than thanking Prof. Juho Kanniainen’s endeavor in providing the best guidance and supervision one could ever ask for. Words are not enough for sharing my gratitude for all you have done in the past years. Thank you for believing in the first instance in my application, for patiently guiding me towards autonomy in research and writing, for setting deadlines and requiring precision too. Thanks for generously sharing your expertise and ideas and for building every day a fresh, relaxed and informal work environment. Waking up and going to the office has been a pleasure every day. Thank you for being there for whatever issue, for the ubiquitous trust, for the frank and honest yet very caring and respectful, positive and to-do attitude you taught me.
I am particularly thankful to Professor Michael McAleer for serving as an opponent. Thank you for your time and commitment in accepting this role, for going through the
dissertation and traveling up to Finland, despite your undoubtedly busy agenda. I am grateful for the valuable comments from the external examiners Ass. Prof Matthew Dixon and Assoc. Prof. Marcelo C. Medeiros: your thought and insights have been truly appreciated and definitely boosted the quality of the present manuscript, and of the unpublished article as well. In this regard, I would like to thank Ass. Prof. Alexandros Iosifidis for proofreading some technical parts of this dissertation. Furthermore, I thank Prof. Kim Christensen for having supervised and hosted me during the visiting period at Aarhus University.
I wish to thank all my colleagues from the DARE Business Data Research Group, former Financial Engineering Research Group. In particular, the office members of the former FB-108 - Festia Building, room 108 - aka. “beavers”. Thank you "mama" Milla -yes, this is published- for all your infinite patience and guidance towards all the aspects of Finnish life. Without your generous support I would still be figuring out how to book a dentist appointment, driving with foreign plates, and wondering how to check my study record in POP. Thank you Sindhuja for sharing with me all the complaints about the food at the canteen, for your remarkable, but pointless, dedication in teaching me how to run scripts at CSC and, of course, for the amusement we had in India. I am sorry for all my generic excuses for not to swim on a daily basis in cold Finnish lakes, Jimmy. But I will always carry with me all the indecipherable talks we had in the last years and your complaints on how I drink coffee. Thank you Ye for our inspiring “econometrics and traveling talks” and for the several outdoor activities and dinners we had. The research group unofficially extends to Eija: thank you for all the good talks and your guidance. Literally. E.g. when -with some considerable delay- explaining that I missed the turn to Lapland and was driving to Sweden. My most special thanks go to Margarita and Kestutis for all the great office, home, barbecue and hard-to-remember Labor/Herwood/Terrible/Ylä/Taj Hotel & many more, activities and bar-times we shared. The countless number of great moments and memories I had with you in the last years made the most of my stay in Finland. Looking forward for more, and visiting you in Riga soon.
Thanks to all the other academia-related wonderful people I met too. Ji for your reliable help in all the DFA-related issues, your uncommon hospitality and friend-liness: I am glad of having met you and Mikko. Thank you Adam for the mutual support for our very first publication and for our many hopeless attempts in running “Hello world” on SPARK. Thanks to Jaakko and Perttu for my very early times at
TUT, for supporting me in moving my first steps towards the earliest data-analyses and publications. Lastly, thanks to the BigData Finance fellows visiting Tampere: Rytis, Sergio and Chiara, for the unforgettable hanging out, which, however, I largely forgot.
And a paragraph is deserved for all the amazing, bright and truly friendly people I lived with in Aarhus. Fede, Cami, and Foteini for the countless number of great days and nights, your everyday smiles, laughs, and support that made the months in Denmark unique. To Luca for our truly work-inspiring talks on daytime and work-complicating practices at nights. My period at BSS would not have been the same without you all. Lastly, to Sanchali, Oscar, Yussef, Marta, Patrizio, Giorgio, Ye, Sigurd and Simon: it’s my pleasure to have known you all.
To all the great friends outside the academia, playing baseball together. The informal-but-competitive spirit is our force: "a team having fun, is a winning team". So true, especially thanks to Gabo, Luis, Niko, Tuomo, Tuomas and Mauricio for making each training, game and post-game moment enjoyable, relaxing and, most importantly, full of fun, if not crazy. Finally, a warm hug to all my friends in Italy and around the world, turning all the short moments together into such friendly, sincere and delightful times: Bartolich, Goretex, Marsa, Giulia Reds, Vale, Uba, Jakob, Umbi, Stefania and Lindy.
Finally, to my dear family - Naima, Roberto and Nadja and all the other relatives. I would not be here without you. Thank you for pushing me towards a Ph.D. when most of my applications were rejected, for your support in low and stressful moments, your attention on my overall well-being. For Monday’s talks and counseling, and the solid shelter you provide whenever something does not go the right way.
Principio caeli clarum purumque colorem quaeque in se cohibet, palantia sidera passim,
lunamque et solis praeclara luce nitorem; omnia quae nunc si primum mortalibus essent
ex improviso si sint obiecta repente, quid magis his rebus poterat mirabile dici, aut minus ante quod auderent fore credere gentes?
Nil, ut opinor; ita haec species miranda fuisset. Quam tibi iam nemo fessus satiate videndi,
suspicere in caeli dignatur lucida templa. Desine qua propter novitate exterritus ipsa expuere ex animo rationem, sed magis acri iudicio perpende, et si tibi vera videntur, dede manus, aut, si falsum est, accingere contra. Quaerit enim rationem animus, cum summa loci sit
infinita foris haec extra moenia mundi, quid sit ibi porro, quo prospicere usque velit mens
atque animi iactus liber quo pervolet ipse.12
1Lucretius (c. 99 BC — c. 55 BC),De rerum natura, Book II, lines 1030-1047.
2Look up at the bright and unsullied hue of heaven and the stars which it holds within it, wandering
all about, and the moon and the sun’s light of dazzling brilliancy: if all these things were now for the first time, if I say they were now suddenly presented to mortals beyond all expectation, what could have been named that would be more marvelous than these things, or that nations beforehand would less venture to believe could be? Nothing, methinks: so wondrous strange had been this sight. Yet how little, you know, wearied as all are to satiety with seeing, any one now cares to look up into heaven’s glittering quarters! Cease therefore to be dismayed by the mere novelty and so to reject reason from your mind with loathing: weigh the questions rather with keen judgment and if they seem to you to be true, surrender, or if they are a falsehood, gird yourself to the encounter. For since the sum of space is unlimited outside beyond these walls of the world, the mind seeks to apprehend what there is yonder there, to which the spirit ever yearns to look forward, and to which the mind’s emission reaches in free and unembarrassed flight. Translation: Munro, Hugh Andrew Johnstone.T. Lucreti Cari De rerum natura libri sex: 2. Vol. 2. Deighton Bell and Company, 1866.
ABSTRACT
The vast amount of information characterizing nowadays’s high-frequency financial datasets poses both opportunities and challenges. Among the opportunities, exist-ing methods can be employed to provide new insights and better understandexist-ing of market’s complexity under different perspectives, while new methods, capable of fully-exploit all the information embedded in high-frequency datasets and addressing new issues, can be devised. Challenges are driven by data complexity: limit-order book datasets constitute of hundreds of thousands of events, interacting with each other, and affecting the event-flow dynamics.
This dissertation aims at improving our understanding over the effective applicability of machine learning methods for mid-price movement prediction, over the nature of long-range autocorrelations in financial time-series, and over the econometric modeling and forecasting of volatility dynamics in high-frequency settings. Our results show that simple machine learning methods can be successfully employed for mid-price forecasting, moreover adopting methods that rely on the natural tensor-representation of financial time series, inter-temporal connections captured by this convenient representation are shown to be of relevance for the prediction of future mid-price movements. Furthermore, by using ultra-high-frequency order book data over a considerably long period, a quantitative characterization of the long-range autocorrelation is achieved by extracting the so-called scaling exponent. By jointly considering duration series of both inter- and cross- events, for different stocks, and separately for the bid and ask side, long-range autocorrelations are found to be ubiquitous and qualitatively homogeneous. With respect to the scaling exponent, evidence of three cross-overs is found, and complex heterogeneous associations with a number of relevant economic variables discussed. Lastly, the use of copulas as the main ingredient for modeling and forecasting realized measures of volatility is explored. The modeling background resembles but generalizes, the well-known
Heterogeneous Autoregressive (HAR) model. In-sample and out-of-sample analyses, based on several performance measures, statistical tests, and robustness checks, show forecasting improvements of copula-based modeling over the HAR benchmark.
CONTENTS
1 Introduction . . . 21
1.1 General background . . . 21
1.2 Motivation and research questions for Publications I-IV . . . 23
1.3 Linkages between the publications . . . 30
1.4 Dissertation structure and outline of the original publications . . . 32
2 Key-concepts and related research . . . 33
2.1 Limit order book . . . 33
2.2 High-frequency financial data and econometrics . . . 34
2.3 Machine learning for price prediction with limit-order book data . . 40
2.3.1 Machine learning for mid-price prediction . . . 40
2.3.2 The role of deep-in-the-book data and market microstructure in mid-price predictability . . . 42
2.3.3 Mid-price prediction in high-frequency setting: an opportu-nity for latency-based arbitrages . . . 45
2.4 Long-range autocorrelation and fractality . . . 47
2.4.1 Long-range autocorrelation and scaling exponent . . . 47
2.4.2 Applications in finance . . . 49
2.4.3 Applications in duration analysis . . . 51
2.5 Volatility estimation and modelling in high-frequency settings . . . . 51
2.5.1 Volatility estimation . . . 51
2.5.2 Volatility modelling . . . 55
3 Data . . . 61
3.1 Order book data . . . 61
3.2 TAQ Data . . . 66
4 Methods . . . 69
4.1 Machine learning methods . . . 69
4.1.1 Ridge regression . . . 69
4.1.2 Single layer forward feed network . . . 72
4.1.3 Linear discriminant analysis . . . 77
4.2 Detrended fluctuation analysis . . . 80
4.2.1 The DFA algorithm . . . 80
4.2.2 Stationarity issues in DFA . . . 82
4.3 Methods in volatility modeling and forecasting . . . 84
4.3.1 HAR model . . . 84
4.3.2 Vine copulas . . . 87
4.3.2.1 Estimation . . . 93
4.3.2.2 Vine copulas in practice . . . 95
5 Results . . . 97
5.1 Forecasting mid-price movements with machine learning techniques 97 5.2 Long-range correlations in limit order book markets . . . 99
5.3 Volatility forecasting using copulas . . . 101
6 Conclusions . . . 105
6.1 Contributions . . . 105
6.2 Reliability and validity of the research . . . 108
6.3 Limitations and suggestions for future research . . . 110
6.3.1 Publication I and Publication II . . . 110
6.3.2 Publication III . . . 115
6.3.3 Publication IV . . . 120
Publication I . . . 151
Publication II . . . 169
Publication III . . . 179
ABBREVIATIONS
ADF Augmented Dickey-Fuller
CDF Cumulative Distribution Function
CV-HAR C-Vine HAR
DFA Detrended Fluctuation Analysis
ECDF Empirical Cumulative Distribution Function
HAR Heterogeneous Autoregressive
IV Integrated Variance
KPSS Kwiatkowski–Phillips–Schmidt–Shin
LDA Linear Discriminant Analysis
LOB Limit Order Book
MDA Multilinear Discriminant Analysis
ML Machine learning
MMS Market Microstructure
MP Moore-Penrose
OLS Ordinary Least Squares
PP Phillips–Perron
RV Realized Variance
SLFN Single Layer Forward-feed Network
TAQ Trades And Quotes
ORIGINAL PUBLICATIONS
Publication I Ntakaris, A., Magris, M., Kanniainen, J., Gabbouj, M. and
Iosi-fidis, A. (2018). Benchmark dataset for mid-price forecasting of
limit order book data with machine learning methods.Journal of
Forecasting37.8, 852–866. DOI:10.1002/for.2543.
Publication II Tran, D. T., Magris, M., Kanniainen, J., Gabbouj, M. and Iosifidis,
A. (2017). Tensor representation in high-frequency financial data
for price change prediction.2017 IEEE Symposium Series on
Com-putational Intelligence (SSCI). IEEE. DOI:10.1109/SSCI.2017. 8280812.
Publication III Magris, M., Kim, J., Räsänen, E. and Kanniainen, J. (2017).
Long-range auto-correlations in limit order book markets:
Inter-and cross-event analysis. 2017 IEEE Symposium Series on
Computational Intelligence (SSCI). IEEE. DOI:10.1109/SSCI. 2017.8280932.
Publication IV Magris, M. (2019). A C-Vine extension for the HAR model.
Un-published manuscript. Submitted toJournal of Business & Economic Statistics, May 2019.
Author’s contribution
This section describes in detail my personal contribution to each of the above-mentioned publications.
In Publication I, in collaboration with the co-authors, I took part in the discussion about the research objective. Contributing to specifying and defining the current one, based on constraints and feasibility issues implied from the data structure and content. Furthermore, I had the whole responsibility for the data-related part. In particular, I took care of the whole data processing, management, and validation, delivering a well-structured dataset that fits the requirements for the analyses. A major contribution is indeed that of data construction and processing, along with an active role in designing the whole setup for the further methodological applications. Accordingly, I wrote the corresponding data section in Publication I. Finally, I provided comments and suggestions to the main author for the final draft.
Publication II uses the same data as Publication I. Without the careful data-processing already set up for Publication I and made available at the time Publication II was under development, the analyses would not have been possible. As for Publication I, the whole responsibility on the data is solely mine. I took part in reviewing the final draft by suggesting the main author and co-authors improvements in the text, concerning the introduction, description of limit-order books and the methodological part too. I presented the publication at the IEEE SSCI 2017 Conference.
Publication III is a collaboration with researchers at the Department of Physics, who have strong expertise in the methodology used. Although the methods were jointly determined, I defined the exact research objectives by in identifying the actual variables of interest over which the analyses are implemented. Preliminarily, I implemented and tested the method on a limited dataset uncovering those research directions that look promising and worth to investigate. I processed the whole data accordingly and delivered it in a conveniently structured shape for the overall analyses. I took the main responsibility in writing the publication and first drafting for all the sections, including the literature review and methods parts. Later revisions and improvements involved the co-authors as well. Lastly, I presented the publication at the IEEE SSCI 2017 Conference.
Publication IV is entirely an outcome of my own work and ideas. I have full respon-sibility for the whole project. I defined the main objective, planned the research design to answer the research question and decided over the methodology to tackle it. I processed the data, run the analyses and drawn the conclusion on the results. A first draft of the manuscript and the results therein were presented at the CFE 2018
conference.
Acknowledgments
The research leading to this dissertation received funding from the European Union’s Horizon 2020 research and innovation program under Marie Skłodowska-Curie grant
agreement No. 675044, “BigDataFinance”3.
1
INTRODUCTION
This chapter introduces the reader to the topics explored in the publications and their respective research questions. Section 1.1 provides a very general understanding of complexities and opportunities related to nowadays’ availability of big datasets. Section 1.2 deepens the discussion addressing the motivation for Publications I-IV and formulates precise research questions. Section 1.3 addresses how the publications are related to each other and what is the web holding them together, as a part of more general research of wider width. Finally, a description of the structure of this dissertation is provided in Section 1.4.
1.1 General background
In the last decade, the world entered the “Big-data era”. Every day and at an incredible pace, a huge amount of digital data is created and recorded. As of 2012, about 2.5 exabytes (2.5·109Gb) of data were created each day (McAfee et al., 2012). The financial sector is part of this trend (Cont, 2011, among the others). By the introduction of more and more sophisticated technologies, trading platforms and algorithms, high-frequency trading exploded. As a consequence, all the high-frequency trading activity taking place on different exchanges all around the world generates a massive amount of digital data. Budish et al., 2015 provides an outlook on the high-frequency trading phenomenon through time and on its quantitative and qualitative impact on
the markets,while (Beltran et al., 2005) provides further empirical analyses in the
context of cross-market activity. Numbers are impressive, posing both challenges and opportunities.
Opportunities are directly linked to the exceptionally rich information that high-frequency data endows. This can clearly have an impact on different levels, for
instance can uncover new features in how the trading occurs and takes place (Cont, Kukanov et al., 2014; Budish et al., 2015; O’Hara, 2015), can provide behavioural insights on market’s participants (see e.g. Pang et al., 2002), can be used to identify early signals e.g. of a forthcoming jump in the prices (e.g. B. Zheng et al., 2012), or used for metrics forecasting (e.g. Kercheval et al., 2015). In other words, the high-frequency data era constitutes a great opportunity for the development of new models and methods capable of providing a more precise understanding on diverse aspects of financial markets, as well as boosting the forecasting ability of concurrent and existing models buy the use of the vast and rich information being nowadays recently available.
In this large and multidimensional information and data the human eye is clearly lost (the order book data sample in Figure 2.2 is a clear example): high-frequency data is too vast to have an overall outlook and understanding of all the possibly very-complex relationships between all variables. Highly-efficient computer-based methods, processing platforms with a high amount of automatization, requiring little human interaction and high flexibility are important requisites for tomorrow’s algorithms.In this regard (Flood, 2012, Sec. 1.2 to 1.4) provides a historical overview on the connection between information technology advances and financial markets’ complexity, and their evolving needs. Indeed the classical econometric approach, attempting to precisely identify sets of hypotheses about e.g. variables, their relation-ships, and possible error terms, is strained. In this context, there is no surprise in the recent attention and popularity that Machine learning (ML) applications gained in finance (indeed, a number of monographs have been written so far on the topic). ML methods are capable of executing complex analyses with little or no human interactions (so-called unsupervised learning), capable of auto-detecting feature and variables of interest to achieve a given (prediction) task, tune their parameters and improve their own efficiency (Michie et al., 1994). As a part of this, also the analysis of the unique properties that characterize high-frequency time-series constitute an opportunity, not only in statistics and econometrics (e.g. Bouchaud, Farmer et al., 2009; Abergel, Anane et al., 2016, as examples of statistical analyses on high-frequency data and their econometric implications and modelling), but also for the possibility of cross-disciplinary applications, e.g. the use of methods historically pertaining to natural sciences and engineering in finance (e.g. Peng, S. V. Buldyrev, Havlin et al., 1994; Ogata, 1998).
With opportunities come challenges. In the first instance, these are related to the enormous amount of data that needs to be handled. Beside hardware issues and software architecture, there is a need for algorithms that are fast and efficient but at the same time accurate and reliable. Second, the data can be very heterogeneous and different. This is a clear problem for science since results would strongly rely on the specific dataset, on the cleaning procedure, and experimental protocol adopted. Third, high-frequency time-series have unique features that require specific and new methodologies to be properly handled (the problem of unbiased volatility estimation
under microstructure noise is an example). A more detailed overview over the
complexity of nowadays’s big data streams and challenges they pose can be found in (Flood et al., 2016). Although the focus in (Flood et al., 2016) is on data-related issues concerning market stability monitoring, most of the discussion broadly generalizes, being easily contextualized and valid over different domains, e.g. limit-order books. This is the setting where my research moves: high-frequency data, ML methods for specific prediction tasks, time-series properties of the high-frequency data and high-frequency econometric modeling. This dissertation analyzes different topics in high-frequency financial data domain, under different angles. (i)prediction, in particular of the mid-price direction different machine-learning approached. (ii)
Descriptive analyses, in particular on the nature of the long-range autocorrelation of financial duration series extracted from the order book. (iii)Volatility modeling
and forecasting in an econometric context, based on methods and models of form
high-frequency econometrics literature. The common thread to these points is the use of high-frequency data, and disconnections among them, especially with respect to the last points, have to bee seen under the general aim of addressing different topics, namely, prediction, description and modeling. This justifies the title of his dissertation too, recalling volatility modeling, limit-order book analytics (in general, the discovery, interpretation and use of meaningful patterns extracted from the data), and high-frequency data.
1.2 Motivation and research questions for Publications I-IV
Whereas the discussion in Section 1.1 was intentionally general, now I provide a deeper motivation for each of the publications presented in this dissertation outlining
literature gaps, and opportunities for further research. Accordingly, I formulate the relevant research questions Publications I-IV deals with.
Motivation and research objective for Publication I. In the last decades, a number of different ML methods have been applied for tackling prediction problems with high-frequency limit-order book data. In this regard, the outstanding literature is vast and heterogeneous. Overall, there is great variability in the ML methods applied, in the data itself (in quantitative terms such as e.g. data not limited to the best levels only, and qualitative terms, such as stocks involved and periods analyzed), in data processing, in reporting and validation of the results. This implies a general complexity in comparing results and generalizing the findings reported in the literature. Indeed differences in trading platforms, matching rules, transaction costs, possible exchange-specific features, and data aggregation from fragmented markets, pose a general comparability challenge for limit-order-book related research, even for a very same asset (Cont, 2011). Consequently, ML forecasting analyses under different data, methods, and protocols are a real challenge for results’ standardization and generalization. With the purpose of motivating the above discussion about heterogeneity in the data and methods, consider the following example. (Kercheval et al., 2015) addresses the problem of mid-price prediction and spread crossing with support vector machine (SVM) methods, over one-trading-day, 10-levels deep, high-frequency limit-order book data for 5 stocks traded at NASDAQ, performance is evaluated in terms of F1 scores; (J. Liu et al., 2015) uses 42 US securities for a 1-month period, but using only top-level data to estimate a linear model for price prediction over intervals between
30 seconds and one hour. The performance of their model is evaluated in terms ofR2
(indeed the analysis is not framed into a classification problem, as the earlier case). (Pai et al., 2005) uses 50-days data from the year 2002 for 10 stocks to tackle the mid-price prediction with ARIMA-SVM methods, but with a completely different protocol, based on daily-returns, and one-day-ahead forecasts, whose performance is evaluated in terms of mean squared error. This example shows that whether it is quite safe to conclude that indeed we can approach some prediction problem on some data with certain ML methods under specific learning and forecasting schemes, drawing general conclusions, abstracting the results to a general level and e.g. concluding that given ML methods perform better than others is definitely challenging. Furthermore, many different prediction tasks can be considered, e.g. (B. Zheng et al., 2012) uses a Lasso regressor for the CAC40 constituents over a one-month LOB data sample
from the year 2011, for predicting price jumps.
As pointed out so far, the heterogeneity in the available datasets (e.g. period covered, type of events recorded, data-frequency, and order book depth), rather than a research
question, stems as a research issuespecific for the ML literature using LOB data
published so far. Among the prediction tasks, a literature gap involving applications of standard ML methods on high-frequency limit-order book data emerges for the prediction of future mid-price movements. Because of this lack, a benchmark of simple ML implementations for a given prediction task (under a uniform) forecasting framework is missing. Implicitly, a clear understanding of which are the standard methods providing a promising direction for their future improving is missing. As a part of it, it is hard to asses the actual need for complex methods, such as that of (Pai et al., 2005), and their improvements in forecasting over much simpler alternatives. Moreover, the central impact played by different data-standardization schemes on the implementation of the methods, and in driving the forecasting results, has not been addressed. Also, from the current literature, a research gap emerges in the discussion about mid-price movement predictability at different horizons, which is a relevant analysis for understanding to which extent the past LOB flow can be exploited for prediction, and whether the short-term behavior of the mid-price is, on the contrary, largely noisy.
In this context, a publicly-available high-frequency limit-order book dataset that the research community can utilize as a homogeneous basis for future applications is also missing. A preprocessed, well-documented and well-structured dataset over which old and new prediction methods can be implemented, would definitely improve results’ comparability and lead to a better understanding of what are the implications of different methodological approaches. In Publication I we provide an example of such heterogeneity in the datasets, motivated also by the fact that the public availability of the rich datasets, is generally constrained by disclosure agreements, and high costs. With this, a set of reference measures related to the forecasting performance of a set of ML methods on a selected prediction task, with uniform experimental setting and data, is also nowadays not available. The research gaps outlined in the above discussion lead to the following research objective (RO), rather than a research question (RQ): RO 1:Exploring the problem of predicting mid-price movements in the limit-order book with standard machine-learning techniques, under different data-normalization
approaches and for different forecasting horizons. As a part of it, provide a publicly available ultra-high frequency limit-order book dataset for general ML forecasting-related research; comprehensive of a detailed and robust experimental protocol, and inclusive of baseline performance measures for this specific prediction task.
Motivation and research objective for Publication II.Popular ML methods used in financial applications include linear regression (B. Zheng et al., 2012; Panayi et al., 2018), network-based models (Tsantekidis et al., 2017a; Tsantekidis et al., 2017b; Passalis, Tsantekidis et al., 2017), deep learning (e.g. Sirignano, 2019) and many others. Several existing applications utilize models that lean from the data based on vector inputs of features (e.g. Kercheval et al., 2015; Passalis, Tsantekidis et al., 2017, among several others). Vectorization is unable to capture the spatial-temporal information, interactions and inter-links between the input vectors (Tan et al., 2019), thus ML methods based on a tensor-based representation of financial times series constitute an appealing approach, that remains not addresses. In particular, multilinear techniques in ML are not at their early applications and have been widely applied to image and videos classification problems (e.g. He, Cai et al., 2006; Vasilescu et al., 2003). How-ever, their use in high-frequency financial settings is very limited, and not specifically related to the prediction of future mid-price movements (Q. Li, Y. Chen et al., 2016, e.g.).
Besides the growing number of applications involving methods relying on the tensor-representation of a time-series in different fields, a study exploiting this tensor-representation for the order book dynamics forecasting (and specifically for the prediction of mid-price movements) is missing. Furthermore, as outlined in Section 1.1 ML models are
likely to be very complex and of difficult interpretation1. Natural multidimensional
(or tensor) generalizations of standard ML models are attractive, but unexplored, alternatives. However in the related ML literature dealing with LOB applications such a discussion is not addressed yet. In this regard, Publication II deals with the following research question:
RQ 1:To which extent can machine-learning techniques based on time-series’ tensor-1For instance in terms of the objective function to be minimized and its interpretability. E.g.
neural-network -based methods are not of easy estimation, the estimation itself is time-consuming, and the interpretability of the parameters in the (possibly multiple) layers, as well as their impact on the objective function, is not immediate and straightforward.
representation be effectively employed in the prediction of the mid-price movement, boosting forecasts’ performance measures over alternative models?
Motivation and research objectives for Publication III. A number of well-established techniques generally used in natural sciences applications have been designed to detect, characterize and quantify the so-called scaling laws and long-range correlation proper-ties of time-series (see e.g. Kantelhardt, 2009). Starting from (Mandelbrot, 1971) this research direction gradually became attractive in finance too, and have been utilized in analyzing e.g. the scaling properties in returns’ series (e.g. Mantegna et al., 1995), in currency rates series (e.g. Vandewalle and Ausloos, 1997), and to discuss market efficiency (e.g. Y. Wang et al., 2009). Indeed, the presence of long-range correlation in financial series is not a new concept in econometrics (see e.g. Baillie, 1996, for a review), but its precise characterization is challenging: in this concern, methods from other fields proved to be very valuable and of simple applicability. Indeed the precise understanding of long-memory properties in financial time-series plays a key role in the development of different econometric models, e.g. ARFIMA models, or IGARCH effects are attempts to deal with long-range dependence (Andersen, Bollerslev, Diebold and Labys, 2003), and market hypotheses formulation (e.g. U. A. Müller, Dacorogna, Davé, Pictet et al., 1993). Therefore, analyses on the fractal nature of duration-related time-series in financial data and in the LOB are of high relevance.
The reference methodology in this field is provided by the so-called Detrended Fluctu-ation Analysis (DFA) (Peng, S. V. Buldyrev, Havlin et al., 1994), aimed at uncovering the presence of long-range autocorrelation features in time-series, and providing a quantitative characterization through the so-called scaling exponent. Although a number of applications involving ultra-high frequency limit-order book data (Ivanov, Yuen, Podobnik et al., 2004; Jiang et al., 2008; G. Cao, Xu et al., 2012; Ivanov, Yuen and Perakakis, 2014), researches exploiting the extensive and rich information that this data contains on different order book events, such as limit orders, market orders,
and cancellations, in analyzing long-range properties in duration time-series, are
missing. In particular, no joint analyses on the three different message types (events) that affect the order book state have been proposed, nor differences between the side of the book discussed. Also, analyses for cross-series’ durations, e.g. between orders’ submissions to their respective cancellations, are lacking in the literature.
Furthermore, earlier researches relied on high-frequency datasets that did not span long time periods. Accordingly, earlier studies detected differences in the scaling exponent when switching from intra-day to daily sampling frequencies, but were data-constrained and thus unable to detect differences wider time-scales. This is a sen-sible gap, considering the theoretical augmentations of (e.g. U. A. Müller, Dacorogna, Davé, Pictet et al., 1993), and several applications (e.g. Corsi, 2009) relying on the assumption of heterogeneous traders competing at different time-scales; namely daily,
weekly and monthly horizons.Relying on a broad literature well-documenting on
an empirical basis long-range autocorrelations in different financial series, imputable to different factors, including microstructure-related augmentations such as price im-pact(e.g. Lillo et al., 2004) and the closely related literature reporting strong evidence of long-range correlation in duration time-series extracted from the LOB, we expect our descriptive analysis to detect long-range autocorrelations as well, and successfully address the above-mentioned issues. Based on the literature here introduced, but expanded in 2.4, and on the above-mentioned research gaps,we outline the following research question:
RQ 2: What can be said about the long-range autocorrelation in the inter- and cross- event series of orders, trades, and cancellations in limit-order book data across different stocks, market sides, and sampling frequencies?
Moreover, outlining a set of economic variables that are associated, on a daily, level with the scaling exponent for LOB-extracted duration series, could provide valuable insights for the development of models for the long-range autocorrelation dynamics, and a starting set of variables for future causal analyses. Although some very limited analyses in this direction have been proposed in (Ivanov, Yuen and Perakakis, 2014)2, this point is largely un-addressed in the current literature. This devises a further research question:
RQ 3:How strong, and consistent across different stocks and side of the book, are the associations between the scaling exponent, characterizing the nature of the long-range autocorrelation in durations’ time-series, and general economic variables?
Motivation and research objectives for Publication IV. Volatility modeling and forecast-2And in (Vandewalle and Ausloos, 1997), but for currency exchange rates and macro-economic
ing have been one of the most active areas of econometrics research since the seminal paper of (Engle, 1982) and the advent of GARCH-related literature, from (Bollerslev, 1986) onward. The advent of high-frequency data, however, poses new problems to contemporary econometrics. In particular, the effects of market microstructure noise, negligible at low sampling frequencies are a major issue, whose effects lead to bias and inconsistency of common volatility estimators. A number of new techniques for the noise-robust estimation of daily volatility from high-frequency data have then been developed (e.g. L. Zhang et al., 2005; Barndorff-Nielsen, P. R. Hansen et al., 2008; Podolskij et al., 2009). As a part of the very same tale, the introduction of the so-called realized measures (daily-volatility measures relying on high-frequency data) contributed to the development of new techniques for volatility modeling and forecasting. Among them, the Heterogeneous Autoregressive (HAR) model (Corsi, 2009) gained vast popularity in the last years because of its simple structure and effectiveness in predicting (generally) tomorrow’s volatility. A motivation for the work of (Corsi, 2009) is to account for the long-range dependence observed in the (realized) volatility time-series (e.g. Andersen, Bollerslev, Diebold and Labys, 2003).
Although this phenomenon has been pointed out already in the literature, asimple
econometric model to account for it was still to be explored. Models such as those of the FIGARCH-class (Baillie et al., 1996) or ARFIMA-class of realized volatility (Andersen, Bollerslev, Diebold and Labys, 2003) are of complex theoretical construc-tion, which affects their attractiveness. The HAR model stands out as a simple linear model, able to capture the long-range dependence in the volatility series, and of easy estimation. Thus, it gained popularity among practitioners as well. However, its construction relies on a set of crucial hypotheses that although supporting the HAR model itself, are generally restrictive. Among these, the linear assumption between the components involved in the HAR mode is particularly critical (and already recognized as such and discussed in the literature, e.g. Hillebrand et al., 2007). As suggested in (Sokolinskiy et al., 2011) copulas can naturally provide a remedy for a number of methodological and theoretical constraint related to the limitations of the standard HAR model. Historically, the use of copulas has been very extensive in several areas of finance, risk management, and econometrics (see Section 2.6). On the other hand, in the contemporary literature on high-frequency realized-measures modeling and forecasting, the set of copula-based methods is very short. Interest-ingly, whereas there has been an explosion in the econometric literature about the
robust high-frequency estimation of daily volatility and forecasting in a HAR-based perspective (e.g. Andersen, Bollerslev and Diebold, 2007; A. J. Patton and Sheppard, 2015; Bollerslev et al., 2016), and important advances in (Vine-) copulas literature, cross-applications between these two areas are absent.
By pursuing the research direction of (Sokolinskiy et al., 2011) but setting apart from it methodologically, accommodating a Vine-copula (Aas et al., 2009) expansion for the HAR model of (Corsi, 2009) stems as an unexplored attractive research direction for covering this cross-fields gap and deal with some shortcomings of the HAR specification. This leads to the following research question:
RQ 4: What is the impact in terms of forecasting ability of a copula-based modeling of daily volatility measures over the HAR model?
1.3 Linkages between the publications
The general factor common to all the publications included in this dissertation is the use of high-frequency data. This is the predefined setting of my doctoral studies. As a fellow of the BigDataFinance EU-project project I conducted my research within the “High-frequency econometrics” working package. Therefore of high-frequency is the data I used in all the projects I have been working on. Publications I-IV included in this dissertation are not aimed at analyzing a single aspect and discuss it at different levels, rather they aim at addressing different topics under different angles. Prediction, in Publication I and Publication II, descriptive analyses, in Publication III, and volatility modelling and forecasting in Publication III, also with a cross-disciplinary cut, while sharing the use of high-frequency data.
My research has been focusing on gaining new insights on different problems by use of the massive intra-day information characterizing high-frequency data. In particu-lar, I explored two main directions. First, my research deals with the prediction of limit-order book related events in the LOB markets by the use of machine learning (ML) methods. This is precisely the setting of Publication I and Publication II where the join use of different ML methods together with the rich information of high-frequency financial data is exploited to address the problem of mid-price prediction. This aims at shedding light over the general possibility of exploiting high-frequency
data and ML in effectively predicting future events. This setting is entirely data-driven in a way that it differs with respect to the standard methodology adopted in econo-metrics. Therefore in Publication IV I investigated the prediction problem also under a properly-called econometric approach. Motivated by the recent literature growth about volatility estimation with high-frequency data and the traversal relevance of volatility forecasting in finance, in Publication IV I suggest a possible improvement of a well-established econometric method for daily-volatility forecasting. Publication I, Publication II, Publication IV thus share the same motivation, which is that of forecasting different aspects of financial markets with high-frequency data, although the methodological approach is different. (i) Publication I and Publication II rely on
ML methods, whereas Publication IV relies on econometric methods3and attains
the econometric literature; moreover (ii) Publication I and Publication II investigate the prediction of the mid-price movement, whereas Publication IV the modeling and forecasting of daily volatility.
At this stage, it needs to be pointed out that the above-mentioned forecasting prob-lems, necessarily rely on some data, and in particular in the time-series of one or more variables of interest. The dynamics of the underlying variables are of central importance for developing descriptive and eventually forecasting models: therefore new insights on the properties of high-frequency financial time-series are of high relevance in this context. And of particular importance is having an understanding of the complexity beneath the observed (long-range) correlations and persistence in the time-series (in terms of the relationship between by the current state or variable with its lagged values). Indeed the reference model of Publication IV has been developed also with the purpose of dealing with long-memory effects observed in volatility, however, the assumption about other aspects of the volatility times series are ques-tioned, leading to a revised model. Publication III precisely focus on the specific dynamics observable in some selected high-frequency financial time-series extracted from the LOB data. Moreover, a considerable part of the research presented in this dissertation is cross-disciplinary. Indeed whereas Publication I and Publication II merges ML methods with finance, Publication III represents and application of a method developed in natural sciences.
3In a broad sense, not only in the models themselves but for instance also in the backtesting and
validation. Publication I and Publication II report measures such as accuracy and precision, typical in the ML filed, while Publication IV uses in-sample an out-of-sample analyses and tests typical to econometric literature.
1.4 Dissertation structure and outline of the original
publications
This dissertation continues with five more chapters. Copies of the manuscripts are appended at the very end. In the following Chapter 2, I introduce the reader to the main concepts addressed in the research publications here presented, and expand the literature cited so far. In particular, the discussion in Chapter 2 provides Introduction and general discussions around the concepts of (i) Limit order book markets, (ii) High-frequency financial data and econometrics, (iii) Machine learning application in finance, (iv) Detrended fluctuation analysis, (iv) Volatility modeling and forecasting, and (v) Copula applications in finance. Chapter 3 introduces the two datasets used in Publications I-IV, while Chapter 4 presents the mathematical details of the main methods used throughout Publications I-IV: (i) ML algorithms, (ii) DFA, (iii) HAR model, and (iv) Vine-copulas. Chapter 5 summarizes the findings for all the research publications and answers the research questions postulated in the Introduction. Finally, Chapter 6 concludes by addressing the contribution of the current research, its validity, its reliability, and importantly, its limitations, suggesting directions for future work.
2
KEY-CONCEPTS AND RELATED
RESEARCH
The main concepts behind Publications I-IV are here presented to the reader. Sections include the relevant literature review, defining the background for Publications I-IV. The discussion is intentionally kept non-technical, although not generic. However, general mathematical ingredients are provided as well for the purpose of a clear and exhaustive exposition, but of simple understanding. This chapter has to be intended as a complement to Publications I-IV, enriching the discussion therein addressed.
2.1 Limit order book
The vast majority of modern stock exchanges are nowadays order-based electronic markets (Bloomfield et al., 2005; C. Cao et al., 2009; Cont, 2011; Gould, Porter et al., 2013). In limit order markets all the investors can participate in the market: by submitting limit and market orders they can provide or absorb liquidity. On the other hand, in quote-driven markets, the so-called dealers (market makers and liquidity providers) are affecting the liquidity provision (L. Harris, 2003). Whether in quote-driven markets only the ask and bid are on display to market makers or other designates specialists, with clear issues of regarding market transparency, in order driven-markets all the prices at which participants are willing to trade are available, although there is no guarantee of order execution.
The key-ingredient in limit order markets are commitments of investors of buying or selling a predefined quantity of shares at a predefined price. These are respectively called buy and sell limit-orders. Until an investor cancels a submitted limit order or the limit order is completely filled (executed in this whole quantity), the order is
valid and stays in the book. Thus, we refer to limit order book as to the collection, book-keeping of all the outstanding limit orders, waiting to be executed or perhaps canceled. Execution takes place whenever an investor submits a market order. This is a command to either buy or sell a given quantity of shares at the best available price.
Importantly,somelimit order markets are characterized by a price-time priority rule:
an incoming market order is first executed against an outstanding limit order book the best (ask or bid) price1, while among a number of limit orders with the same best price, priority is given to those first placed (submitted and thus annotated earlier in the book). Market-specific rules determine, for instance, the finest grid over which prices can be placed, generally increments of 1-5 cents (P. Hansen et al., 2017), and the size of the minimum quantity chunk associated with an order. As a consequence of this mechanism, only limit orders at the current best (ask or bid) prices can be matched with a market order2, while the others stay idle. This means that although a market order gives the certainty of execution, the price at which the execution occurs is not guaranteed (market moves and best prices too); on the other hand, a limit order is not guaranteed to be executed, but if so, the price is settled. The example in Figure 2.1 illustrates the mechanism driving a limit order book3. Further information about limit order book markets can be found for instance in (Biais et al., 1995; Cont, 2011; L. Harris, 2003; Gould, Porter et al., 2013) or in (Abergel and Jedidi, 2013; Abergel, Anane et al., 2016; Cont, Stoikov et al., 2010) for a more mathematical description.
2.2 High-frequency financial data and econometrics
The floor-based quote-driven markets have been in the last 20 years replaced by order-driven platforms. Indeed, historically established exchanges such as NYSE, Tokyo Stock Exchange, London Stock Exchanges and more have gradually introduced order-driven platforms. At the same time, and directly related to the mechanism governing
1We refer to bid (ask) price as the highest (lowest) price of all the buy (sell) limit orders.
2Unless the market order quantity is such that it cannot be entirely filled by the outstanding limit
orders at the best price, and thus orders at the second, third and deeper levels are executed too.
3In the example and the publications I-III, only time-instances within the continuous-time trading
hours are considered. Indeed before the market opening time, an auction period with a structurally different mechanism, where e.g. no market orders can be submitted, determines the price discovery and thus the initial state of the book, after which regular continuous-time trading happens, with the mechanism described above.
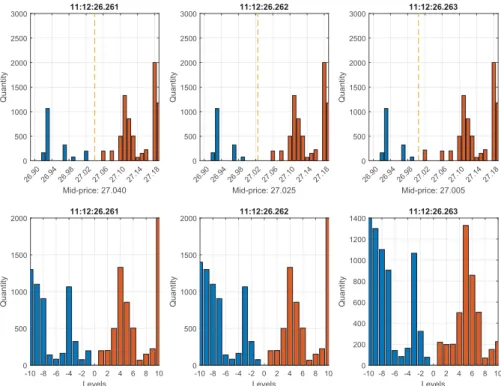
26.90 26.94 26.98 27.02 27.06 27.10 27.14 27.18 Mid-price: 27.040 0 500 1000 1500 2000 2500 3000 Quantity 11:12:26.261 26.90 26.94 26.98 27.02 27.06 27.10 27.14 27.18 Mid-price: 27.025 0 500 1000 1500 2000 2500 3000 Quantity 11:12:26.262 26.90 26.94 26.98 27.02 27.06 27.10 27.14 27.18 Mid-price: 27.005 0 500 1000 1500 2000 2500 3000 Quantity 11:12:26.263 -10 -8 -6 -4 -2 0 2 4 6 8 10 Levels 0 500 1000 1500 2000 Quantity 11:12:26.261 -10 -8 -6 -4 -2 0 2 4 6 8 10 Levels 0 500 1000 1500 2000 Quantity 11:12:26.262 -10 -8 -6 -4 -2 0 2 4 6 8 10 Levels 0 200 400 600 800 1000 1200 1400 Quantity 11:12:26.263
Figure 2.1 Order book state example. Data refers to ticker KESKOB (ISIN code FI0009000202) on June 14, 2010. The first row provides representation in terms of prices and quantities, second rows in terms of levels (limited to the first best ten). Headers are time-stamps, with millisecond accuracy, referring to the epochtof event arrival. Plots depict the state of the order book att+: the updated book state immediately after the event int. The initial state att+= 11:12:26.261 am is depicted in the first column. In the next millisecond a buy market-order is submitted to the book, the outstanding quantity at level -1 (negative signs stand for the bid side) is therefore traded and the configuration of the book changes (second column), leading to a new mid-price, a wider spread, and new bid and ask prices (respectively 26.99 and 27.06). The spread gap, however, is immediately filled by the submission of a limit-order on the first level on the ask side (third column), which updates the ask price to (27.02), affecting the mid-price.
order-driven markets the frequency of the data increased (Cont, 2011). In other words, the number of events per unit of time dramatically increased, up to thousands per seconds for today’s most liquid securities. Nowadays data generated on trading exchanges represent the largest volume outside any other source (Sewell et al., 2008). The trading frequency has increased at the point that nowadays the idea concept of frequency itself is becoming obsolete: indeed data is recorded at its maximum resolution, that is event-by-event, and even when the time scale is extremely small
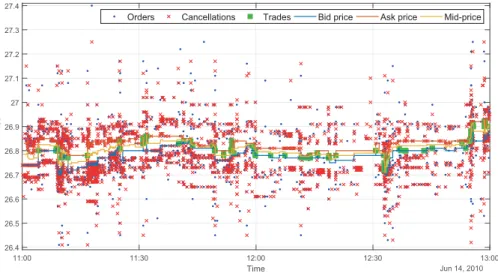
11:00 11:30 12:00 12:30 13:00 Time Jun 14, 2010 26.4 26.5 26.6 26.7 26.8 26.9 27 27.1 27.2 27.3 27.4 Price
Orders Cancellations Trades Bid price Ask price Mid-price
Figure 2.2 Order book flow example for KESKOB June 14, 2010, between 11:00 am and 1:00 pm, illustrating the complexity and multi-dimensionality of limit-order book datasets. Bid and ask levels have been extracted following the procedure explained in Chapter 3. Their average constitutes the mid-price, here included for reference. Note the massive amount of limit order submissions and cancellations, characterizing high-frequency datasets.
(milliseconds scale) and shrinking (Budish et al., 2015). By virtue of the time-priority rule, the precise order of event arrival is known and no information is missing. This is an extraordinary source of data and a complex challenge as well. All this tick-by-tick data being nowadays to researches and practitioner even on real times basis constituting what we call high-frequency data or databases. Besides the specific data-generating process, e.g. order-driven markets, futures markets or currency exchange markets, there are common statistical, econometric, data-handling and processing challenges that the next future needs to address. Statistical analyses on the high-frequency financial data can provide insights on the properties of order inflows, e.g. in microstructure characterization (e.g. P. R. Hansen and Lunde, 2006), uncover the interaction between different trading frequencies and investment horizons (e.g U. A. Müller, Dacorogna, Davé, Pictet et al., 1993; Lux et al., 1999; Alfarano et al., 2007), improve volatility estimation (e.g. Barndorff-Nielsen and Shephard, 2002) and modelling (e.g. P. R. Hansen, Z. Huang et al., 2012). There has been a “race for speed” driven by the sniping opportunities that the mechanism ruling the order-driven markets naturally embed. Despite the social utility and impact of higher speed (Budish et al., 2015), it seems that big-data trend over time-series of higher and higher frequencies with even more dense data is what we should expect from
the future. This trend can however be beneficial for price discovery and market efficiency (Brogaard et al., 2014). Therefore challenges that high-frequency data pose are extremely relevant, contemporaneous and stem for more research to be done. To further motivate the complexity of the order book data it has to be noticed that an order book high-frequency dataset is indeed made of two subsets. The trades data and the quotes data. The first keeps track of prices and quantities that were actually traded, while the second one keeps track of the outstanding limit orders, i.e. collects all the expressions of markets participants of buying or selling a given quantity at a given price. Furthermore, quote data is affected by cancellations: those can be full or partial depending on whether the quantity associated with a limit order is entirely depleted or not. Figure 2.2 aggregates this complexity: trades correspond to trades data, while all the other marks come from quotes data. Within the two datasets, there are several differences, and with respect to their corresponding time-series sampled at lower frequencies.
Among the most relevant peculiarities of the trade data, is the well-known negative autocorrelation in price changes (well explained in Roll, 1984), which is a direct consequence of price discreetness over of a grid of admissible prices on which orders can be placed. Another aspect is the well-known U-shape intra-day seasonality pattern observed in a number of time-series (e.g. Abergel, Anane et al., 2016, section 2.7 as an example), widely confirmed in the literature. As a consequence, one must either correctly address seasonality (e.g. by obtaining its profile by averaging several days and removing it) or adopt modeling solutions for which stationarity is not critical. Lastly, in recent years many papers analyzed the problem of modeling the duration between the inflow of events. Models such as the ACD (Engle and Russell, 1998) and its variants, or Hawkes-like models e.g. Ogata, 1998 gained popularity since the duration series between transactions is not uniform, nor exponentially distributed but its likely endogenous and depending on complex mechanisms both (i) market-related, to the current state, e.g. spread level and Limit Order Book (LOB) volume (Muni Toke et al., 2017) and the past states (in a sense of filtration generated by the time-series up to a certain time) and (ii) participant-related mechanisms, e.g. how participants react to other participants’ trading activity. Furthermore, duration series are not independent but show considerable autocorrelation, e.g. (P. R. Hansen and Lunde, 2006) from the econometrics literature, and (Ivanov, Yuen and Perakakis, 2014) from the econophysics side.
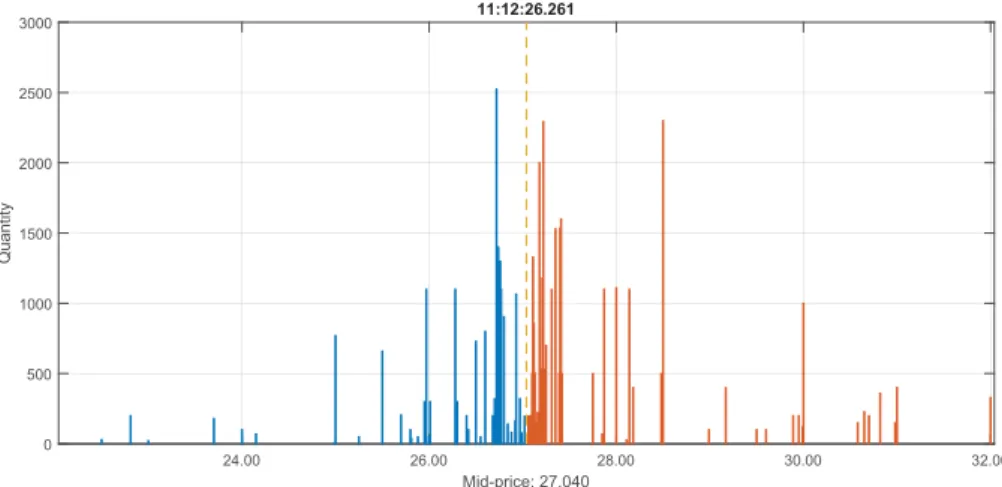
24.00 26.00 28.00 30.00 32.00 Mid-price: 27.040 0 500 1000 1500 2000 2500 3000 Quantity 11:12:26.261
Figure 2.3 An example of limit order-book state for the full-depth of a Level-II LOB dataset (KESKOB, June 14, 2010). There are 40 and 46 price levels on the bid and ask side respectively.
Quote data is of higher complexity. The simplest quote data is the so-called Level-I data consisting of five variables, namely timestamp, bid price, ask price, bid quantity ask quantity. Level-I quote data, therefore, is a complete track of the dynamics of the bid and ask levels (best levels or level I) only. Nevertheless, the information Level-I data conveys is limited and partial, indeed updates in the order book happen ad any distance from the current best quotes. A deeper limit order book data, comprehensive of the all information for the ten best levels, is referred to as Level-II data, see Figure 2.3. It is clear that either Level-I and Level-II data is of great complexity and constitutes a challenges since the data therein contained corresponds of a sorted list of limit order submission and their updates (deletion because of a matching market order or
cancellation), which does not provide anydirectinformation about the current best
levels and the deeper (non-empty) levels in the book. Information such as the bid price or quantity at the second bid level needs to be inferred and reconstructed from the raw feed. For very liquid assets this corresponds to a complex and time-consuming operation4. Clearly, levels can be sparsely filled and the reconstruction needs to be separately done for the ask and bid side. A visual representation of the full-depth LOB data in its flow domain is provided in Figure 2.2.
4To reconstruct the book one needs to separate ask and bid orders. Sort them by price and time, the
number of unique prices correspond to the number of levels of the book at a particular time, the lowest one to the bid price (for bid orders). Within the hundred or thousands of orders sharing the same price, the sum of their respective quantities gives the total quantity at a given level. This is how e.g. Figures 2.1and 2.3 are obtained
As Figure 2.2 remarks, modeling the dynamics and forecasting limit order books is, clearly a complex task. Two major approaches have been investigated: machine learning methods and econometric models (see Section 2.5). Cont, 2011 provides a comprehensive introductory overview of the major modeling approaches for the order book dynamics. This generally focuses on queue models and point-processes models (Cont, 2011, and references therein). Among the first ones, as an example of econometric modeling, (Cont, Stoikov et al., 2010) provides a mathematically tractable and analytic method for the prediction of various events (although relying on simplistic hypothesis, as Poissonian arrival rates and stationarity for the processes therein involved).
There is a further filed in which the availability of high-frequency data has been shown to be critical. This is the field of econometrics generally known as “market microstructure”. Market microstructure examines how markets work in practice and what are the mechanism driving, determining and affecting, prices, volumes, costs, and the overall aggregated trading behavior (Hasbrouck, 2007). Here we identify the econometric literature going back to the works of Roll, 1984; O’hara, 1995; R. D. Huang et al., 1997 about the price formation, price impact and spread components. Barndorff-Nielsen and Shephard, 2002 were among the first suggesting the use of high-frequency data for volatility estimation. However, with this purpose the impact of microstructure effects is of central importance and in general have disruptive effects on common volatility estimators proper of non-high-frequency literature where there is no distinction between the so-called efficient price and the observed price (Hasbrouck, 2007, among the others). Indeed the problem of robust volatility estimation under market microstructure frictions (noise) and the characterization of the microstructure effects at high frequencies is one of the most prolific fields in the contemporary econometrics. For a review on volatility estimation see for instance (McAleer et al., 2008b; Bucci et al., 2017), for a discussion on market microstructure and microstructure noise, see in this regard e.g. (P. R. Hansen and Lunde, 2006; Hasbrouck, 2007). Importantly, advances in high-frequency volatility estimation, market microstructure noise characterization, contributed also to other areas, such as that of jump detection and estimation (e.g. Barndorff-Nielsen and Shephard, 2006; Lee et al., 2007, among the major contributions).
2.3 Machine learning for price prediction with limit-order
book data
The use of Machine learning (ML) in finance is becoming more apparent every day. Among the broad field of data science, we can identify a fast-growing sub-filed that by use of statistical methods aims at the automated and powerful detection of patterns in the data, converting expertise (input data) into knowledge. The use of machine learning in finance is attractive both in replacing routine tasks so far performed by humans and in performing tasks that go beyond the human capability, such as the analysis of complex datasets and challenging prediction problems (Shalev-Shwartz et al., 2014, Chapter 1). Refer to Table 1 in (Bose et al., 2001) for a comprehensive list of applications, not only limited to the financial sector.
2.3.1 Machine learning for mid-price prediction
Concerning Publication I and Publication II, different approaches have been devel-oped with respect to the mid-price prediction task. Several applications have discussed network-based methodologies. Recurrent Neural networks have shown to be effective for predicting future price movements in (Tsantekidis et al., 2017b), while (Tran, Iosifidis et al., 2018) introduces in the network an attention mechanism that allows the layer to detect and retain only the crucial information in the temporal mode, of high efficiency and suitable for practical real-time applications. The impact of data-normalization is discussed in (Passalis, Tefas et al., 2019) where a neural layer able of adaptively normalize the input data is proposed. Automation of feature extraction is also addressed under a Convolutional Neural Network (CNN) setting in (Z. Zhang et al., 2019), interestingly pointing out the possibility of a universal set of features: indeed their model generalizes well to instruments that were not included in the training data. (Nousi et al., 2018) however argues that a combination of hand-crafted features and automatically extracted ones improves the mid-price prediction the most. (Sirignano, 2019) provides an extensive analysis of over 500 stocks supporting a new neural network methodology taking advantage of the spatial structure of the limit order book ad a model for price movements. (Tsantekidis et al., 2017a) bases the
prediction of mid-price movement on CNNs with an improved data normalization technique (updated on daily basis and differentiated between prices and volumes), showing its superiority in forecasting with respect to methods like support vector ma-chine (SVM) and Multilayer neural networks. Classification of mid-price movements has been also addressed by the use of Recurrent neural networks in (e.g. Dixon, 2018a; Dixon, 2018b) and deep neural networks (e.g. Dixon et al., 2017). In (Dixon et al., 2017) the applicability of complex and multi-layered architectures is showed to be scal-able yet feasible for high-dimensional analyses involving up to 9895 features extracted for 43 symbols and FX mid-prices (sampled every 5-min) aimed at capturing their historical co-movements observed over almost 20 years of data. Although the
net-work involves more than 1.2×10⁷weights, it’s shown to be of overnight-trainability
with proper C++implementation and a performant processor, and easily applicable
to buy-hold-sell intraday trading strategies. SVM applications include (Kercheval et al., 2015), designing input-vectors of time-sensitive and time-insensitive features to address different prediction tasks, including mid-price movements, by use of data for a single trading day for five stocks traded at NASDAQ. A hybrid classifier combining SVM and ARIMA that models nonlinearities in the class structure is provided by (Pai et al., 2005). The relationship between limit-order book variables and mid-price movements have been analyzed in (Cenesizoglu et al., 2014), different order book variables extracted from a one-year-long, 20-levels-deep high-frequency LOB show that it is possible to obtain economic gains from the relation between limit order book variables and mid-price return. Furthermore, they provide a Granger-causality between mid-price movements and lagged order book variables, supporting the use of lagged LOB dynamics for forecasting purposes. Short-term forecasting of the mid-price change is also discussed in (Palguna et al., 2016), where non-parametric predictors implementing features conditioned on the state of the order book show significant gains when incorporated into existing order execution strategies. Besides the above-mentioned methodologies, Passalis, Tsantekidis et al., 2017 develop an extension of the BoF (bag of features) model with a neural layer, which receives the features extracted from a time-series and gradually builds its representation, as a radial basis function (RBF) layer and an accumulation layer. This methodology is demon-strated to have a great positive impact on classification accuracy w.r.t. BoF for the mid-price prediction problem, also on a second data set, being highly scalable mixable with different classifiers. A different direction in improving the BoF methodology