Lin, Y. and Le Kernec, J. (2018) Performance Analysis of Classification
Algorithms for Activity Recognition using Micro-Doppler Feature. In: The
13th International Conference on Computational Intelligence and Security
(CIS 2017), Hong Kong, China, 15-18 Dec 2017, ISBN
0769563414 (doi:
10.1109/CIS.2017.00111
)
This is the author’s final accepted version.
There may be differences between this version and the published version.
You are advised to consult the publisher’s version if you wish to cite from
it.
http://eprints.gla.ac.uk/150360/
Deposited on: 23 October 2017
Enlighten – Research publications by members of the University of Glasgow
Performance Analysis of Classification Algorithms for Activity Recognition using
Micro-Doppler Feature
Yier Lin
School of Electronic Engineering
University of Electronic Science and Technology of China Chengdu, P.R.C. [email protected]
Julien Le Kernec
School of Engineering University of Glasgow, UK Glasgow, UK [email protected]Abstract—Classification of different human activities using
micro-Doppler data and features is considered in this study, focusing on the distinction between walking and running. 240 recordings from 2 different human subjects were collected in a series of simulations performed in the real motion data from the Carnegie Mellon University Motion Capture Database. The maximum the micro-Doppler frequency shift and the period duration are utilized as two classification criterions. Numerical results are compared against several classification techniques including the Linear Discriminant Analysis (LDA), Naïve Bayes (NB), K-nearest neighbors (KNN), Support Vector Machine(SVM) algorithms. The performance of different classifiers is discussed aiming at identifying the most appropriate features for the walking and running classification.
Keywords- Micro-Doppler; Classifier; Fisher Discriminant Analysis; Support Vector Machine.
I. INTRODUCTION
Micro-Doppler signatures uniquely represent the distinctive features generated from the relative motion of structural components of an object/body. A brief history of micro-Doppler and relevant source material are provided in [1-2] for convenience. Nowadays micro-Doppler signature analysis is applied to recognize a wide range of activities. The periodic motion during an activity generates unique patterns in the time-frequency domain of the radar echo, which is used for classification. However, automatic classification of activities based on micro-Doppler signatures is still challenging [3].
Traditional techniques for the automatic classification of different activities include the Least Square Estimator (LSE), Ensemble Learning Method (ELM) and Probability Classification (PC). The Fisher Discriminant Analysis (FDA) [4,5] is a kind of LSE method, which brings forth differences between samples. The most representative FDA method is Naïve Bayes (NB) [6]. Even though, NB technique can use a priori knowledge for enhanced classification, it has poor performances for low-frequency events. Since K-nearest neighbors (KNN) techniques [7] do not need to estimate parameters or being training, it is suitable for rare events and multi-model, but is computationally intensive. Furthermore, the selection of the best K value is difficult, resulting in a
large deviation of prediction when the sample dataset is unbalanced. The ELM method can improve the predictive accuracy of weak classifiers. One such method – Boosting - makes good use of weak classifier cascades for higher accuracy, but it is difficult to select the best number of weak classifiers and training is time-consuming. Furthermore, input data imbalance leads to a reduction in classification accuracy. The Logistic Regression technique [8], which belongs to PC method, is computationally efficient and simple to implement, but it is easy to produce under-fitting, resulting in low classification accuracy.
Recently, machine learning techniques (Convolutional Neural Network (CNN) [9], Support Vector Machine (SVM) [10-12]) have been applied for automatic classification. CNN are feed-forward multilayer neural networks and require little pre-processing of the input data. The advantage of the SVM approach is the reduction in dimensional complexity by using inner product function (kernel function) onto lower dimensional spaces.
This paper focuses on the automatic classification of micro-Doppler signatures from a selection of suitable features to discriminate between the considered human activities and the performance evaluation of different automatic classification techniques (e.g. Linear Discriminant Analysis (LDA), NB, KNN, SVM) are used to distinguish between running and walking.
The remainder of this paper is structured as follows. The next section describes motion capture, which was used as a base to generate micro-Doppler signatures for different human activities. Section III presents the analysis of the micro-Doppler signatures and the classification criteria. The simulation setup is described in section IV. In section V, different methods are applied to extract features from the micro-Doppler signatures, the classification performance of LDA, NB, KNN, and SVM are compared, and future work is discussed for CNN. Finally, conclusions are drawn in Section VI.
II. MOTION CAPTURE
Motion capture (Mocap) [13,14] is the process of recording the movement of objects or people. Complex movement can be recreated in a physically accurate manner, such as secondary motions, weight, and exchange of forces. In an effort to reduce cost and resource usage while
remaining accurate, Mocap data was used as input to generate the micro-Doppler signatures. The data presented in this paper is coming from the Carnegie Mellon University Motion Capture Database (CMUMCD). The Cartesian coordinate extraction from ASF/AMC files was produced via the HDM05 ASF/AMC parser [15].
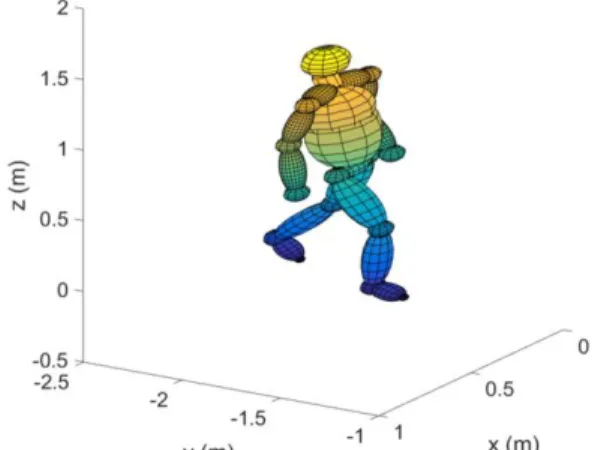
The figures 1 and 2 respectively illustrate the walking and running actions produced via Mocap data. At first glance, compared with walking, the body produces more pronounced motions of the limbs when running, which translates in larger Doppler spreads in micro-Doppler signatures. Details of the micro-Doppler signatures (a.k.a spectrograms) is discussed in the subsequent sections.
Figure 1. the walking action via Mo-cap (subject 07_01)
Figure 2. the running action via Mo-cap (subject 09_01)
III. CLASSIFICATION CRITERIA
The maximum micro-Doppler shift in the radar return is expressed in (1) assuming the narrowband approximation.
{
f
d}
max=
f
carrierv
cos
q
c
, (1) where{
f
d}
max is the maximum Doppler shift,f
carrier the carrier frequency of the radar,v
the target instantaneous velocity,c
the speed of light, andq
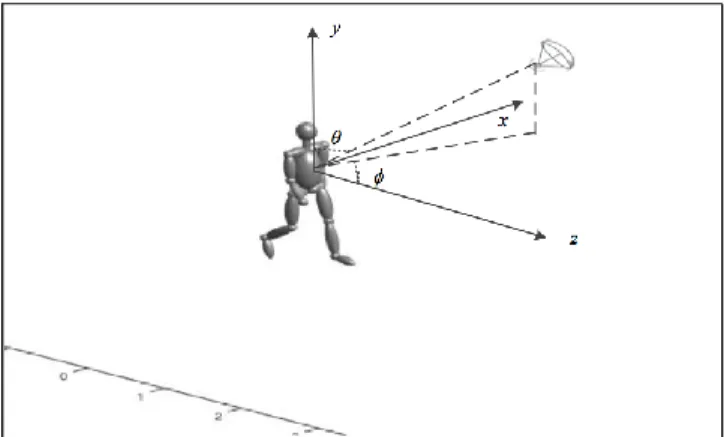
the radar incident angle as shown in Fig.3.Figure 3. Human activity direction and radar position with respect to the activity being performed
Hence, the micro-Doppler shift can be written with respect to the maximum micro-Doppler shift as shown in (2).
f
d=
{
f
d}
maxsin(2
p
f
v+
f
)
, (2)where
f
d denotes the Doppler shift,f
v the motion frequency of the body part, andf
denotes the initial phase. The contribution of the various body parts is the sum of their instantaneous Doppler frequencies as shown in (3).f
di=
f
carrierv
icos
qi
c
i=1 nå
i=1 nå
sin(2
p
f
vi+
fi
)
, (3) wheren
denotes the number of body parts in the Mocap model,v
iandq
idenote the instantaneous motion velocity and radar incident angle for thei
th part of the bodyrespectively,
f
vi andf
idenote the motion frequency and the initial phase of thei
th part of the body respectively.0 0.2 0.4 0.6 0.8 1 1.2 1.4 Time (s) -500 -400 -300 -200 -100 0 100 200 300 400 500 D o p p le r (H z ) -10 -5 0 5 10 15 20 25 30
Figure 4. Micro-Doppler spectrogram using STFT showing a full walking cycle for Subject 07 action 05
0 0.1 0.2 0.3 0.4 0.5 0.6 0.7 0.8 Time (s) -500 -400 -300 -200 -100 0 100 200 300 400 500 D o p p le r (H z ) -15 -10 -5 0 5 10 15 20 25
Figure 5. Micro-Doppler spectrogram using STFT showing a full running cycle for subject 09 action 10
Figures 4 and 5 describe a period micro-Doppler shift of walking and running obtained with short-time Fourier
transform (STFT). Figure 5 show a wider Doppler spread than in Figure 4, which is consistent with more pronounced motion of limbs when running. Appropriate features from micro-Doppler signatures paired with an efficient classification algorithm are required in order to discriminate between walking and running. It is difficult to classify the data from micro-Doppler signatures directly due to the different signal components overlapping in multiple Doppler bins. A statistical method such as the maximum micro-Doppler frequency shift in the spectrogram can be applied as a classification criterion, with respects to the parameter
f
carrierv
icos
q
ic
in (3). One classification criterion is notenough to discriminate, and therefore the gait cycle time, with respects to the parameter
f
vi in (3) is also considered.IV. SIMULATION SETUP
The main objective of this article is to investigate the performances of different automatic classifiers on discriminating between walking and running from micro-Doppler signatures. The experimental scenario and the radar position are illustrated in Fig.3, which inspired from V. Chen’s book [3]. In [3], a Boulic model is used to generate micro-Doppler signatures with a model with 17 scatterers. This model uses 31 scatterers as shown in Figure 6. Mocap data is shot at 120 frames per second. For the radar micro-Doppler signature the data was up-sampled to 1 kHz in order to have a suitable Doppler ambiguity and have enough samples (256) to integrate to obtain Doppler resolution of 3.9 Hz.
Figure 6. Mocap data with volumes snapped onto the skeleton for radar cross section simulation for the walking action.
In the first case, the person walks normally along the positive direction of the z axis; in the second case, the person runs along the same direction. The original motion data comes from CMUMCD firstly, and 40 data sets of actual activity data were recorded from two classes (subject 07 and subject 09). Then, the continuous wave radar system from six different positions ([0,5,5], [5,0,5], [5,5,0], [0,0,5], [0,5,0], [5,0,0]) was simulated to collect the radar return
respectively, which operates at 5.8GHz. The different radar locations lead to different incident angles, resulting in diverse micro-Doppler shifts and radar cross sections. A total of 240 different data sets of actual simulated data were obtained. The maximum micro-Doppler frequency shift and gait cycle time features are extracted from the micro-Doppler signatures for classification. The features are then exploited by different automatic classification algorithms namely the LDA, NB, KNN (
K
=
3
versusK
=
5
), SVM (g
=
0.3
versusg
=
0.15
) in order to evaluate their performances.V. NUMERICAL RESULTS
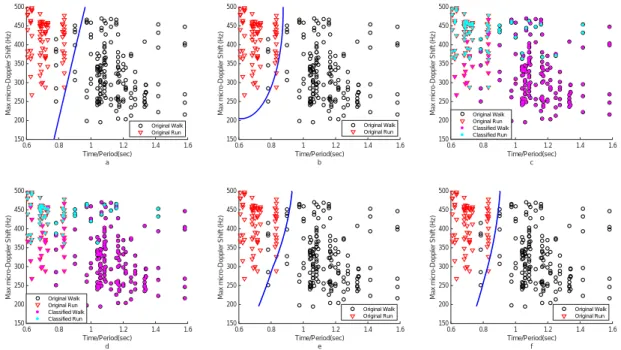
The scatter plots of the data are shown in Figure 7. The blue lines in sub-figures (a), (b), (e) and (f) are the decision boundaries produced via the different classification method. The decision boundaries in (a) and (b) both come from FDA techniques, and those in (e) and (f) come from SVM methods. The correct classification rate of LDA is 95.83% which is common for such techniques. The NB method resulted in 97.08% accuracy with 6 errors as shown in (b). In (c) and (d), the KNN classifier is tested with K = 3 and 5 leading to 34 and 41 errors respectively. The sigmoid function is utilized in the SVM technique as the kernel function. Different gamma parameters of the sigmoid function are applied gamma = 0.3 in figure (e) and 0.15 in (f). The correct classification rates are 96.25% and 97.08% respectively. The performance results are summarized in Table I. All in all, the SVM with
g
=
0.15
and NB techniques obtain the best classification rate. The poorest result comes from the NN5 method. It seems the KNN technique is the weakest with the highest error rate. It is believed that SVM would yield better results if more data was available such as 1000 or more.Classification performances will be explored in future work with different feature criteria and varying number of features to increase reliability. It will also focus on applying CNN - a popular class of deep, feed-forward artificial neural network technique for classifying visual imagery via weight and multiple hidden layers. The micro-Doppler spectrogram could be processed as an image or the input data to CNN could be altered to accept spectrogram amplitude and phase data in a future article.
TABLE I. THECLASSIFICATIONNUMERICALRESULTS
VI. CONCLUSION
In this paper, Mocap was used to emulate life-like micro-Doppler spectrograms for walking and running. The maximum micro-Doppler frequency shift and the gait cycle time were utilized as classification criteria to discriminate between those two activities. A total of 240 data sets were generated from 2 different human subjects and 6 different
radar locations in a series of simulations basec on real motion data from the CMUMCD. Different classifier algorithms have been tested to gauge accuracy in discriminating between the two considered actions (walking, running). From the numerical results, SVM (
g
=
0.15
) and NB both obtain the best accuracy with 97.08%. This paper highlighted that those two methods applied to micro-Doppler signatures can be powerful tools even with a limited number of features, which is not obvious to the naked eye.REFERENCES
[1] Chen, V. C., “Analysis of Radar Micro-Doppler Signature with Time-Frequency Transform,” Proc. of the IEEE Workshop on Statistical Signal and Array Processing (SSAP) , Pocono, PA, 2000, pp.463466. [2] Chen, V. C., et al., “Time-Frequency Transforms for Radar Imaging
and Signal Analysis,” Norwood, MA: Artech House, 2002.
[3] Chen,V. C., et al., “Micro-Doppler Effect in Radar: Phenomenon, Model, and Simulation Study,” IEEE Trans. Aerosp. Electron. Syst., vol.42, no.1,pp.221, 2006.
[4] Mika S., et al., “Fisher Discriminant Analysis with Kernels,” Neural Networks for Signal Processing Ix , Proceedings of the 1999 IEEE Signal Processing Society Workshop. IEEE, pp.41-48, 2002. [5] Ye,J., et al., “Two-Dimensional Linear Discriminant Analysis,”
Photogrammetric Engineering & Remote Sensing, vol.5, no.6, pp.1431-144, 2009.
[6] Rish, I., “An Empirical Study of the Naïve Bayes Classifier,” Journal of Universal Computer Science, vol.1, no.2, pp.127, 2001.
[7] Samworth, R. J. “Optimal Weighted Nearest Neighbour Classifiers,” Annals of Statistics, vol.40, no.5, pp.2733-2763, 2011.
[8] Stephenson, B., “Logistic Regression Analysis,” Springer Netherlands, 2008.
[9] Seyfioglu M. S., et al., “Deep Learning of Micro-Doppler Features for Aided and Unaided Gait Recognition,” in IEEE Radar Conf., Seattle, USA, pp.1125-1130, May 8-12, 2017.
[10] Fioranelli,F., et al., “Multistatic Human Micro-Doppler Classification of Armed/Unarmed Personnel,” IET Radar, Sonar & Navigation, vol.9, no.7, pp.857-865, 2015.
[11] Fioranelli, F., et al., “Performance Analysis of Centroid and SVD Features for Personnel Recognition using Multistatic Micro-Doppler” IEEE Geosci. Remote Sens. Lett., vol.13, no.5, pp.725-729, 2016. [12] Tong, S., et al., “Vector Machine Active Learning with Applications
to Text Classification,” Journal of Machine Learning Research}, vol.2, no.1, pp.45-66, 2008.
[13] http://mocap.cs.cmu.edu
[14] Shrestha, A., et al., “Feature Diversity for Fall Detection and Human Indoor Activities Classification Using Radar Systems,” In: RADAR 2017: International Conference on Radar Systems, Belfast, UK, 23-26 Oct 2017, (Accepted for Publication)
[15] M.Muller.,et al., “Documentation Mocap Database HDM05,” Technical report, No. CG-2007-2, ISSN 1610-8892, Universität Bonn, June 2007. 0.6 0.8 1 1.2 1.4 1.6 Time/Period(sec) a 150 200 250 300 350 400 450 500 M a x m ic ro -D o p p le r S h if t (H z ) Original Walk Original Run 0.6 0.8 1 1.2 1.4 1.6 Time/Period(sec) b 150 200 250 300 350 400 450 500 M a x m ic ro -D o p p le r S h if t (H z ) Original Walk Original Run 0.6 0.8 1 1.2 1.4 1.6 Time/Period(sec) c 150 200 250 300 350 400 450 500 M a x m ic ro -D o p p le r S h if t (H z ) Original Walk Original Run Classified Walk Classified Run 0.6 0.8 1 1.2 1.4 1.6 Time/Period(sec) d 150 200 250 300 350 400 450 500 M a x m ic ro -D o p p le r S h if t (H z ) Original Walk Original Run Classified Walk Classified Run 0.6 0.8 1 1.2 1.4 1.6 Time/Period(sec) e 150 200 250 300 350 400 450 500 M a x m ic ro -D o p p le r S h if t (H z ) Original Walk Original Run 0.6 0.8 1 1.2 1.4 1.6 Time/Period(sec) f 150 200 250 300 350 400 450 500 M a x m ic ro -D o p p le r S h if t (H z ) Original Walk Original Run
Figure 7. Classification results between walking and running via a) LDA, b) NB, c) KNN (K = 3), d) KNN (K = 5), e) SVM (γ = 0.3), and f) SVM (γ = 0.15).