Models for Effective Biomarker
Discovery
Abeer Hamza Abd Alzubaidi
School of Science and Technology
A thesis submitted in partial fulfilment of the requirements of
Nottingham Trent University for the degree of
Doctor of Philosophy
September 2019
This work is the intellectual property of the author. You may copy up to 5% of this work for private study, or personal, non-commercial research. Any re-use of the information contained within this document should be fully referenced, quoting the author, title, university, degree level and pagination. Queries or requests for any other use should be directed in the owner of the Intellectual Property Rights.
I hope you’re proud of your little girl I can see your smile from Heaven.
I would like to express my deepest appreciation to my supervisory team. Im deeply indebted to Dr Jonathan Tepper for the dedicated support and guidance through the process of researching and writing this thesis. Dr Tepper continuously provided encouragement and was always willing to assist in any way he could throughout the research project. I am also grateful to Dr Tepper for insightful suggestions, which have contributed greatly to the improvement of the thesis. I would like to express my deepest gratitude to Prof Ahmad Lotfi for the regular advice and encouragement. The door to Prof Lotfi office was always open and he was prepared to sit and listen to me. My sincere thanks are also extended to Dr Benjamin Inden for his supervisory role and support throughout this research project. I take this op-portunity to express my sincere appreciation to Dr Georgina Cosma, Prof David Brown, and Prof Graham Pockley for their support and encouragement throughout the process.
I gratefully acknowledge the funding received towards my PhD from the Ministry of Higher Education and Scientific Research in Iraq. I would like to thank my friends Dr Maria Bisele and Dr Edwin Ab-durakman for the wonderful times we shared. Big thank you to my sister, Ms Zaineb Alzubaidi who was always there for me and gave me lots of support. The people with the greatest indirect contribution to this work are my husband and my children. I owe my deepest grat-itude to my husband Captain Hamid Alhasnawi for being extremely supportive and understanding of my ambition. My children: Shahad, Ali, and Fatimah, you have inspired me to aim for extraordinary and made me more fulfilled. I appreciate all your patience and support, love you.
With the advent of high-throughput biology, large amounts of molecu-lar data are available for purposeful analysis and evaluation. Extract-ing relevant knowledge from high-throughput biomedical datasets has become a common goal of current approaches to personalised cancer medicine and understanding cancer genotype and phenotype. How-ever, the datasets are characterised by high dimensionality and rel-atively small sample sizes with small signal-to-noise ratios. Extract-ing and interpretExtract-ing relevant knowledge from such complex datasets therefore remains a significant challenge for the fields of machine learn-ing and data minlearn-ing. This is evidenced by the limited success these methods have had in detecting robust and reliable biomarkers for can-cers and other complicated diseases. This could also explain the lack of finding generic biomarkers among the identified published genes for identical diseases or clinical conditions.
This thesis proposes and evaluates the efficacy of two novel feature mining models established on the basis of the evolutionary compu-tation and deep learning paradigms to position and solve biomarker discovery as an optimisation problem. Deep learning methods lack the transparency and interpretability found in the evolutionary paradigm. To overcome the inherent issue of poor explanatory power associated with the deep learning, this research also introduces a novel deep min-ing model that helps to deconstruct the internal state of such deep learning models to reveal key determinants underlying its latent rep-resentations to aid feature selection. As a result, salient biomarkers for breast cancer and the positivity of the Estrogen and Progesterone receptors are discovered robustly and validated reliably across a wide range of independently generated breast cancer data samples.
The following publications have been published as a direct result of this thesis:
Refereed Journal Papers
Abeer Alzubaidi, Jonathan Tepper, Ahmad Lotfi. “A novel deep mining model for effective knowledge discovery from omics data”. Artificial Intelligence in Medicine, page 101821, 2020.
Abeer Alzubaidi, Jonathan Tepper, Benjamin Inden, Ahmad Lotfi, “mRNA sig-natures for predicting oestrogen and progesterone receptor status in Breast Can-cer: Findings from a novel deep mining approach”, In Press.
Refereed Conference Papers
Abeer Alzubaidi, Georgina Cosma, David Brown, A. Graham Pockley, “Breast cancer diagnosis using a hybrid genetic algorithm for feature selection based on mutual information”, 2016 International Conference on Interactive Technologies and Games (ITAG), pp. 70-76, 2016.
Abeer Alzubaidi, Georgina Cosma, David Brown, A. Graham Pockley, “A new hybrid global optimization approach for selecting clinical and biological features that are relevant to the effective diagnosis of ovarian cancer”, Computational In-telligence (SSCI) 2016 IEEE Symposium Series on, pp. 1-8, 2016.
for high dimensional biomedical data classification”, 2017 IEEE Conference on Computational Intelligence in Bioinformatics and Computational Biology (CIBCB), pp. 1-8, 2017.
Abeer Alzubaidi, “Challenges in Developing Prediction Models for Multi-modal High-Throughput Biomedical Data”, Proceedings of SAI Intelligent Systems Con-ference, pp. 1056-1069, 2018.
Publications v
Contents vii
List of Figures xi
List of Tables xxi
1 Introduction 1
1.1 Aims and Objectives . . . 6
1.2 Contribution of the Thesis . . . 7
1.3 Thesis Outline . . . 11
2 Literature Review 14 2.1 Introduction . . . 14
2.2 Breast Cancer . . . 14
2.3 Omics Data . . . 17
2.4 Statistical Techniques for Biomarker Discovery . . . 19
2.5 Machine Learning Methods for Biomarker Discovery . . . 22
2.5.1 Support Vector Machine . . . 24
2.5.2 Bagging Decision Tree . . . 26
2.6 Feature Mining Approaches for Biomarker Discovery . . . 29
2.6.1 Evaluation Measurements . . . 30
2.6.2 Search Methods . . . 32
2.7 Deep Learning Methods for Biomarker Discovery . . . 34
2.7.2 Interpretation Methods for Deep Learning . . . 37
2.8 Approaches for Validating Predictive Performance . . . 39
2.8.1 Hold Out Validation Approach . . . 40
2.8.2 Leave One Out Cross Validation Approach . . . 40
2.8.3 k-fold Cross Validation Approach . . . 41
2.9 Metrics for Estimating Predictive Performance . . . 42
2.10 Internal and External Validation . . . 44
2.11 Discussion . . . 45
3 Datasets and Experimental Methodology 48 3.1 Introduction . . . 48
3.2 Filtering Methods . . . 49
3.3 Breast Invasive Carcinoma Datasets . . . 50
3.3.1 Breast Invasive Carcinoma (TCGA, Nature 2012) . . . 51
3.3.2 Breast Invasive Carcinoma (TCGA, Cell 2015) . . . 53
3.3.3 Breast Invasive Carcinoma (TCGA, Provisional) . . . 54
3.4 The Integrated Breast Invasive Carcinoma Datasets . . . 55
3.4.1 The Integrated Datasets with ER groups . . . 56
3.4.1.1 NCP1 Dataset . . . 56
3.4.1.2 NCP2 Dataset . . . 56
3.4.1.3 NCP3 Dataset . . . 57
3.4.2 The Integrated Datasets with PR groups . . . 58
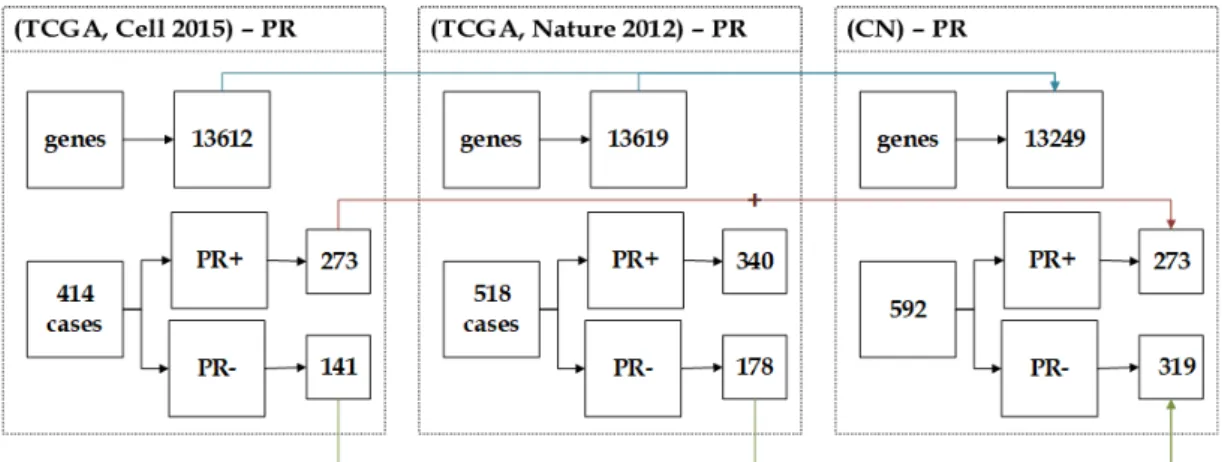
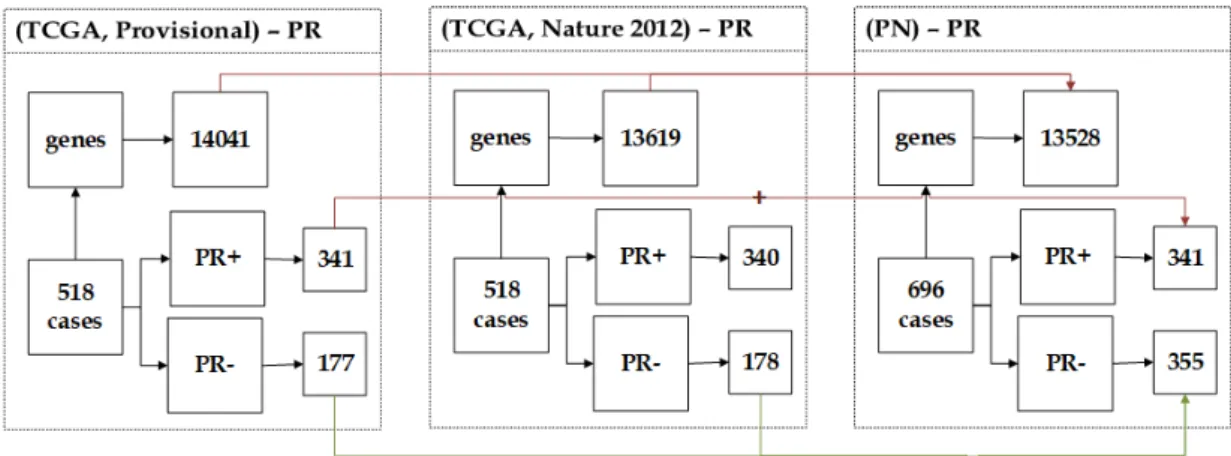
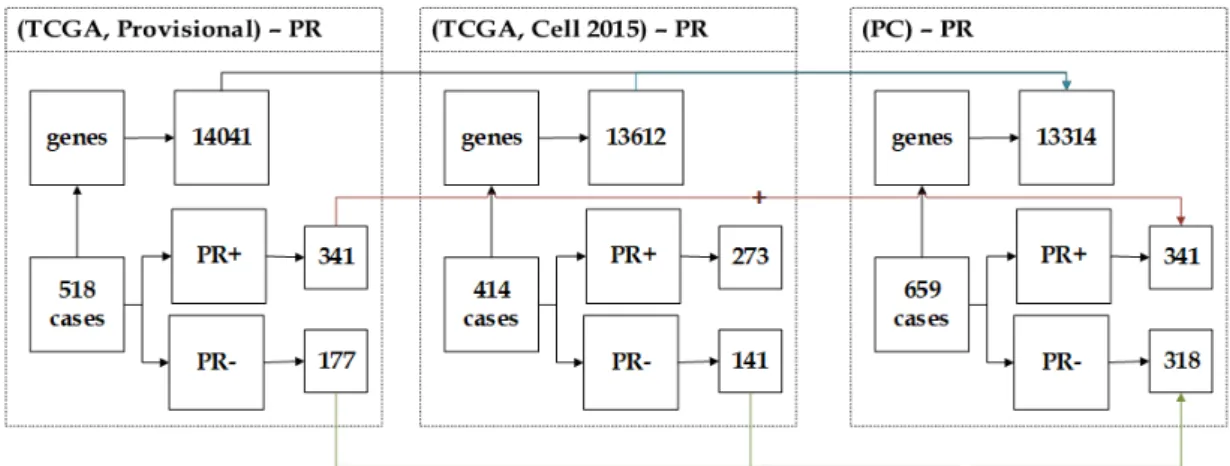
3.4.2.1 NC Dataset . . . 58 3.4.2.2 CN Dataset . . . 59 3.4.2.3 NP Dataset . . . 59 3.4.2.4 PN Dataset . . . 60 3.4.2.5 CP Dataset . . . 61 3.4.2.6 PC Dataset . . . 62
3.5 METABRIC Breast Cancer Dataset . . . 62
3.6 Ovarian Cancer Dataset . . . 64
3.7 Experimental Methodology . . . 64
3.7.1 Area Under the ROC Curve . . . 64
3.8 Discussion . . . 67
4 Evolutionary Mining Model 68 4.1 Introduction . . . 68
4.2 Genetic Algorithm . . . 69
4.3 Experimental Design of the Evolutionary Mining Model . . . 70
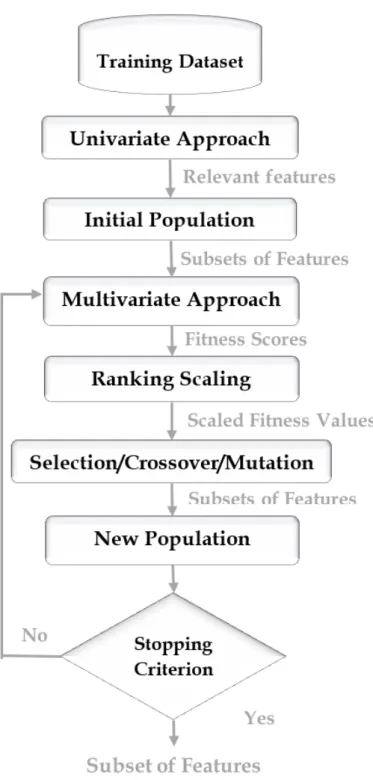
4.3.1 Univariate Approach . . . 70 4.3.2 Initial Population . . . 72 4.3.3 Multivariate Approach . . . 73 4.3.4 Ranking Scaling . . . 75 4.3.5 Selection . . . 75 4.3.6 Reproduction . . . 76
4.4 Results and Discussion . . . 79
4.4.1 Results and Discussion of Ovarian Cancer Dataset . . . 79
4.4.2 Results and Discussion of METABRIC Dataset . . . 81
4.4.3 Results and Discussion of Breast Invasive Carcinoma Datasets 83 4.4.3.1 ER Groups . . . 84
4.4.3.2 PR Groups . . . 86
4.4.4 Results and Discussion of Integrated Breast Invasive Car-cinoma Datasets . . . 86
4.4.4.1 ER Groups . . . 87
4.4.4.2 PR Groups . . . 88
4.5 Discussion . . . 90
5 Deep Mining Model 92 5.1 Introduction . . . 92
5.2 Experimental Design of the Deep Mining Model . . . 94
5.2.1 Auto-Encoder . . . 95
5.2.2 Sparse Compressed Auto-Encoder . . . 96
5.2.3 Stacked Sparse Compressed Auto-Encoder . . . 98
5.2.4 A New Weight Interpretation Method . . . 100
5.3 Results and Discussion . . . 102
5.3.2 Results and Discussion of METABRIC Dataset . . . 106
5.3.3 Results and Discussion of Breast Invasive Carcinoma Datasets111 5.3.3.1 ER Groups . . . 111
5.3.3.2 PR Groups . . . 116
5.3.4 Results and Discussion of Integrated Breast Invasive Car-cinoma Datasets . . . 120
5.3.4.1 ER Groups . . . 121
5.3.4.2 PR Groups . . . 125
5.4 Discussion . . . 129
6 Biomarkers and Bioinformatics 131 6.1 Introduction . . . 131
6.2 Discovered Biomarkers with HP Weight for ER . . . 132
6.3 Discovered Biomarkers with HN Weight for ER . . . 145
6.4 Discovered Biomarkers with HP Weight for PR . . . 159
6.5 Discovered Biomarkers with HN Weight for PR . . . 167
6.6 Discussion . . . 175
7 Conclusion and Future Work 176 7.1 Introduction . . . 176
7.2 Concluding Remarks . . . 177
7.2.1 Filtering Methods . . . 177
7.2.2 Evolutionary Mining Model . . . 178
7.2.3 Deep Mining Model . . . 179
7.2.4 The weight Interpretation Method . . . 180
7.2.5 Discovered Biomarkers . . . 181
7.3 Directions for Future Work . . . 184
Appendix A 186
Appendix B 189
2.1 The central dogma of molecular biology [121] and the types of omics data generated from each layer of dogma. . . 18
2.2 An example dataset described by two genes of a linear separator that maximises the margin between positive samples and negative samples, the red dots on the right side represent the positive group; and the blue dots on the left side represent the negative group. There are three support vectors. One point of the positive group on the right dashed line, and two negative samples on the left dashed line. . . 25
2.3 SVM soft-margin allows some data points to be misclassified or within the margin through slack variables ξi. . . 26
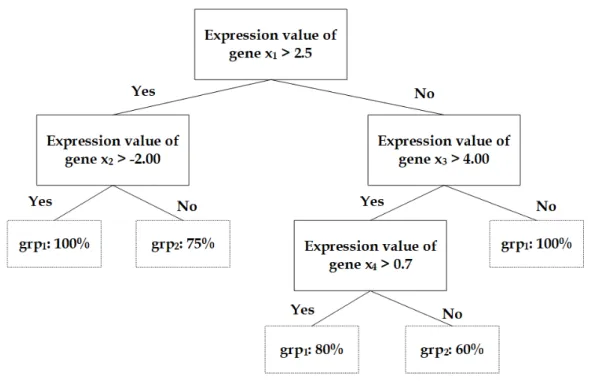
2.4 An illustration of a decision tree constructed using a gene expres-sion dataset of four genes. . . 27
2.5 An illustration of k-fold cross validation approach. . . 41
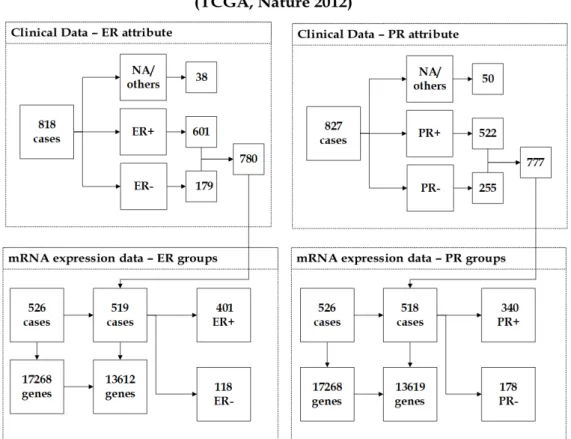
3.1 The description of (Nature 2012) dataset showing the unification of clinical data and mRNA expression data. . . 52
3.2 The description of (Cell 2015) dataset showing the unification of clinical data and mRNA expression data. . . 53
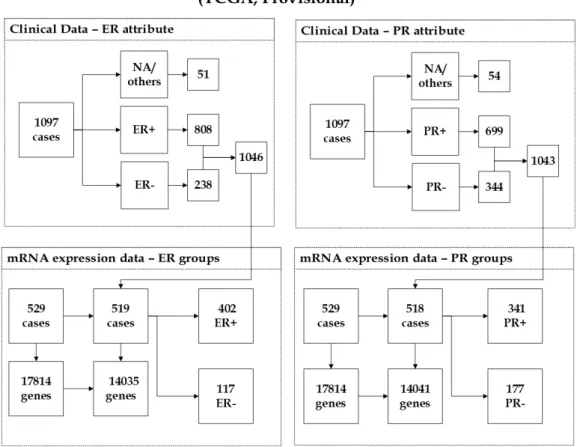
3.3 The description of (Provisional) dataset showing the unification of clinical data and mRNA expression data. . . 55
3.4 The description of NCP1 dataset showing the unification of (Na-ture 2012), (Cell 2015), and (Provisional) datasets. . . 57
3.5 The description of NCP2 dataset showing the unification of (Na-ture 2012), (Cell 2015), and (Provisional) datasets. . . 57
3.6 The description of NCP3 dataset showing the unification of (Na-ture 2012), (Cell 2015), and (Provisional) datasets. . . 58
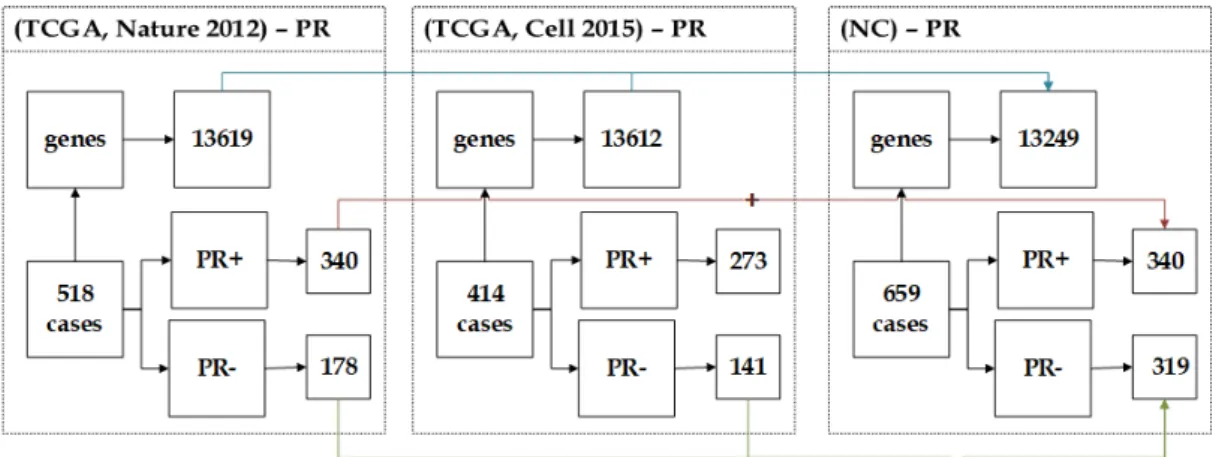
3.7 The description of NC dataset showing the unification of (Nature 2012) and (Cell 2015) datasets. . . 59
3.8 The description of CN dataset showing the unification of (Cell 2015) and (Nature 2012) datasets. . . 60
3.9 The description of NP dataset showing the unification of (Nature 2012) and (Provisional) datasets. . . 60
3.10 The description of PN dataset showing the unification of (Provi-sional) and (Nature 2012) datasets. . . 61
3.11 The description of CP dataset showing the unification of (Cell 2015) and (Provisional) datasets. . . 61
3.12 The description of PC dataset showing the unification of (Provi-sional) and (Cell 2015) datasets. . . 62
3.13 The description of (METABRIC) dataset showing the unification of clinical data and mRNA expression data. . . 63
3.14 An example of Receiver Operating Characteristics (ROC) curve. 65
4.1 Steps of the experimental design of the evolutionary mining model. 71
4.2 An illustration of the fitness score of each individual. . . 74
4.3 Histogram of parent individuals. . . 76
4.4 An illustration of the average distance between individuals at each generation. . . 77
4.5 An illustration of the algorithm’s evolution over generations. . . . 78
4.6 Scatter plots matrix of the stable predictors (index) of ovarian cancer dataset. . . 80
4.7 Scatter plots matrix of the stable predictors of METABRIC dataset with ER groups. . . 82
4.8 Scatter plots matrix of the stable predictors of METABRIC dataset with PR groups. . . 83
4.9 Scatter plots matrices of the generic biomarkers of the breast in-vasive carcinoma datasets with ER and PR groups. . . 85
4.10 Scatter plots matrices of the generic biomarkers of the integrated datasets with ER groups. . . 88
4.11 Scatter plots matrices of the generic biomarkers of the integrated datasets with PR groups. . . 89
5.1 An illustration of the validation performance of the SSCAE. . . . 99
5.2 Histogram of z-scores of the weight vector. . . 101
5.3 Scatter plots matrix of the stable predictors (index) with HP weight of ovarian cancer dataset. . . 104
5.4 Scatter plots matrix of the stable predictors (index) with HN weight of ovarian cancer dataset. . . 105
5.5 Scatter plots matrix of the stable predictors with HP weight of METABRIC dataset with ER groups. . . 107
5.6 Scatter plots matrix of the stable predictors with HN weight of METABRIC dataset with ER groups. . . 108
5.7 Scatter plots matrix of the stable predictors with HP weight of METABRIC dataset with PR groups. . . 109
5.8 Scatter plots matrix of the stable predictors with HN weight of METABRIC dataset with PR groups. . . 110
5.9 Scatter plots matrices of the generic biomarkers with HP weight of the breast invasive carcinoma datasets with ER groups. . . 113
5.10 Scatter plots matrices of the generic biomarkers with HN weight of the breast invasive carcinoma datasets with ER groups. . . 114
5.11 Scatter plots matrices of the generic biomarkers with HP weight of the breast invasive carcinoma datasets with PR groups. . . 118
5.12 Scatter plots matrices of the generic biomarkers with HN weight of the breast invasive carcinoma datasets with PR groups. . . 119
5.13 Scatter plots matrices of the generic biomarkers with HP weight of the integrated datasets with ER groups. . . 123
5.14 Scatter plots matrices of the generic biomarkers with HN weight of the integrated datasets with ER groups. . . 124
5.15 Scatter plots matrices of the generic biomarkers with HP weight of the integrated datasets with PR groups. . . 126
5.16 Scatter plots matrices of the generic biomarkers with HN weight of the integrated datasets with PR groups. . . 127
6.1 Scatter plot of ESR1 and GFRA1 of (Nature 2012) dataset with ER groups, illustrating that the observation 306 from the ER+ group has high expression levels of (ESR1, GFRA1), which are (4.7657,4.512) in comparison to the observation 235 from the ER-group, which has low expression levels of (ESR1, GFRA1), which are (−4.5636,−4.3411). . . 133
6.2 Scatter plot of AGR3 and SIAH2 of (Nature 2012) dataset with ER groups, illustrating that the observation 406 from the ER+ group has high expression levels of (AGR3, SIAH2), which are (5.5085,2.9504) in comparison to the observation 233 from the ER-group, which has low expression levels of (AGR3, SIAH2), which are (−3.9565,−1.3913). . . 135
6.3 Scatter plot of C6orf97 and SLC39A6 of (Nature 2012) dataset with ER groups, illustrating that the observation 142 from the ER+ group has high expression levels of (C6orf97, SLC39A6), which are (3.1637,4.6489) in comparison to the observation 187 from the ER- group, which has low expression levels of (C6orf97, SLC39A6), which are (−3.5103,−2.0668). . . 137
6.4 Scatter plot of ANXA9 and NAT1 of (Nature 2012) dataset with ER groups, illustrating that the observation 142 from the ER+ group has high expression levels of (ANXA9, NAT1), which are (3.698,6.6264) in comparison to the observation 13 from the ER-group, which has low expression levels of (ANXA9, NAT1), which are (−3.108,−1.3075). . . 139
6.5 Scatter plot of CA12 and SCUBE2 of (Nature 2012) dataset with ER groups, illustrating that the observation 200 from the ER+ group has high expression levels of (CA12, SCUBE2), which are (3.8954,5.2376) in comparison to the observation 373 from the ER-group, which has low expression levels of (CA12, SCUBE2), which are (-3.15, -3.1562). . . 140
6.6 Scatter plot of EVL and PCP2 of (Nature 2012) dataset with ER groups, illustrating that the observation 89 from the ER+ group has high expression levels of (EVL, PCP2), which are (3.3006,2.5823) in comparison to the observation 105 from the ER- group, which
has low expression levels of (EVL, PCP2), which are (−2.0036,−0.67983).142
6.7 Scatter plot of FSIP1 and GATA3 of (Nature 2012) dataset with ER groups, illustrating that the observation 12 from the ER+ group has high expression levels of (FSIP1, GATA3), which are (7.2055,2.6464) in comparison to the observation 175 from the ER-group, which has low expression levels of (FSIP1, GATA3), which are (−0.949,−4.9429). . . 143
6.8 Scatter plot of IGFALS and LRRC56 of (Nature 2012) dataset with ER groups, illustrating that the observation 448 from the ER+ group has high expression levels of (IGFALS, LRRC56), which are (5.4277,2.4235) in comparison to the observation 512 from the ER- group, which has low expression levels of (IGFALS, LRRC56), which are (−1.2985,−1.8847). . . 145
6.9 Scatter plot of VGLL1 and PPP1R14C of (Nature 2012) dataset with ER groups, illustrating that the observation 93 from the ER+ group has low expression levels of (VGLL1, PPP1R14C), which are (−0.54387,−4.3153) in comparison to the observation 81 from the ER- group, which has high expression levels of (VGLL1, PPP1R14C), which are (5.0809,2.7428). . . 146
6.10 Scatter plot of PROM1 and PSAT1 of (Nature 2012) dataset with ER groups, illustrating that the observation 336 from the ER+ group has low expression levels of (PROM1, PSAT1), which are (−4.1265,−6.553) in comparison to the observation 478 from the ER- group, which has high expression levels of (PROM1, PSAT1), which are (5.5998,−0.1715). . . 148
6.11 Scatter plot of B3GNT5 and SOX11 of (Nature 2012) dataset with ER groups, illustrating that the observation 303 from the ER+ group has low expression levels of (B3GNT5, SOX11), which are (−2.6707,−2.9344) in comparison to the observation 378 from the ER- group, which has high expression levels of (B3GNT5, SOX11), which are (3.9505,4.103). . . 150
6.12 Scatter plot of KRT16 and TMEM40 of (Nature 2012) datasets with ER groups, illustrating that the observation 255 from the ER+ group has low expression levels of (KRT16, TMEM40), which are (−2.2758,0.11) in comparison to the observation 373 from the ER- group, which has high expression levels of (KRT16, TMEM40), which are (5.3142,4.379). . . 152
6.13 Scatter plot of BBOX1 and C1orf106 of (Nature 2012) dataset with ER groups, illustrating that the observation 495 from the ER+ group has low expression levels of (BBOX1, C1orf106), which are (−0.38025,−2.7811) in comparison to the observation 243 from the ER- group, which has high expression levels of (BBOX1, C1orf106), which are (8.0045,3.2498). . . 153
6.14 Scatter plot of DKK1 and KRT81 of (Nature 2012) dataset with ER groups, illustrating that the observation 287 from the ER+ group has low expression levels of (DKK1, KRT81), which are (−7.716,−0.467) in comparison to the observation 513 from the ER- group, which has high expression levels of (DKK1, KRT81), which are (1.7045,3.7175). . . 155
6.15 Scatter plot of RARRES1 and S100A8 of (Nature 2012) dataset with ER groups, illustrating that the observation 288 from the ER+ group has low expression levels of (RARRES1, S100A8), which are (−2.294,−0.23025) in comparison to the observation 433 from the ER- group, which has high expression levels of (RAR-RES1, S100A8), which are (6.7431,6.5045). . . 156
6.16 Scatter plot of S100A9 and TRPV6 of (Nature 2012) dataset with ER groups, illustrating that the observation 231 from the ER+ group has low expression levels of (S100A9, TRPV6), which are (−1.4145,−0.8875) in comparison to the observation 412 from the ER- group, which has high expression levels of (S100A9, TRPV6), which are (6.1717,5.1405). . . 158
6.17 Scatter plot of HRASLS and PPP1R1A of (Nature 2012) dataset with ER groups, illustrating that the observation 159 from the ER+ group has low expression levels of (HRASLS, PPP1R1A), which are (−4.3462,−2.4207) in comparison to the observation 432 from the ER- group, which has high expression levels of (HRASLS, PPP1R1A), which are (3.4473,3.6841). . . 159
6.18 Scatter plot of AGR3 and GFRA1 of (Nature 2012) dataset with PR groups, illustrating that the observation 241 from the PR+ group has high expression levels of (AGR3, GFRA1), which are (5.8145,3.688) in comparison to the observation 463 from the PR-group, which has low expression levels of (AGR3, GFRA1), which are (−4.4672,−4.1019). . . 160
6.19 Scatter plot of SCUBE2 and SIAH2 of (Nature 2012) dataset with PR groups, illustrating that the observation 171 from the PR+ group has high expression levels of (SCUBE2, SIAH2), which are (4.3738,2.3989) in comparison to the observation 232 from the PR-group, which has low expression levels of (SCUBE2, SIAH2), which are (−2.457,−1.3913). . . 162
6.20 Scatter plot of FGD3 and SUSD3 of (Nature 2012) dataset with PR groups, illustrating that the observation 318 from the PR+ group has high expression levels of (FGD3, SUSD3), which are (4.0443,5.2162) in comparison to the observation 185 from the PR-group, which has low expression levels of (FGD3, SUSD3), which are (−1.4253,−2.309). . . 163
6.21 Scatter plot of GRPR and PGLYRP2 of (Nature 2012) dataset with PR groups, illustrating that the observation 239 from the PR+ group has high expression levels of (GRPR, PGLYRP2), which are (6.0467,4.3773) in comparison to the observation 295 from the PR- group, which has low expression levels of (GRPR, PGLYRP2), which are (−0.72033,−1.16177). . . 165
6.22 Scatter plot of GREB1 and PGR of (Nature 2012) dataset with PR groups, illustrating that the observation 100 from the PR+ group has high expression levels of (GREB1, PGR), which are (1.262,5.4402) in comparison to the observation 380 from the PR-group, which has low expression levels of (GREB1, PGR), which are (−4.3128,−4.4838). . . 166
6.23 Scatter plot of ATP6V0A4 and LAD1 of (Nature 2012) dataset with PR groups, illustrating that the observation 169 from the PR+ group has low expression levels of (ATP6V0A4, LAD1), which are (−4.1855,−1.5495) in comparison to the observation 364 from the PR- group, which has high expression levels of (ATP6V0A4, LAD1), which are (4.459,3.3618). . . 168
6.24 Scatter plot of C9orf58 and NXPH1 of (Nature 2012) dataset with PR groups, illustrating that the observation 23 from the PR+ group has low expression levels of (C9orf58, NXPH1), which are (−3.3423,−1.46) in comparison to the observation 126 from the PR- group, which has high expression levels of (C9orf58, NXPH1), which are (2.4937,6.3407). . . 170
6.25 Scatter plot of CLCA2 and FGFR4 of (Nature 2012) dataset with PR groups, illustrating that the observation 252 from the PR+ group has low expression levels of (CLCA2, FGFR4), which are (−3.5682,−2.5823) in comparison to the observation 32 from the PR- group, which has high expression levels of (CLCA2, FGFR4), which are (6.3023,1.8037). . . 171
6.26 Scatter plot of PPP1R1A and TRPV6 of (Nature 2012) dataset with PR groups, illustrating that the observation 396 from the PR+ group has low expression levels of (PPP1R1A, TRPV6), which are (−2.6309,−0.37375) in comparison to the observation 215 from the PR- group, which has high expression levels of (PPP1R1A, TRPV6), which are (4.18067,5.1658). . . 173
6.27 Scatter plot of C1orf115 and TSPAN8 of (Nature 2012) dataset with PR groups, illustrating that the observation 286 from the PR+ group has low expression levels of (C1orf115, TSPAN8), which are (−2.3804,−5.9947) in comparison to the observation 138 from the PR- group, which has high expression levels of (C1orf115, TSPAN8), which are (2.9592,3.1603). . . 174
1 The performance of the SSCAE at the final iteration of ovarian cancer dataset and METABRIC dataset with ER and PR groups. 189
2 The performance of the SSCAE at the final iteration of the breast invasive carcinoma datasets with ER groups. . . 190
3 The performance of the SSCAE at the final iteration of the breast invasive carcinoma datasets with PR groups. . . 191
4 The performance of the SSCAE at the final iteration of the inte-grated datasets with ER groups. . . 192
5 The performance of the SSCAE at the final iteration of the inte-grated datasets with PR groups. . . 193
6 The performance of the SSCAE at the final iteration of the inte-grated datasets with PR groups. . . 194
7 The performance of the SVM and BDT models at the final iteration of ovarian cancer dataset. . . 195
8 The performance of the SVM and BDT models at the final iteration of METABRIC dataset with ER groups. . . 196
9 The performance of the SVM and BDT models at the final iteration of METABRIC dataset with PR groups. . . 197
10 The performance of the SVM model at the final iteration of breast invasive carcinoma dataset with ER groups. . . 198
11 The performance of the BDT model at the final iteration of breast invasive carcinoma dataset with ER groups. . . 199
12 The performance of the SVM model at the final iteration of breast invasive carcinoma dataset with PR groups. . . 200
13 The performance of the BDT model at the final iteration of breast invasive carcinoma dataset with PR groups. . . 201
14 The performance of the SVM model at the final iteration of the integrated dataset with ER groups. . . 202
15 The performance of the BDT model at the final iteration of the integrated dataset with ER groups. . . 203
16 The performance of the SVM model at the final iteration for the integrated dataset with PR groups. . . 204
17 The performance of the BDT model at the final iteration of the integrated dataset with PR groups. . . 205
18 The performance of the SVM model at the final iteration of the integrated dataset with PR groups. . . 206
19 The performance of the BDT model at the final iteration of the integrated dataset with PR groups. . . 207
4.1 The performance of the SVM and BDT models built on the stable predictors of METABRIC datasets with ER and PR groups. . . . 81
4.2 The performance of the SVM and BDT models built on the generic biomarkers of the breast invasive carcinoma datasets with ER and PR groups. . . 84
4.3 The performance of the SVM and BDT models built on the generic biomarkers of the integrated datasets with ER groups. . . 87
4.4 The performance of the SVM and BDT models built on the generic biomarkers of the integrated datasets with PR groups. . . 90
5.1 The performance of the SVM and BDT models built on the stable predictors of ovarian cancer dataset. . . 106
5.2 The performance of the SVM and BDT models built on the stable predictors of METABRIC dataset with ER and PR groups. . . 110
5.3 The performance of the SSCAE of the breast invasive carcinoma datasets with ER groups. . . 112
5.4 The performance of the SVM and BDT models built on the generic biomarkers of the breast invasive carcinoma datasets with ER groups.115
5.5 The performance of the SSCAE of the breast invasive carcinoma datasets with PR groups. . . 116
5.6 The performance of the SVM and BDT models built on the generic biomarkers of the breast invasive carcinoma datasets with PR groups.117
5.7 The performance of the SSCAE of the integrated datasets with ER groups. . . 121
5.8 The performance of the SVM and BDT models built on the generic biomarkers of the integrated datasets with ER groups. . . 122
5.9 The performance of the SSAE of the integrated datasets with PR groups. . . 125
5.10 The performance of the SVM and BDT models built on the generic biomarkers of the integrated datasets with PR groups. . . 128
1 The sizes of the training-validation sets of ovarian cancer dataset and METABRIC dataset with ER and PR groups. . . 186
2 The average MSE of each SCAE of ovarian cancer dataset and METABRIC datasets with ER and PR groups. . . 186
3 The sizes of the training-validation sets of the breast invasive car-cinoma datasets with ER groups. . . 186
4 The sizes of the training-validation sets of the breast invasive car-cinoma datasets with PR groups. . . 187
5 The average MSE of each SCAE of the breast invasive carcinoma datasets with ER groups. . . 187
6 The average MSE of each SCAE of the breast invasive carcinoma datasets with PR groups. . . 187
7 The sizes of the training-validation sets of the integrated datasets with ER groups. . . 187
8 The sizes of the training-validation sets of the integrated datasets with PR groups. . . 188
9 The average MSE of each SCAE of the integrated datasets with ER groups. . . 188
10 The average MSE of each SCAE of the integrated datasets with PR groups. . . 188
Acronyms
ACO Ant Colony Optimisation AE Auto-Encoder
AI Artificial Intelligence AUC Area Under the Curve BDT Bagging Decision Tree CV Cross Validation DL Deep Learning DM Deep Mining EA Evolutionary Algorithm EC Evolutionary Computation ER Estrogen Receptor ER+ ER-positive
FCBF Fast Correlation-Based Filter FN False Negative
FP False Positive FPR False Positive Rate GA Genetic Algorithm
HDSSS High Dimensional Small Sample Size HN High Negative
HP High Positive IW Input Weight
LDA Linear Discriminant Analysis LOOCV Leave One Out Cross Validation LW Layer Weight
ML Machine Learning
MRI Magnetic Resonance Imaging
mRMR minimal-Redundancy-Maximal-Relevance mRNA messenger RNA
MSE Mean Square Error
MSKCC Memorial Sloan Kettering Cancer Center NCI National Cancer Institute
NHGRI National Human Genome Research Institute NIH National Institutes of Health
NIPS Neural Information Processing Systems PPV Positive Predictive Value
PR Progesterone Receptor PR+ PR-positive
PSO Particle Swarm Optimisation ROC Receiver Operating Characteristics SCAE Sparse Compressed Auto-Encoder SNPs Single Nucleotide Polymorphisms SOMs Self-Organising Maps
SSCAE Stacked Sparse Compressed Auto-encoder SVM Support Vector Machine
SVM-REF Support Vector Machine - Recursive Feature Elimination TCGA The Cancer Genome Atlas
TN True Negative TNR True Negative Rate TP True Positive TPR True Positive Rate
Introduction
The term feature mining refers to emerging statistical data analysis and com-putational intelligence techniques with the goal of knowledge discovery based on a better understanding of the data. Feature mining can also refer to the pro-cess of endowing explanatory capability within the statistical and computational paradigms used. Accordingly, feature mining can be described as the discovery of the underlying structure of the data. The knowledge domain addressed by the research discussed in this thesis is that of clinically relevant ‘biomarkers’ for cancers of interest. A biomarker is formally defined as “a biological characteris-tic that is objectively measured and evaluated as an indicator of normal biologic processes, pathogenic processes, or pharmacologic responses to a therapeutic inter-vention” [116]. According to World Health Organisation (WHO), International Programme on Chemical Safety1, a biomarker is defined as“Any substance,
struc-ture or process that can be measured in the body or its products and can influence or predict the incidence of outcome or disease”. Based on both definitions, a biomarker can be described as a quantifiable biological indicator for detecting diseases, monitoring its progression, and estimating susceptibility to treatment therapy. Clinical tests based on biomarkers have been applied in medical practice for decades for diseases diagnosis and prognosis and drug discovery [14].
Advances in molecular science and the recent availability of microarray data have led to an exponential growth in volume, variety, and complexity of
cal information. The completion of the first sequenced human genome [200,300] is one of the main triggers of evolution in biology. Microarray technology al-lows for thousands of genes from a given cell or tissue sample to be examined simultaneously heralding a new era of research in relatively nascent fields such as computational biology and bioinformatics. These changes and others constitute what is called high throughput or high dimensional biology that produces omics data, which is discussed in details in Chapter 2. The availability of omics data repositories such as The Cancer Genome Atlas (TCGA) [314] brings tremendous opportunities for clinicians, bioinformaticians, statisticians and data scientists to benefit from this abundance of cancer data to build a wide range of more accurate models of the mechanisms underlying cancer and related diseases. Furthermore, analysing omics data over several research studies can allow for more innovative discoveries and findings, and this is further illustrated in Chapter 3, along with the impact of the wealth of such data on the research community.
Biomarker identification from omics data has become a key goal to approach precision medicine. Precision medicine aims to exploit this explosion of molecular data together with individual patient characteristics to personalise medical treat-ment [56]. Therefore, the next frontier in the move towards personalised cancer medicine is to develop sophisticated knowledge discovery models that can detect biomarkers underlying the variations of control (i.e. individuals without disease) and cancer (i.e. individuals with the disease) groups. The extraction of relevant knowledge from omics data can contribute to answering serious etiologic questions about cancer and developing effective procedures to prevent, detect, manage, and treat this heterogeneous complicated disease. Omics data is characterised by high dimensionality, complexity, relatively small sample sizes and the amount of noise. Omics datasets typically contain tens of thousands of molecules (e.g. genes). The problem with high dimensional data was coined firstly by Richard Bellman as ‘the curse of dimensionality’ [19]. The curse of dimensionality term refers to various phenomena that arise when dealing with data that comprise hundreds or thousands of variables [92].
Having tens of thousands of variables means that the number of possible in-put configurations is exponential. However, not all of this information is relevant because the feature spaces of such data comprise large amounts of irrelevant and
noisy features, including genes with unreliable measurements that can be con-sidered indistinguishable from noise. Moreover, when the dimensionality of a dataset increases, the number of possible variable value combinations exponen-tially increases, and therefore the available samples become sparse. In addition to such ‘curse of dimensionality’ issues, the number of genes of omics data vastly exceeds the number of observations, thus, the available biological samples become even more sparse, making the process of discovering a robust subset of relevant molecular markers a very challenging task. As a result, the problem of omics data analysis is more likely to be that the relevant variations underlying the data is not adequately exploited due to an insufficient number of biological samples (i.e. a couple of hundreds), which in turn have a low signal-to-noise ratio as well as their response groups are more likely to have considerable disparate sizes.
High dimensional complex data generated by omics technology has signifi-cantly challenged traditional statistical techniques and machine learning methods due to a range of subsequent issues, such as the curse of dimensionality, overfit-ting, bias-variance trade-off, model robustness, interpretability, and computa-tional cost. Machine learning models applied to this data will have to mitigate against the high risk of becoming too sensitive to the variations in the data used for model fitting and less sensitive to variation in the unseen data during model evaluation, so that the models will have to minimise ‘overfitting’ the data. Conse-quently, achieving the trade-off between these bias-variance quantities is becoming more challenging where situations of overfitting (low bias and high variance) or underfitting (high bias and low variance) being easily achieved whilst good gener-alisation (low bias and low variance) remaining notoriously elusive. Furthermore, a knowledge discovery model that focuses on detecting an informative subset of candidate biomarkers from such small datasets could be very sensitive to which observations are included in the data modelling phase of data mining raising the issue of model robustness, where different outcomes could be obtained due to the little variations in the data. In order to mitigate against these limitations and boost the level of accuracy, the complexity of models has been increased, where increasing the complexity of a model is more likely decreasing its explainability; due to the trade-off between model complexity and interpretability. Herein, it is relevant to emphasise the importance of adding some explanatory capability
to the model used by health practitioners and decision-making professionals for prediction relevant to precision medicine. Moreover, handling high-throughput omics data could be computationally intensive, and the potential for the process to become intractable is increased dramatically if the utilised model is slow to fit. Classical statistical techniques based on univariate and multivariate approaches have been extensively exploited as analytical tools in biology and medicine to de-tect statistically significant changes in the behaviour of gene/protein expressions among different biological conditions. In other words, biomarker discovery at the molecular level depends on the principle that the discrimination between healthy (control) and diseased patient groups of samples can be determined by the differ-ential expression levels, intensity values, or activity of genes, proteins, and other molecules. For example, intensity values of highly predictive proteins for cancer patients differ significantly from samples in the control group. Therefore, genes or proteins that exhibit significantly the greatest variations across different condi-tions can be considered as potential biomarkers for a disease or clinically relevant outcome. Accordingly, the comparison between control and cancer groups was the traditional approach to recognise any statistically significant variations, which could lead to discovering any potential biomarkers. However, biological samples of microarray or mass spectrometry data are usually defined with thousands or tens of thousands of variables. From a statistical perspective, inferring useful knowledge from such data using those traditional methods is difficult because they cannot exploit enough of the relevant variations underlying the data. This is particularly true when analysing biological datasets with statistical models that make inherent specific assumptions about the data, such as linearity, normality, and homogeneity of variances that do not necessarily resemble the true function, leading to poor estimation. The detailed evaluation of utilising traditional sta-tistical techniques for knowledge discovery from omics data is critically discussed in Chapter 2.
The research interest has therefore transferred to machine learning algorithms that allow the discovery of interesting complex patterns, which are often missed by the traditional statistical techniques. Since the advent of the big data revo-lution and the increasingly ubiquitous availability of terabyte data storage and giga- and tera-flop compute power, machine learning methods have become an
invaluable tool in computational biology and its cognate disciplines. Machine learning methods have been incorporated in diverse problem domains in health-care area, leading to many successful applications, ranging from cancer diagnosis and prognosis, medical imaging, to predictive modelling and decision support. Due to the fact that the performance of machine learning methods depends on the data, high throughput complex data generated by omics technology has sig-nificantly challenged these learning models. The curse of dimensionality issues combined with the challenge of relatively small sample sizes made it no longer applicable for machine learning algorithms to be employed alone for omics data analysis because the number of representative samples required to exploit enough of the relevant variations underlying the data and achieve an acceptable level of accuracy is growing exponentially. The detailed and critical discussions of em-ploying machine learning methods for knowledge extraction from omics data are presented in Chapter 2.
This has motivated the development of more sophisticated feature mining models to support knowledge discovery for prediction purposes, which has be-come a core process in the construction of high dimensional classification models. Feature mining aims to detect interesting complexity from the unknown structure of omics data that could not be discovered by traditional statistical techniques or machine learning methods alone. Consequently, a variety of different methodolo-gies and techniques from the fields of statistical data analysis and computational intelligence are integrated in the hope of achieving better performance than using approaches from one field alone. Detailed discussions of various feature mining paradigms are considered in Chapter 2, particularly for high dimensional prob-lems. However, omics data has the additional challenge of small sample sizes such that the number of features is much greater than the number of samples, putting even more pressure on such feature mining models for extracting robust and reliable molecular markers. This is evidenced by the limited success these methods have had in detecting robust and reliable biomarkers for diseases, such as cancers. It can also explain why the discovery of meaningful biomarkers from such datasets remains a major challenge in personalised cancer medicine, and also could illustrate the lack of finding generic biomarkers among the identified published genes for identical clinical conditions.
As a result, the problem of biomarker discovery from High Dimensional Small Sample Size (HDSSS) omics data is complicated and requires more sophisticated approaches that can address these challenges. The significance of choosing the right methodology for each step of an effective feature mining model applied to omics data is emphasised in the research presented in this thesis. The aim of the knowledge discovery models can be achieved by understanding the key research challenges, using the proper techniques, not the available and popular ones, and careful attention to performance estimation in order to report significant and reliable findings.
1.1
Aims and Objectives
The overarching aim of this research is to develop effective feature mining models that robustly aid the extraction of knowledge from HDSSS omics data in a way that is transparent and supports the endeavour of precision medicine.
In order to accomplish this aim, the following objectives will be met:
• Identify and characterise suitable and reliable high quality HDSSS omics datasets for cancers of interest (e.g. TCGA datasets).
• Empirically establish effective data pre-processing methods that maximise the ability of the feature mining models to identify salient biomarkers.
• Critically evaluate state-of-the-art evolutionary computation and deep neu-ral network methods for biomarker discovery.
• Develop novel feature mining models and related innovations which mitigate against the limitations reported in the research literature, whilst maximising their strengths for biomarker discovery.
• Determine and mitigate against the sensitivity of the feature mining models to imbalanced group datasets.
• Investigate and establish most appropriate model selection methods (in-cluding objective functions) to effect the simplest model with the highest level of generalisation for each model class.
• Explore and implement a technique for interpreting salient features identi-fied within the deep feature learning model.
• Investigate and implement appropriate validation and evaluation metrics for estimating the generalisation and robustness performance of the feature mining models.
• Identify appropriate validation criteria to verify the validity of the biomark-ers discovered by the feature mining models with the specific criteria of predictivity, stability, and generalisability.
1.2
Contribution of the Thesis
The first fundamental issue addressed by this research was the reliable extrac-tion of important biomarker informaextrac-tion from HDSSS omics data. The research explored a number of disparate paths within the cognate disciplines of compu-tational intelligence and compucompu-tational biology. The first path was conducted by investigating the direction of solving the biomarker discovery as an optimi-sation problem. Biological data generated by omics technology has thousands of variables and to identify relevant genes to the response groups or conditions, an extremely large number of evaluations is required. Therefore, feature min-ing approaches that can guarantee to find the optimal subset of features are computationally expensive and infeasible in most practical cases. Optimisation methods attempt to identify the best possible subset of features from the expo-nential search space of omics data with the least amount of effort. Therefore,
the primary contribution of this thesis is to develop an ensemble evolutionary mining model based on a hybrid selection approach to navigate through large genomic and proteomic data and detect an ensemble subset of stable predictors. Different paradigms of feature selection based on the optimisation method have been investigated to find the most appropriate measurement for a HDSSS
prob-lem. Consequently, the ensemble hybrid selection approach is integrated with the parallel adaptive search of the evolutionary method so that the curse of di-mensionality issues can be handled and the robustness of the selected subsets of candidate predictors can be enhanced.
What has driven us to the second direction of this research is that a fea-ture learning model that can discover relevant knowledge automatically from large-scale data, without the need for hand designed features that require do-main expertise or ad-hoc specific methodologies or techniques is highly desirable. Therefore, the second path of our research is investigating the usefulness of state-of-the-art Deep Learning to mitigate against the mentioned limitations on the basis of automatically capturing enough of the meaningful abstractions latent with the available biological samples. Deep learning methods provide superior performance over traditional learning approaches by handling the curse of di-mensionality, improving the generalisability, and making meaningful use of the data in a wide range of problem domains such as computer vision, natural lan-guage processing, and speech recognition. Recently, in the healthcare area, deep learning methods have brought about breakthroughs in medical imaging such as CheXpert [146], a large dataset that contains 224,316 chest radiographs of 65,240 patients for chest radiograph interpretation.
In many of these problem domains, a large number of samples are typically available to train a deep learning model where the signal-to-noise ratio is quite high. The key challenge is to capture the generic factors of variations that un-derlie the unknown structure of the data in a way that can significantly enhance the generalisation to unseen observations. This is, however, not the case in bioin-formatics research where high throughput omics datasets are characterised by a small number of biological samples (i.e. hundreds of patient samples), which in turn have a low signal-to-noise ratio. Therefore, for omics data analysis, the problem is more likely to be that the relevant variations underlying the data can not be adequately captured due to an insufficient number of biological sam-ples. As a result, it may seem somewhat counterintuitive to use deep learning methods for HDSSS datasets due to the fact that these learning models typi-cally require substantial data to constrain their parameters and learn a useful hypothesis. Applications of deep neural network methods for knowledge
discov-ery from HDSSS omics data remain scarce. This necessities introducing new deep learning-inspired paradigms that can approximate enough of the relevant varia-tions represented by those biological samples. Therefore, the second contribution of this thesis is introducing a new deep feature learning model that can capture enough of the complexity of interest represented by the available biological sam-ples. More specifically, the proposed deep learning model is introduced based on a set of non-linear sparse Auto-Encoders that are deliberately constructed in an under-complete manner to force the network to discover enough of the interesting complexity underlying the biological samples. The ability of using a stacked set of neural auto-encoders alleviates the issue of vanishing gradients and therefore provides a robust deep learning model to automatically identify the complex fea-tural representations necessary to capture the important variations within the original dataset. The proposed deep feature learning model is utilised to discover and interpret important signals from omics data that aid prediction relevant to precision medicine.
The proposed deep feature learning model applies multiple levels of projections to the input features to abstract the problem and capture high-level dependen-cies for achieving high-level of generalisability. This would be a powerful learning model for high dimensional classification problems. However, for the problem of biomarker identification, it is hard to interpret which subsets of genes were dominant within the internal representations and responsible for deriving such predictions. Therefore, a fundamental issue with the deep learning paradigm is the lack of explanatory power, and their inability to unambiguously state which input features are responsible for its behaviour. To overcome the inherent issue of poor explanatory power associated with the deep learning paradigm, we en-deavour in a new direction of research that focuses on deconstructing the internal mechanism of such deep learning models based on a new weight interpretation method. The learning process of the deep learning relies mainly on sensibly fit-ting the weight configurations to define the model’s input-output function. This reflects the fact that the weight is the main indicator of variable’s importance, in which the weight of each variable reflects its contribution through the network, so that the signal with a larger positive or negative weight has a greater impact.
deep mining to sculpt inside the deep feature learning model and open the so-called black box of the network for biomarker identification. A model that is able to state which phenotypes are key determinants is a crucial element of pre-diction systems used by health practitioners and decision-making professionals. It is therefore important we are able to provide some explanatory capability to our deep learning model. Our novel deep mining model provides yet another arrow within the quiver of bioinformaticians for discovering and evaluating new biomarkers that may help further the endeavour of producing more effective and personalised medicine.
The application of the proposed feature mining models to the utilised omics datasets has led tothe fourth contribution of this research, which is discovering rel-evant, robust and reproducible biomarkers for breast cancer and the positivity of Estrogen and Progesterone receptors. The detected biomarkers are validated re-liably across a wide range of independently generated breast cancer data samples that are collected from completely different studies. The fundamental concepts of omics data, breast cancer, and understanding the role Estrogen Receptor and Progesterone Receptor play in this heterogeneous complex disease are detailing covered and discussed in Chapter 2.
In this thesis, the principle has been emphasised that the discovered molec-ular markers should meet the following criteria to act as true biomarkers, which are Predictivity, Stability, andGeneralisability. Predictivity is introduced to ex-amine the capability of the discovered biomarkers to separate patients in the cancer group from those in the control group with a good level of certainty. The lack of overlap among the published genes or proteins for identical diseases or clinical outcomes is essentially caused by the lack of robustness or stability of the selected genes across samples. Therefore, stability is utilised to investigate how the variations in the training data can affect the feature preferences of the proposed feature mining models, and to fight the sparsity of data points in a high-dimensional space. “If the same features are selected in multiple indepen-dent iterations, they more likely are reliable biomarkers” [100].
Generalisability is employed to test the potential of the proposed feature min-ing models to detect generic biomarkers from multiple independent datasets that are collected from completely different studies so that the highest evidence can be
provided. The research study [287] has hypothesised that“External validation us-ing data from a completely different study provides the highest irrefutable evidence that a tool validates”. From a large body of research that focuses on biomarkers discovery, few studies have adopted another independent dataset for validation purposes despite the availability of the data generated by TCGA program with high standard samples. That could explain why the number of clinically validated biomarkers is very few, despite the numerous proposals in the literature.
1.3
Thesis Outline
This thesis is structured as follows:
Chapter 2: Literature Review
This chapter provides the groundwork for informing how best to achieve the stated objectives by providing a summary of the key concepts and research direc-tions in the area of cancer biomarker discovery from omics data. It starts with an introduction to breast cancer and the fundamental types of data generated from omics technologies. Subsequently, this chapter provides a critical discussion of the current approaches to biomarker discovery found in the literature. Chapter
2 investigates the appropriateness of different experimental methodologies, vali-dation and evaluation metrics for verifying the outcomes of the feature mining models constructed using HDSSS data.
Chapter 3: Datasets and Experimental Methodology
This chapter explains the datasets used to perform omics data modelling and analysis and the experimental methodologies and evaluation metrics applied to estimate the robustness of the discovered biomarkers. The chapter starts by explaining the data pre-processing methods that are utilised for filtering out ge-nomic datasets from genes with unreliable measurements. Then, the sources of high quality HDSSS omics datasets for cancers of interest are illustrated with an emphasis on gaining the maximum benefit from these publically available datasets. In this project, 18 datasets have been utilised to examine the potential of the presented feature mining models to discover robust and generic knowledge.
The cancer datasets, evaluation metrics, and validation approaches used to anal-yse them are discussed in detail in this chapter.
Chapter 4: Evolutionary Mining Model
This chapter covers the design, implementation, and application of the ensem-ble evolutionary mining model proposed for biomarker identification from omics data. It starts with an introduction to why and how to solve the problem of biomarker discovery using optimisation methods. Subsequently, an overview to one of the most powerful optimisation methods, the Genetic Algorithm, is in-troduced. Thereafter, Chapter 4 discusses the experimental design of the evolu-tionary mining model, which integrates the Genetic Algorithm and the ensemble hybrid selection approach. Feasible choices for each step of the experimental de-sign are investigated and justified. The performance of the proposed evolutionary mining model is evaluated using the datasets and the experimental methodology mentioned in Chapter 3.
Chapter 5: Deep Mining Model
This chapter covers the design, implementation, and application of the deep min-ing model proposed for biomarker discovery from omics data. It provides an introduction to the fundamental components necessitated to develop an effective deep feature learning model that can exploit the unknown structure of omics data effectively. Consequently, the design steps of the deep mining model based on an unsupervised data-orientated approach is introduced to discover and inter-pret important signals from proteomic and genomic data. Furthermore, Chapter
5 discusses a new weight interpretation technique that is proposed to add ex-planatory power to our deep learning model, helping to alleviate one of the most challenging problems associated with the deep learning paradigm. The proposed deep mining model is evaluated using the datasets and experimental methodology introduced in Chapter 3.
Chapter 6: Biomarkers and Bioinformatics
The generic biomarkers for breast cancer discovered by our feature mining mod-els have been validated in terms of predictivity, stability, and generalisability
in Chapters 4 and 5. In this chapter, the clinical relevance of the discovered biomarkers will be evaluated with respect to current bioinformatics research into breast cancer. It is important to emphasise that, at the time of writing, there is no research that has found or examined the combination of these biomark-ers or some of them simultaneously. Furthermore, the association between each biomarker and the hormone receptors recognised in this PhD work is discussed to identify the type of existent relationship.
Chapter 7: Conclusion and Future Work
This thesis concludes with a discussion of the crucial challenges underlying the problem of inferring knowledge from HDSSS omics data, a summary of the con-tributions made to help alleviate these challenges and finally, potential future directions for this research and cancer biomarker discovery.
Literature Review
2.1
Introduction
Current computational models and tools for detecting breast cancer and un-derstanding the role Estrogen Receptor and Progesterone Receptor play in this heterogeneous disease are detailing reviewed in this chapter. A short overview of breast cancer, available omics data and the central dogma of molecular biology are first considered together with the challenges these pose for any data mining or computational model that may be used for biomarker discovery. Current state-of-the-art approaches for knowledge extraction are then subsequently reviewed along with strengths, limitations and challenges. An emphasis is made in this chapter on critical underlying issues of validating and evaluating the empirical results of biomarker discovery models proposed for HDSSS omics data. Increasing the awareness of the key research challenges allows for more efficacious solutions by understanding the required computational and statistical resources.
2.2
Breast Cancer
Breast cancer is the most common neoplasm in women and the second leading cause of cancer-related mortality in females worldwide [18]. Mammography is the standard tool that has been used for detecting breast cancer [114]. How-ever, several issues have been raised about this procedure including the risk of
false positives, over diagnosis of indolent disease, and lowering the sensitivity of recognising tumours in women with dense breast tissue [40,224,316]. Magnetic Resonance Imaging (MRI) offers a powerful alternative and provides excellent imaging even around dense breast tissue [26]. However, a high risk of obtaining false positives could lead to needless, stressful and expensive procedures [137]. Therefore, there is a critical necessity for measurement of molecular markers that could estimate the potential occurrence of a disease, and providing the probabil-ity of specific outcomes to the clinician for treatment stratification. Recognition of breast cancer at early stages can bring better prognosis with a 5-year survival rate of up to (90%), however, when breast cancer spreads to distant organs, this survival rate declines drastically to (20%) [90]. Detection at the early stages and monitoring breast cancer remain major challenges for healthcare profession-als. Moreover, the aetiology of breast cancer is still ambiguous, where breast cancer can differ significantly in regards to clinical, pathological, and biological properties.
Breast cancer begins when healthy cells change and grow out of control, form-ing a mass called a tumour. A tumour can be malignant or benign. A benign tumour means a tumour can grow but will not spread. A malignant tumour can grow and spread to other parts of the body. A malignant tumour has an abnor-mally high level of Estrogen Receptor and Progesterone Receptor in the nucleus. According to the website of National Cancer Institute (NCI)1, Estrogen Receptor is “a protein found inside the cells of the female reproductive tissue, some other types of tissue, and some cancer cells. The hormone estrogen will bind to the receptors inside the cells and may cause the cells to grow. Also called ER”. The NCI’s website2 defines Progesterone Receptor as follows: “A protein found inside
the cells of the female reproductive tissue, some other types of tissue, and some cancer cells. The hormone progesterone will bind to the receptors inside the cells and may cause the cells to grow. Also called PR”. Testing the tumour for Estrogen Receptor and Progesterone Receptor is a standard part of the initial evaluation of breast cancer diagnosis and treatment planning. The analysis of Estrogen and
1https://www.cancer.gov/publications/dictionaries/cancer-terms/def/estrogen-receptor
2
Progesterone Receptors by Immunohistochemistry (IHC) is considered currently the most commonly used method to test the tumour for both hormone receptors in cancer cells from a sample of tissue, which may come from a biopsy [97].
If breast cancer cells have high ER, the cancer is described as ER-positive (ER+), and if breast cancer cells have high PR, the disease is specified as PR-positive (PR+) cancer. ER and PR expressions have been utilised as robust indicators for the evaluation of breast cancer. All newly diagnosed invasive breast cancer patients and breast cancer recurrences should be examined for both ER and PR according to the recommendations of the American Society of Clinical Oncology and the College of American Pathologists [123]. According to cancer research UK, ∼37000 out of 50000 new cases are distinguished by the presence of ER. However, it has been shown that the expression of ER and PR receptors changes during the development of breast cancer and in response to systemic therapies [199].
For patients with ER+, particular treatments that block the activity of ER are recommended. ER activation plays a significant role in different biological processes like cell development and cell death [160]. The mechanism of blocking ER activity relies essentially on changing ER function in such a way that ER is becoming unable to regulate gene expression [259]. According to Carroll [46]
“Oestrogen Receptor (ER) is a transcription factor that regulates gene expression events that culminate in cell division”. Several expression profiling studies have illustrated that the expression of hormone receptors is linked with diverse genetic variations [231,267,268]. That means several mutated genes can affect the devel-opment and progression of breast cancer and contribute to its heterogeneity [29]. As a result, investigating molecular characteristics of the tumours that could act as risk factors of breast cancer is considered a serious aetiologic question [104]. This research project aims to identify mRNA markers from gene expression data that underlie the biological processes of ER and PR receptors.
With the advent of omics technologies, various biological molecules like genes, transcripts, proteins, metabolites, and other species have been provided. The next section provides an introduction to the central dogma of molecular biology and the fundamental types of data generated from omics technologies.
2.3
Omics Data
In 1957, a symposium of the Society for Experimental Biology in London pre-sented one of the fundamental ideas of molecular biology, which is called the
central dogma, and then it was published by Francis Crick in 1958 [61]. The concept of the central dogma of molecular biology specifies the transfer of genetic information within the biological system. This sequential process is shown in Figure 2.1 and involves the following processes: Replication, Transcription, Re-verse Transcription, and Translation. Replication (DNA to DNA): is the process of copying all of a cell’s DNA. Transcription (DNA to RNA) is the process, in which the DNA is transcribed to RNA, which carried the needed information to protein. Reverse Transcription (RNA to DNA): in this process, the RNA is reserved transcribed to DNA. Translation (RNA to protein): is the process in which the RNA is decoded to make a protein. Crick states that“once (sequential) information has passed into protein it cannot get out again” [121].
Different measurements provided by current technologies can be performed on and beyond distinct layers of the dogma to produce the so-called omics data, as shown in Figure 2.1. The fundamental aim of omics technologies is detecting genomics, transcriptomics, proteomics and metabolomics in a specific biological sample. Further to the role of omics technology in providing a great insight to the physiological system, they play a significant role in developing diagnosis and prognosis systems, investigating biomarkers at the molecular level, advance phar-macogenomics studies and expand our knowledge about the aetiology of complex diseases.
Omics fields can be grouped as follows [152]:
- Genomics is the systematic study of an organism’s genome. The genome can be defined as the complete set of genetic information (DNA sequence) of a cell or organism. Conventional methods have analysed genes inde-pendently, whilst recent microarray technology measures genetic variants between individuals and the expression of thousands of genes simultane-ously in order to reveal if any abnormality is associated with a trait [138]. The most popular differences in genetic information between humans are Single Nucleotide Polymorphisms (SNPs), where a SNP is a variation at a
Figure 2.1: The central dogma of molecular biology [121] and the types of omics data generated from each layer of dogma.
single DNA site [83]. Therefore, SNPs have been explored for detecting dis-eases with a genetic determination and in pharmacogenomics for assessing the efficacy of drug therapies.
- Transcriptomics is the study of the mRNA within a cell or organism. The transcriptome is the total mRNA transcripts that reflect the gene activity within the cell. Microarrays have been utilised in several areas of bioinfor-matics, and it is used in transcriptome to measure mRNA and summarises the actively expressed genes.
- Proteomics is the large-scale study of proteins, including their structure and function, within a cell or organism [289]. The proteome is the set of all expressed proteins in a cell or organism. Proteomics is another interesting area of research after genomics because it can provide more comprehension to the complex biological procedures due to its direct role in cell physiol-ogy. The proteome is considered a reflection of genomic and environmental factors. Therefore, it may hold a promising piece of knowledge, which can address different biological questions of interest [276]. However, a large number of proteins is produced.
- Metabolomics is the study of global metabolite profiles in a cell or organism [113]. The metabolome is the outcome of integrating the transcriptome and the proteome [296]. Thus, changes in the metabolome are related to changes in this product. The metabolome involves the smallest domain size
comparing with other omics data. Among different metabolite molecules, which are illustrated in Figure 2.1, the research interest has been focused recently on lipidomics due to their significant role in several diseases such as obesity, atherosclerosis, stroke, hypertension and diabetes [124].
High-throughput technologies allow thousands of variables to be examined simultaneously in a biological sample within a single experiment. Thus, it has the potential to detect key molecules that can answer the biological questions of interest so that new treatment strategies and drugs can be provided. The potential research directions for biomarker discovery using the state-of-the-art approaches proposed in the literature will be discussed in the next sections.
2.4
Statistical Techniques for Biomarker
Discov-ery
This section offers a brief introduction to traditional statistical methods applied in disease biomarker discovery studies. Conventional statistical techniques used to be the standard methods for the analysis of biomedical data such as hypothesis testing, correlation, regression, and clustering analysis. Statistical methods based on the univariate approach (e.g. [193]) assess the optimality of each variable in-dependently from the others assuming there is no interaction between them. The univariate analysis produces a list of features, sorted according to their discrim-inative power in separating the samples of different response groups. However, omics data analysis based on univariate tests can increase the risk of obtaining ‘spurious’ markers by misclassifying genes as differentially expressed when they are not. When a large number of genes is available, the risk of obtaining false positives is increased due to the challenge of multiple comparisons [228,270]. Al-though several procedures have been introduced in the literature to tackle the multiple comparisons problem such as the Benjamini-Hochberg [25,242], and the Bonferroni correction [263] as well as procedures in pattern mining established by [312,313], some issues have been raised about them [14]. In this research, finding robust biomarkers for cancers of interest is a discovery-based approach, and more information about hypothesis-based style can be found in [197].
On the other hand, the conceptual simplicity and the lower demands of uni-variate statistical techniques still attract researchers to utilise them as a pre-processing step to reduce the dimensionality of the data in preparation for more complex multivariate modelling or learning (e.g. [310]). Among a wide range of univariate statistical methods, t−test is widely utilised as a pre-processing step [183,262]. In genomic data, it has been shown that there is a non-trivial proportion of genes that have unequal group variances [72]. Thus, it is impor-tant to consider that the unequal variance t−test is more appropriate to find discriminative features than other hypothesis testing methods.
High-throughput omics data are multivariate, where the biological outcome is distributed in several biomarkers that need to be assessed simultaneously rather than independently. Statistical techniques based on multivariate approach (e.g. [181]) consider the effect of variables jointly rather than individually. Many successes in biology and medici