LNCS 8074, pp. 99-110. IFIP http://dx.doi.org/10.1007/978-3-642-40358-3_9
Linked Open Government Data Analytics
Evangelos Kalampokis1,2, Efthimios Tambouris1,2, Konstantinos Tarabanis1,2 1 Information Technologies Institute, Centre for Research & Technology - Hellas, Greece2 University of Macedonia, Thessaloniki, Greece
{ekal, tambouris, kat}@uom.gr
Abstract. Although the recently launched Open Government Data (OGD) movement promised to provide a number of benefits, recent studies have shown that its full potential has not yet realized. The difficulty in exploiting open data seems surprising if we consider the huge importance data have in modern societies. In this paper we claim that the real value of OGD will unveil from performing data analytics on top of combined statistical datasets that were previously closed in disparate sources and can now be linked to provide unexpected and unexplored insights. To support this claim, we describe the linked OGD analytics concept along with its technical requirements and demonstrate its end-user value employing a use case related to UK general elections. The use case revealed that there is a significant relationship between the probability one of the two main political parties (i.e. Labour Party and Conservative Party) to win in a UK constituency and the unemployment rate in the same constituency.
Keywords: Open government data; linked data; statistics; data analytics.
1 Introduction
Open data refers to data that “can be freely used, reused and redistributed by anyone” [1]. During the last years, an increasing number of governments and public authorities have started to open up their data. The so-called Open Government Data (OGD) movement has resulted in the launch of numerous OGD portals that aim at providing a single point of access for governmental data [2].
OGD have promised to provide a variety of benefits to society such as to increase government transparency and accountability, stimulate innovation, contribute to economic growth and improve administrative processes [3]-[4]. However, a recent empirical study concluded that a simplistic view is often adopted with regards to open data, which automatically correlates the publicizing of data with use and benefits [3]. In practice however, gaining access to raw data, placing it into a meaningful context, and extracting valuable information is extremely difficult. As a result, during the last couple of years different solutions have been developed to support the whole lifecycle of OGD reuse i.e. data discovery, cleaning, integration, browsing and visualization (e.g. [5]-[6]). However, despite the huge efforts that have been put into supporting both OGD publishing and consuming, the OGD movement has not yet realized its expected potential.
LNCS 8074, pp. 99-110. IFIP http://dx.doi.org/10.1007/978-3-642-40358-3_9 The difficulty in exploiting open data seems surprising if we consider the huge importance data have in modern societies. Indeed, during the last years, businesses, academia and government employ various data analytics methods on their own data with great success. For example, business intelligence methods are employed by enterprises to help them survive in the global economy [7]. In addition, evidence based policy-making relies on data analytics to assist policy makers in producing better policies [8]. Finally, academia employ data analytics to test hypotheses, understand patterns, predict future points, estimate hidden parameters etc. in various domains and problem areas [9].
We claim that the real value of OGD will unveil from performing data analytics on top of combined statistical datasets that were previously closed in disparate sources and can now be linked in order to provide unexpected and unexplored insights into different domains and problem areas.
For this purpose, we deem that the linked data paradigm must be first adopted for constructing the technical infrastructure that is essential for employing data analytics in a decentralized manner on the Web. The term linked data refers to “data published on the Web in such a way that it is machine-readable, its meaning is explicitly defined, it is linked to other external datasets, and can in turn be linked to from external datasets” [10]. Currently the most promising implementation of linked data is based on Semantic Web philosophy and technologies but in contrast to the full-fledged Semantic Web vision, it is mainly about publishing structured data in RDF using URIs rather than focusing on the ontological level or inferencing [11].
The objectives of this paper is to (a) introduce the concept of data analytics on top of distributed statistical linked OGD (b) describe the technical prerequisites that will enable the effective exploit of statistical OGD in data analytics and (c) demonstrate the end-user value of the linked OGD analytics approach based on a case study that is related to the general elections of the United Kingdom (UK) using data from data.gov.uk, the official UK’s OGD portal.
The remaining of the paper is organized as follows. In section 2 we describe the concept of data analytics based on open and linked government data. In section 3 we describe the technical prerequisites for realizing this vision. Section 4 presents the results of an analysis use case related to the UK general elections. Finally, in section 5 the related work is presented while in section 6 conclusions are drawn along with future work.
2 The concept of Linked Open Government Data Analytics
A big portion of Open Government Data (OGD) concerns statistics such as population figures, economic and social indicators. Major providers of statistics on the international level include Eurostat1, World Bank2, OECD3 and CIA’s World
1 http://epp.eurostat.ec.europa.eu/portal/page/portal/statistics/themes 2 http://data.worldbank.org
LNCS 8074, pp. 99-110. IFIP http://dx.doi.org/10.1007/978-3-642-40358-3_9 Factbook4. Moreover, public agencies at all administrative levels collect, produce and disseminate statistical data through their OGD portals. Accurate and reliable statistics provide the solid ground for developing models that could support academia to better understand the world and businesses to make better decisions. These models enable the identification of patterns, prediction of future points and estimation of hidden parameters.
The availability of accurate and reliable statistical OGD in formats that enable easy reuse and combination can provide new potentials to businesses, academia and governments. The combination of statistical OGD that refer to different domains and is published by different public authorities with other data (e.g. enterprise’s own data) could enable creating and evaluating models that were previously hard or even impossible to develop.
The potential of performing analytics on top of combined OGD and third party data could be summarized in the following user stories:
“As a business manager I want to be able to combine enterprise’s data with accurate and timeliness demographics, economic and social indicators in order to make better decision regarding business operations and strategies”. For instance, the correlation of product sales with economic and social indicators in various locations can reveal valuable information regarding consumer behaviour, hence supporting marketing or logistic departments.
“As a researcher I want to be able to combine statistical data from disparate sources and domains in order to empirically identify novel hypotheses or test existing ones with more data as well as to understand patterns, predict values and estimate hidden parameters”. For instance, developing models that integrate biodiversity information from a variety of datasets to assess biodiversity change, including remote sensing and in situ observations.
“As a policy maker I want to be able to combine statistical data regarding economic and social indicators in order to identify evidences regarding policy interventions and hence evaluate policies.” For instance, the correlation of data about education, unemployment and criminality in different geographical or administrative units and different time intervals could support or challenge existing policies.
However, putting together statistics in a meaningful manner so that to enable the creation of added value is usually a labour intensive task that introduces significant burdens to data users. It requires the manual discovery, collection, cleaning, transformation, integration, visualization and statistical analysis of data. The vision that we present in this paper suggests shifting this effort from the end-users to the data providers enabling this way the easier and wider reuse of statistical OGD in various problem areas. As a result, statistical OGD will be openly available for reuse in a way that will facilitate the performance of data analytics on top of combined open data and thus will enable the creation of useful information in an easy and cost effective manner.
For this purpose, the data should be provided in such a way that facilitates the whole lifecycle of statistical data reuse:
LNCS 8074, pp. 99-110. IFIP http://dx.doi.org/10.1007/978-3-642-40358-3_9 Data discovery: Metadata that describes statistical data should facilitate the effective and easy identification of datasets that could be combined for statistical analysis. This includes the identification of datasets that share common joint points (i.e. parliament constituencies, local authorities, schools etc.) and thus allow for further analysis. For instance, it is not feasible to correlate schools’ expenditures with hospitals’ inpatients because there are no joint points between them. In addition, it includes the identification of datasets that describe variables measured using similar categories of units e.g. continuous or discrete. Finally, the metadata should enable the identification of variables of a specific category or class.
Data cleaning: The statistical data should be of high quality i.e. timely, accurate and relevant.
Data linking: The data should be linked in order to enable analysis in different levels of granularity e.g. unemployment that refer to parliamentary constituencies’ level with criminality that refer to local authorities’ level. Data linking should also facilitate the disambiguation of entities, concepts, units, codes etc. that are described in the datasets.
Data visualization and statistical analysis: The data should enable easy visualization and statistical analysis. Towards this end, the provided data should facilitate the automatic identification and matching of the unit of measurement of the described variables. This will allow the automatic visualization and selection of the method to be used for the statistical analysis. For example, in the case of continuous units data analytics could be performed through linear regression analysis while in the case of discrete unit (i.e. categorical measures) through a classification analysis method such as logistic regression.
3 Technical Prerequisites
In order to realize the vision of linked open government data analytics as it was described in the previous section a number of technical prerequisite should be met.
The main assumption is that the statistical data is published as linked data in order to enable the combination of datasets that are published in disparate sources on the Web. This includes publishing the data following the linked data principles as well as establishing typed links at the instance and schema level. However, both the publishing and linking of the statistical data should be made in a statistically rigorous manner. Statistical data should be modelled as data cubes that describe data in a multi-dimensional fashion. Towards this end, the RDF data cube vocabulary can be employed [12]. This vocabulary is currently a W3C candidate recommendation for modelling multi-dimensional data, such as statistics, as RDF and thus adhering to the linked data principles. Although more vocabularies have been proposed in the area (e.g. the Open Cube vocabulary [13]), RDF data cube is the most popular and stable one.
Data cubes are characterised by their dimensions, their measures and possibly by additional attributes. The dimensions in the cube define what each observation is about. For instance, a cube related to unemployment might have the following
LNCS 8074, pp. 99-110. IFIP http://dx.doi.org/10.1007/978-3-642-40358-3_9 dimensions: location, time period, gender and age group. An individual observation refers to a unique value along each of these dimensions. In the unemployment example, a single observation would define the unemployment rate of women (gender) between 22 and 30 years old (age group) that live in Kensington (location) for the first six months of 2009 (time period). The possible values for each dimension are taken from a code list. A code list is a controlled vocabulary such as a list of constituencies in the UK or possible age groups. The measure defines what kind of quantity is being measured e.g. the unemployment rate. An observation could also have attached attributes, which facilitate the interpretation of the observation value e.g. the unemployment rate is measured as percentage and is an estimation of the Ministry of Labour.
Moreover, the data that has been modelled based on data cubes should be also connected through typed links (e.g. owl:sameAs property) at the instance level in the following joint points:
• Dimensions definitions: This will enable the identification of datasets that share at least two common dimensions and thus can be considered for comparative statistical analysis and visualization. Only datasets that share at least two common dimensions can be considered for analysis.
• The values of dimensions: This will enable the matching of observations that refer to the same values of the dimensions. For instance, the identification of the unemployment rate and the number of crimes that refer to the same parliament constituency e.g. Kensington.
• The categories of measures: This will enable the identification of measures of the same category and the analysis of variables that are linked to a number of different measures. Relevant measures should be categorized under a predefined set of categories enabling users to identify measures relevant to the research or business question.
In addition, well known statistical concept schemes, code lists and classifications should be employed in order to enable maximum reusability.
The representation of data as RDF cubes will enable the linking of data published in disparate sources and thus facilitating statistical data reuse and combination for performing data analytics.
However, we should also note the current version of the RDF data cube vocabulary does not enable the aggregation of data from different granularity levels along a dimension hierarchy and thus doesn’t facilitate the comparative analysis of this type of data.
In summary, the proposed open government data (OGD) analytics framework capitalizes on linked data principles and thus assumes data is published as linked data and meets a set of technical prerequisites. Clearly, this assumption is not yet true for all OGD initiatives. However, it is true that from all different technologies approaches for OGD, linked data seems the most promising and fast adopting [2]. Actually, in UK data.gov.uk was one of the first OGD portals providing data following the linked data principles [14]. In fact, we believe that our framework might act as a catalyst for further speeding the adoption of linked data paradigm.
LNCS 8074, pp. 99-110. IFIP http://dx.doi.org/10.1007/978-3-642-40358-3_9
4 The UK Elections Case
In this section we employ the use case of general elections in the United Kingdom (UK) in order to demonstrate the end-user value of the proposed linked open government data analytics approach. In particular, our aim is to demonstrate how one can gain insights about UK elections from available Open Government Data (OGD) that is published on data.gov.uk. Towards this end, we use as a starting point open data regarding the outcome of two UK general elections from 2005 and 2010. In particular we employ datasets that are published on Guardian’s web site under an open license regarding the elections’ results. In particular, these datasets contain the final results of all participating political parties in the country but also results of the main parties per parliamentary constituency along with the winning party per constituency. These datasets from Guardian’s web sites were published as spreadsheets.
As it was described in the previous sections, in order to be able to perform data analytics on top of combined datasets we need to identify datasets that share the same dimensions. In the elections case, we need to identify datasets with statistics on data.gov.uk that describe data in the parliament constituency level. Towards this end, we searched and collected datasets regarding two categories, namely unemployment and poverty. For the former we have identified two datasets describing the unemployment and employment rate while for the latter two datasets describing the proportion of children in poverty and the families receiving child benefits. We identified datasets in different time periods from 2005 until 2010. These datasets was published on data.gov.uk as spreadsheets.
Before we proceed with the actual analysis, the data goes through a data conditioning phase in which all the datasets from both data.gov.uk and Guardian are being published following the linked data principles and based on the technical requirements that we have specified before.
We have created an RDF data cube for each measure. For instance, one cube has unemployment rate as measure and year and parliament constituencies as dimensions while another one has the percentage of children in poverty as measure and the same dimensions. We have also published the elections datasets as linked data and according to the same requirements. In this case we have as a measure the number of votes and as dimensions the years, parliament constituencies and political parties. We have also created a cube that describes the winning party as measure and parliament constituencies and year as dimensions. In order to disambiguate the dimensions we have created typed links between our datasets and DBpedia, the linked data version of Wikipedia. We have used owl:sameAs links in order to denote that an entity described in our dataset is the same as the corresponding entity in DBpedia. In this way, it becomes possible to disambiguate entity instances.
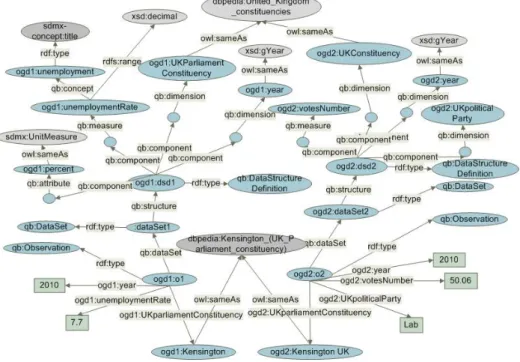
Two types of links are being established. The first one refers to the dimensions level while the second one to the observation level. Figure 1 presents the structure of a small part of the RDF data representing the data cubes along with the links among them. In particular, it describes the data structure definition of the unemployment rate and the election results cubes along with one observation per cube. It also presents the
LNCS 8074, pp. 99-110. IFIP http://dx.doi.org/10.1007/978-3-642-40358-3_9 links that have been established between the two cubes. At the dimension level the graph denotes that one of the dimensions in both cubes is same as the dbpedia:United_Kingdom_constituencies entity while at the observation level that one observation in both cubes refers to an entity that is same as the dbpedia:Kensington_(UK_Parliament_constituency) entity.
The final task is to annotate the described measure with a set of categories. In our case the elections datasets could be categorized under elections while the data.gov.uk datasets are being published based a predefined set of categories from the Office of National Statistics.
Fig. 1. A part of the RDF graph that presents two data structure definitions of two cubes along with two observations and the respective links between them.
The data conditioning process gets the data into a state where data analytics can be performed in a transparent and easy manner. Initially, data that is related to elections can be discovered based on the category annotation. In our case scenario, two datasets that describe the number of votes and the winning party are discovered. Thereafter, datasets that share at least one dimension with the elections dataset are identified through the typed links that have been established to other datasets. In our case these datasets describe unemployment and poverty.
In addition, the datasets describe that the measures has been computed in either continuous (i.e. number of votes) or discrete (i.e. winning party) units. So, the way of visualizing the data or even the statistical analysis method to be followed can be emerged from the unit that characterizes the measure. For example, in the case of continuous units data analytics could be performed through linear regression analysis
LNCS 8074, pp. 99-110. IFIP http://dx.doi.org/10.1007/978-3-642-40358-3_9 while in the case of discrete unit (i.e. categorical measures) through a classification analysis method such as logistic regression. Logistic regression measures the relationship between a categorical dependent variable and one or more continuous independent variables, by converting the dependent variable to probability scores through the logistic function:
€
P(
A)
=
1
1
+
e
−yFor example, in the elections case the logistic function could correlate the unemployment rate of a parliament constituency to the probability P(A) a particular political party to win the elections in the same constituency. On the other hand, the linear regression would correlate the unemployment rate of a parliament constituency to the number of votes that a specific political party received in the same constituency.
In our case we assume that the elections related dataset that includes a continuous measure is analyzed based on a linear regression while the one that includes a discrete measure based on logistic regression. The analysis can be also combined with a comparative visualization depending on the selected analysis method. The comparative visualization enables the easy understanding of the data analytics results and facilitates their interpretation.
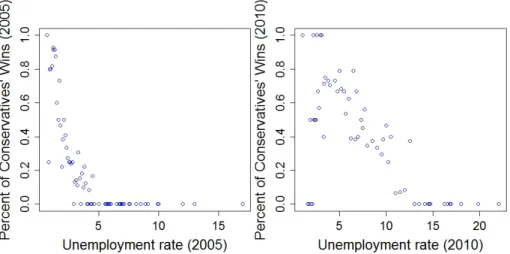
In Figures 2 and 3 the visualizations of linked open government data analytics are depicted. These figures visualize logistic regression analyses for the winners per constituency datasets in relation to the unemployment rate per constituency datasets for two consecutive UK elections in 2005 and 2010. In particular, the visualizations depict the percent of constituencies of a particular unemployment rate in which a party has won the elections. For example, in Figure 2 in the diagram that refers to the 2005 elections we see that the conservatives did not win in any parliament constituency with ten percent (10%) unemployment rate.
In addition, as the same figure indicates for parliament constituencies with more than five percent (5%) unemployment rate the Conservative Party has very small probability to win. However, in the same Figure and in the diagram that refers to the 2010 elections the unemployment rate above of which the Conservative party has very small probability to win goes up to thirteen percent (13%).
These visualizations enable users to evaluate the performed analyses and thus to understand the correlation between measures described in different datasets. As Figures 2 and 3 suggest there is a significant relationship between the probability one of the two main UK parties (i.e. Labour party and Conservatives) to win in a parliament constituency and the unemployment rate in the same parliament constituency. It is notable that the same patterns holds for the two consecutive elections. The Conservative Party seems to win in areas that are characterized by small unemployment rate while the Labour Party in areas with high unemployment rate. Here we should note that the average unemployment rate in 2005 was 3.35 percent while in 2010 7.5 percent. This difference in the average unemployment rate between 2005 and 2010 could explain the moving of the data points and the data pattern to the right in the case of the unemployment measure. Finally, we should note
LNCS 8074, pp. 99-110. IFIP http://dx.doi.org/10.1007/978-3-642-40358-3_9 that other connections that could have been produced by visualizing or correlating other measures (e.g. poverty) are not presented in this paper for shortness.
The identified patterns as presented through visualization could be valuable for supporting decision-making. For example, political parties and candidates could intensify their campaigns in areas that the analytics predict negative results.
Fig. 2. The correlation of Conservatives’ wins and Unemployment using the unemployment datasets for the general elections of 2005 and 2010.
Fig. 3. The correlation of Labours’ wins and Unemployment using the unemployemnt datasets for the general elections of 2005 and 2010
LNCS 8074, pp. 99-110. IFIP http://dx.doi.org/10.1007/978-3-642-40358-3_9 The presented approach also enables the creation of a statistical model out of the identified datasets. This can be used as a predictive model for estimating a future value of the dependent variable. For example, in our case one could create a model in order to estimate who will be the winner of a particular constituency in the future based on the unemployment rate at that time. Towards this end, we used R statistical package and we computed the coefficients of a logistic function. In particular, the model that correlates the probability P(A) the Labour party to win in a specific parliament constituency as a linear function of the unemployment rate of 2010 in the same parliament constituency using the logistic function is as follows:
where
€
y
=
−
3.823
+
0.437
×
x
and x is the unemployment rate of the constituency. So for example, in constituencies with 12 percent unemployment rate the y variable is y=1.421 and the probability P(A)=0.8.
Therefore, based on this naïve prediction model and using a dataset that includes an estimation of the unemployment for 2015 we could also produce a prediction about the winning party in a particular constituency.
The UK elections case could also demonstrate the applicability of the linked open government analytics approach into a business setting where enterprise’s own data could be combined with OGD. In this case the election results could have been replaced by product sales related data enabling this way the better understanding of an enterprise’s sales.
4 Related Work
In the linked data community a few recent research endeavours worked on demonstrating the potential of linked statistical data. Towards this end, they showed how using linked data principles in statistical data for decision support services bears advantages such as easier integration and enrichment with other data sources [15]-[16]. They suggested that linking statistical data to the Linked Data Web could enable the enrichment of a particular dataset and thus the extraction of interesting and previously hidden insights related to particular events.
In particular, van Hage et al. [17] created linked data from piracy reports and employed statistical analysis to classify the events based on the weapons used. They also performed statistics on top of linked data in order to answer questions such as “what are the most active areas”, “what are the differences in ships attacked in different regions” etc.
In addition, Paulheim [18] employed datasets that are published on the Linked Data Web in order to enrich statistical data with attributes e.g. from DBpedia. He showed through a prototype that these attributes could generate new hypotheses. This
LNCS 8074, pp. 99-110. IFIP http://dx.doi.org/10.1007/978-3-642-40358-3_9 approach was implemented through a prototype and analyzed the perceived quality of these hypotheses in a case study.
However, the proposed in this paper linked open government data analytics approach describes the value and the prerequisites of combining disparate statistical datasets that could enable the identification of unexpected and unexplored insights into different domains and problems areas.
Similarly to OGD, open data is also created and disseminated through Social Media such as Twitter, Facebook, blogs and forums. This data differs from OGD because it mainly expresses subjective opinions and thoughts. Social media data has been used as a primary source for the creation of predictive analytics models regarding various phenomena such as elections, stock market and product sales. An analysis of 52 relevant empirical studies concluded that social media data should go through a data conditioning process, which is similar to the one that we have presented in the proposed linked open government data analytics approach [19]. The same study revealed that this kind of open data could be successfully used for the development of predictive models in various problem areas.
5 Conclusions and Future Work
During the last years the Open Government Data (OGD) movement has been
introduced evangelizing the need to open up governments and public authorities data for everyone to reuse. The OGD movement promised that open data would increase government transparency and accountability, stimulate innovation, contribute to economic growth and improve administrative processes. However, recent studies have shown that the full potential of OGD has not yet realized, despite the significant efforts put into developing tools and application facilitating open data publishing and consumption.
Today, data that are closed into isolated systems are fed in data analytics methods and tools to provide valuable information to businesses, governments and academia. In this paper we claimed that the real value of OGD will emerge from performing data analytics on top of combined statistical datasets that were previously closed in disparate sources and can now be linked to provide unexpected and unexplored insights into different domains and problem areas. To support this claim, in this paper we describe the linked open government data analytics vision along with its technical requirements as well as we demonstrate its applicability and value using a use case related to UK general elections. The case revealed that there is a strong correlation between the unemployment rate in a constituency and the possibility one of the two main political parties (i.e. Conservatives and Labour party) to win the elections in the constituency.
Future work includes the development of a platform that will enable the semi-automatic identification of important relations between variables that are described in datasets published as open data by different sources or even with variables that resides in enterprise’s own data and thus also demonstrate the value of the proposed framework in business settings.
LNCS 8074, pp. 99-110. IFIP http://dx.doi.org/10.1007/978-3-642-40358-3_9
Acknowledgments
The work presented in the paper is partly funded by the EU Grant No.288136 eGovPoliNet - Building a global multidisciplinary digital governance and policy modelling research and practice community.
References
1. Open Knowledge Foundation: The Open Data Handbook (2012), http://opendatahandbook.org
2. Kalampokis, E., Tambouris, E., Tarabanis, K.: A Classification Scheme for Open Government Data: Towards Linking Decentralized Data. International Journal of Web Engineering and Technology, 6(3), 266-285 (2011)
3. Janssen, M., Charalabidis, Y., Zuiderwijk, A.: Benefits, Adoption Barriers and Myths of Open Data and Open Government. Information Systems Management, 29(4), 258-268 (2012)
4. Tammisto, Y. and Lindman, J.: Definition of Open Data Services in Software Business. In M.A. Cusumano, B. Iyer and N. Venkatraman (Eds.): ICSOB 2012. LNBIP vol. 114, pp. 297-303. Springer (2012)
5. Böhm, C., Naumann, F., Freitag, M. George, S., Höfler, N., Köppelmann, M., Lehmann, C., Mascher, A. and Schmidt, T.: Linking Open Government Data: What Journalists Wish They Had Known. In: 6th International Conference on Semantic Systems, No. 34. ACM,
New York (2010)
6. Shadbolt, N., O’Hara, K., Berners-Lee, T., Gibbins, N., Glaser, H., Hall, W. and m.c. schraefel: Linked Open Government Data: Lessons from Data.gov.uk. IEEE Intelligent Systems, 27(3), 16-24 (2012)
7. Jourdan, Z., Rainer, R.K. and Marshall, T.E.: Business Intelligence: An Analysis of the Literature. Information Systems Management, 25(2), 121-131 (2008)
8. Davies, H. T. O., Nutley, S. M. and Smith, P. C. (Eds) (2000). What works? Evidence-based Policy and Practice in Public Services, UK.
9. Scott, P. Kollman, K. and Miller, J. (eds). Computational Models of Political Economy. MIT Press, 2002.
10. Bizer, C., Heath, T. and Berners-Lee, T.: Linked data - the story so far. International Journal on Semantic Web and Information Systems, 5(3), 1-22 (2009)
11. Hausenblas, M.: Exploiting linked data to build web applications. IEEE Internet Computing, 13(4), 68-73 (2009)
12. W3C (2013). The RDF Data Cube Vocabulary. W3C Working Draft, http://www.w3.org/TR/vocab-data-cube/
13. Etcheverry L. and Vaisman A. A. (2012). Enhancing OLAP Analysis with Web Cubes. In ESWC 2012, pages 53–62.
14. Sheridan, J. and Tennison, J.: Linking UK government data. In: WWW Workshop on Linked Data on the Web. (2010)
15. Cyganiak, R., Hausenblas, M. and McCuirc, E. (2011). Official Statistics and the Practice of Data Fidelity. D. Wood (ed.), Linking Government Data, pp. 135-151, Springer. 16. Kampgen, B.: DC Proposal: Online Analytical Processing of Statistical Linked Data. In:
LNCS 8074, pp. 99-110. IFIP http://dx.doi.org/10.1007/978-3-642-40358-3_9
17. van Huge, W.R. and van Erp, M.: Linked Open Piracy: A Story about e-Science, Linked Data and Statistics. Journal on Data Semantics, 1(3), 187-201 (2012)
18. Paulheim, H.: Generating Possible Interpretations for Statistics from Linked Open Data. In: Simperl E. et al. (eds.) ESWC 2012. LNCS, vol. 7295, pp. 560-574, Springer, Heidelberg (2012)
19. Kalampokis, E., Tambouris, E., Tarabanis, K.: Understanding the Predictive Power of Social Media. Internet Research [in press] (2013)