Detecting Algorithimically Generated Malicious Domain
Names
Sandeep Yadav, Ashwath K.K. Reddy,
and A.L. Narasimha Reddy
Department of Electrical and ComputerEngineering Texas A&M University College Station, TX 77843, USA
[email protected],
[email protected],
[email protected]
Supranamaya Ranjan
Narus Inc. Sunnyvale, CA 94085, USA[email protected]
ABSTRACT
Recent Botnets such as Conficker, Kraken and Torpig have used DNS based “domain fluxing” for command-and-control, where each Bot queries for existence of a series of domain names and the owner has to register only one such domain name. In this paper, we develop a methodology to detect such “domain fluxes” in DNS traffic by looking for patterns inherent to domain names that are generated algorithmi-cally, in contrast to those generated by humans. In partic-ular, we look at distribution of alphanumeric characters as well as bigrams in all domains that are mapped to the same set of IP-addresses. We present and compare the perfor-mance of several distance metrics, including KL-distance, Edit distance and Jaccard measure. We train by using a good data set of domains obtained via a crawl of domains mapped to all IPv4 address space and modeling bad data sets based on behaviors seen so far and expected. We also apply our methodology to packet traces collected at a Tier-1 ISP and show we can automatically detect domain fluxing as used by Conficker botnet with minimal false positives.
Categories and Subject Descriptors
C.2.0 [Computer-Communication Networks]: Security and protection; K.6.5 [Management of Computing and Information Systems]: Security and Protection
General Terms
Security, Verification
Keywords
Components, Domain names, Entropy, Malicious
Permission to make digital or hard copies of all or part of this work for personal or classroom use is granted without fee provided that copies are not made or distributed for profit or commercial advantage and that copies bear this notice and the full citation on the first page. To copy otherwise, to republish, to post on servers or to redistribute to lists, requires prior specific permission and/or a fee.
IMC’10, November 1–3, 2010, Melbourne, Australia.
Copyright 2010 ACM 978-1-4503-0057-5/10/11 ...$10.00.
1.
INTRODUCTION
Recent botnets such as Conficker, Kraken and Torpig have brought in vogue a new method for botnet operators to con-trol their bots: DNS “domain fluxing”. In this method, each bot algorithmically generates a large set of domain names and queries each of them until one of them is resolved and then the bot contacts the corresponding IP-address obtained that is typically used to host the command-and-control (C&C) server. Besides for command-and-control, spammers also routinely generate random domain names in order to avoid detection. For instance, spammers advertise randomly gen-erated domain names in their spam emails to avoid detection by regular expression based domain blacklists that maintain signatures for recently ‘spamvertised’ domain names.
The botnets that have used random domain name gener-ation vary widely in the random word genergener-ation algorithm as well as the way it is seeded. For instance, Conficker-A [28] bots generate 250 domains every three hours while us-ing the current date and time at UTC as the seed, which in turn is obtained by sending empty HTTP GET queries to a few legitimate sites such as google.com, baidu.com, answers.com, etc. This way, all bots would generate the same domain names every day. In order to make it harder for a security vendor to pre-register the domain names, the next version, Conficker-C [29] increased the number of ran-domly generated domain names per bot to 50K. Torpig [31, 6] bots employ an interesting trick where the seed for the random string generator is based on one of the most pop-ular trending topics in Twitter. Kraken employs a much more sophisticated random word generator and constructs English-language alike words with properly matched vowels and consonants. Moreover, the randomly generated word is combined with a suffix chosen randomly from a pool of common English nouns, verbs, adjective and adverb suffixes, such as -able, -dom, -hood, -ment, -ship, or -ly.
From the point of view of botnet owner, the economics work out quite well. They only have to register one or a few domains out of the several domains that each bot would query every day. Whereas, security vendors would have to pre-register all the domains that a bot queries every day, even before the botnet owner registers them. In all the cases above, the security vendors had to reverse engineer the bot executable to derive the exact algorithm being used for gen-erating domain names. In some cases, their algorithm would
predict domains successfully until the botnet owner would patch all his bots with a repurposed executable with a dif-ferent domain generation algorithm [31].
We argue that reverse engineering of botnet executables is resource- and time-intensive and precious time may be lost before the domain generation algorithm is cracked and consequently before such domain name queries generated by bots are detected. In this regards, we raise the follow-ing question:can we detect algorithmically generated domain names while monitoring DNS traffic even when a reverse en-gineered domain generation algorithm may not be available? Hence, we propose a methodology that analyzes DNS traf-fic to detectifandwhendomain names are being generated algorithmically as a line of first defense. In this regards, our proposed methodology can point to the presence of bots within a network and the network administrator can dis-connect bots from their C&C server by filtering out DNS queries to such algorithmically generated domain names.
Our proposed methodology is based on the following ob-servation: current botnets do not use well formed and pro-nounceable language words since the likelihood that such a word is already registered at a domain registrar is very high; which could be self-defeating as the botnet owner would then not be able to control his bots. In turn this means that such algorithmically generated domain names can be expected to exhibit characteristics vastly different from legit-imate domain names. Hence, we develop metrics using tech-niques from signal detection theory and statistical learning which can detect algorithmically generated domain names that may be generated via a myriad of techniques: (i) those generated via pseudo-random string generation algorithms as well as (ii) dictionary-based generators, for instance the one used by Kraken[5, 3, 4] as well as a publicly available tool, Kwyjibo [12] which can generate words that are pro-nounceable yet not in the english dictionary.
Our method of detection comprises of two parts. First, we propose several ways to group together DNS queries: (i) either by the Top Level Domain (TLD) they all correspond to or; (ii) the IP-address that they are mapped to or; (iii) the connected component that they belong to, as determined via connected component analysis of the IP-domain bipar-tite graph. Second, for each such group, we compute metrics that characterize the distribution of the alphanumeric char-acters or bigrams (two consecutive alphanumeric charchar-acters) within the set of domain names. Specifically, we propose the following metrics to quickly differentiate a set of legitimate domain names from malicious ones: (i) Information entropy of the distribution of alphanumerics (unigrams and bigrams) within a group of domains; (ii) Jaccard index to compare the set of bigrams between a malicious domain name with good domains and; (iii) Edit-distance which measures the number of character changes needed to convert one domain name to another.
We apply our methodology to a variety of data sets. First, we obtain a set of legitimate domain names via reverse DNS crawl of the entire IPv4 address space. Next, we obtain a set of malicious domain names as generated by Conficker, Kraken and Torpig as well as model a much more sophis-ticated domain name generation algorithm: Kwyjibo [12]. Finally, we apply our methodology to one day of network traffic from one of the largest Tier-1 ISPs in Asia and show how we can detect Conficker as well as a botnet hitherto unknown, which we callMjuyh(details in Section 5).
Our extensive experiments allow us to characterize the ef-fectiveness of each metric in detecting algorithmically gener-ated domain names in different attack scenarios. We model different attack intensities as number of domain names that an algorithm generates. For instance, in the extreme sce-nario that a botnet generates 50 domains mapped to the same TLD, we show that KL-divergence over unigrams achieves 100% detection accuracy albeit at 15% false positive rate (le-gitimate domain groups classified as algorithmic). We show how our detection improves significantly with much lower false positives as the number of words generated per TLD increases, e.g., when 200 domains are generated per TLD, then Edit distance achieves 100% detection accuracy with 8% false positives and when 500 domains are generated per TLD, Jaccard Index achieves 100% detection with 0% false positives.
Finally, our methodology of grouping together domains via connected components allows us to detect not only “do-main fluxing” but also if it was used in combination with “IP fluxing”. Moreover, computing the metrics over compo-nents yields better and faster detection than other grouping methods. Intuitively, even if botnets were to generate ran-dom words and combine them with multiple TLDs in order to spread the domain names thus generated (potentially to evade detection), as long as they map these domains such that at least one IP-address is shared in common, then they are revealing a group structure that can be exploited by our methodology for quick detection. We show that per-component analysis detects 26.32% more IP addresses than using per-IP analysis and 16.13% more hostnames than us-ing per-domain analysis when we applied our methodology to detect Conficker in a Tier-1 ISP trace.
The rest of this paper is organized as follows. In Section 3 we present our detection methodology and introduce the metrics we have developed. In Section 4 we present our connected component algorithm. In Section 5 we present results to compare each metric as applied to different data sets and trace data. In Section 2 we compare our work against related literature and in Section 7 we conclude.
2.
RELATED WORK
Characteristics, such as IP addresses, whois records and lexical features of phishing and non-phishing URLs have been analyzed by McGrath and Gupta [23]. They observed that the different URLs exhibited different alphabet distri-butions. Our work builds on this earlier work and devel-ops techniques for identifying domains employing algorith-mically generated names, potentially for “domain fluxing”. Ma, et al [17], employ statistical learning techniques based on lexical features (length of domain names, host names, number of dots in the URL etc.) and other features of URLs to automatically determine if a URL is malicious,i.e., used for phishing or advertising spam. While they classify each URL independently, our work is focused on classifying a group of URLs as algorithmically generated or not, solely by making use of the set of alphanumeric characters used. In addition, we experimentally compare against their lexi-cal features in Section 5 and show that our alphanumeric distribution based features can detect algorithmically gen-erated domain names with lower false positives than lexical features. Overall, we consider our work as complimentary and synergistic to the approach in [17].
where the botnet owner constantly keeps changing the IP-addresses mapped to a C&C server, [25] implements a de-tection mechanism based on passive DNS traffic analysis. In our work, we present a methodology to detect cases where botnet owners may use a combination of both domain flux-ing with IP fluxflux-ing, by havflux-ing bots query a series of domain names and at the same time map a few of those domain names to an evolving set of IP-addresses. Also earlier pa-pers [24, 20] have analyzed the inner-working of IP fast flux networks for hiding spam and scam infrastructure. With regards to botnet detection, [14, 15] perform correlation of network activity in time and space at campus network edges, and Xie et al in [34] focus on detecting spamming botnets by developing regular expression based signatures from a dataset of spam URLs .
We find that graph analysis of IP addresses and domain names embedded in DNS queries and replies reveal inter-esting macro relationships between different entities and en-able identification of bot networks (Conficker) that seemed to span many domains and TLDs. With reference to graph based analysis, [35] utilizes rapid changes in user-bot graphs structure to detect botnet accounts.
Statistical and learning techniques have been employed by various studies for prediction [10, 26, 13]. We employed results from detection theory in designing our strategies for classification [32, 11].
Several studies have looked at understanding and reverse-engineering the inner workings of botnets [5, 3, 4, 16, 31, 27, 30]. Botlab has carried out an extensive analysis of several bot networks through active participation [19] and provided us with many example datasets for malicious domains.
3.
DETECTION METRICS
In this section, we present our detection methodology that is based on computing the distribution of alphanumeric char-acters for groups of domains. First, we motivate our metrics by showing how algorithmically generated domain names differ from legitimate ones in terms of distribution of al-phanumeric characters. Next, we present our three metrics, namely Kullback-Leibler (KL) distance, Jaccard Index (JI) measure and Edit distance. Finally, in Section 4 we present the methodology to group domain names.
3.1
Data Sets
We first describe the data sets and how we obtained them: (i) Non-malicious ISP Dataset: We use network traf-fic trace collected from across 100+ router links at a Tier-1 ISP in Asia. The trace is one day long and provides details of DNS requests and corresponding replies. There are about 270,000 DNS name server replies. (ii) Non-malicious DNS Dataset: We performed a reverse DNS crawl of the entire IPv4 address space to obtain a list of do-main names and their corresponding IP-addresses. We fur-ther divided this data set in to several parts, each comprising of domains which had 500, 200, 100 and 50 domain labels. The DNS Dataset is considered as non-malicious for the fol-lowing reasons. Botnets may own only a limited number of IP addresses. Considering that a DNS PTR request maps an IP address to only one domain name, the dataset thus ob-tained will contain very few malicious domain names per an-alyzed group. In the event that the bots exhibit IP fluxing, it is noteworthy that the botnet owners cannot change the PTR DNS mapping for IP addresses not owned. Although,
the malicious name servers may point to any IP address. (iii)Malicious datasets: We obtained the list of domain names that were known to have been generated by recent Botnets: Conficker [28, 29], Torpig [31] and Kraken [5, 3]. As described earlier in the Introduction, Kraken exhibits the most sophisticated domain generator by carefully matching the frequency of occurrence of vowels and consonants as well as concatenating the resulting word with common suffixes in the end such as -able, -dom,etc. (iv)Kwyjibo: We model a much more sophisticated algorithmic domain name gener-ation algorithm by using a publicly available tool, Kwyjibo [12] which generates domain names that are pronounceable yet not in the English language dictionary and hence much more likely to be available for registration at a domain reg-istrar. The algorithm uses a syllable generator, where they first learn the frequency of one syllable following another in words in English dictionary and then automatically generate pronounceable words by modeling it as a Markov process.
3.2
Motivation
Our detection methodology is based on the observation that algorithmically generated domains differ significantly from legitimate (human) generated ones in terms of the dis-tribution of alphanumeric characters. Figure 1(a) shows the distribution of alphanumeric characters, defined as the set of English alphabets (a-z) and digits (0-9) for both legitimate as well as malicious domains1. We derive the following
points: (i) First, note that both the non-malicious data sets exhibit a non-uniform frequency distribution, e.g., letters ‘m’ and ‘o’ appear most frequently in the non-malicious ISP data set whereas the letter ‘s’ appears most frequently in the non-malicious DNS data set. (ii) Even the most so-phisticated algorithmic domain generator seen in the wild for Kraken botnet has a fairly uniform distribution, albeit with higher frequencies at the vowels: ‘a’, ‘e’ and ‘i’. (iii) If botnets of future were to evolve and construct words that are pronounceable yet not in the dictionary, then they would not exhibit a uniform distribution as expected. For instance, Kwyjibo exhibits higher frequencies at alphabets, ‘e’, ‘g’, ‘i’, ‘l’, ‘n’, etc. In this regards, techniques that are based on only the distribution of unigrams (single alphanumeric char-acters) may not be sufficient, as we will show through the rest of this section.
The terminology used in this and the following sections is as follows. For a hostname such asphysics.university.edu, we refer touniversity as the second-level domain label,edu as the first-level domain, anduniversity.eduas the second-level domain. Similarly, physics.university.edu is referred to as the third-level domain andphysicsis the third-level domain label. The ccTLDs such asco.uk are effectively considered as first-level domains.
3.3
Metrics for anomaly detection
The K-L(Kullback-Leibler) divergence metric is a non-symmetric measure of ”distance“ between two probability distributions. The divergence (or distance) between two dis-cretized distributions P and Q is given by: DKL(P||Q) =
Pn
i=1P(i)log
P(i)
Q(i).
where n is the number of possible values for a discrete random variable. The probability distributionP represents
91Even though domain names may contain characters such as ‘-’, we currently limit our study to alphanumeric characters only.
0 0.02 0.04 0.06 0.08 0.1 0.12 0.14 0 1 2 3 4 5 6 7 8 9 a b c d e f g h i j k l m n o p q r s t u v w x y z Probability of occurrence Alphanumeric characters Non-malicious(ISP dataset) Non-malicious (DNS dataset) Malicious (randomly generated)
(a) Non-malicious and malicious domains.
0 0.02 0.04 0.06 0.08 0.1 0.12 0 1 2 3 4 5 6 7 8 9 a b c d e f g h i j k l m n o p q r s t u v w x y z Probability of occurrence Alphanumeric characters Malicious (Kraken) Malicious (Kwyjibo) Malicious (randomly generated)
(b) Only malicious entities
Figure 1: Probability distributions of malicious and non-malicious domains
the test distribution and the distributionQ represents the base distribution from which the metric is computed.
Since the K-L measure is asymmetric, we use a symmetric form of the metric, which helps us deal with the possibility of singular probabilities in either distribution. The modified K-L metric is computed using the formula: Dsym(P Q) =
1
2(DKL(P||Q) +DKL(Q||P)).
Given a test distributionq computed for the domain to be tested, and non-malicious and malicious probability dis-tribution over the alphanumerics as g and b respectively, we characterize the distribution as malicious or not via the following optimal classifier (for proof see appendix):
Dsym(qb)−Dsym(qg) g ≷
b
0 (1)
For the test distributionq to be classified as non-malicious, we expect Dsym(qg) to be less than Dsym(qb). However,
if Dsym(qg) is greater than Dsym(qb), the distribution is
classified as malicious.
3.3.1
Measuring K-L divergence with unigrams
The first metric we design measures the KL-divergence of unigrams by considering all domain names that belong to the same group,e.g. all domains that map to the same IP-address or those that belong to the same top-level domain. We postpone discussion of groups to Section 4. Given a group of domains for which we want to establish whether they were generated algorithmically or not, we first com-pute the distribution of alphanumeric characters to obtain the test distribution. Next, we compute the KL-divergence with a good distribution obtained from the non-malicious data sets (ISP or DNS crawl) and a malicious distribution obtained by modeling a botnet that uses generates alphanu-merics uniformly. As expected, a simple unigram based technique may not suffice, especially to detect Kraken or Kwyjibo generated domains. Hence, we consider bigrams in our next metric.
3.3.2
Measuring K-L divergence with bigrams
A simple obfuscation technique that can be employed by algorithmically generated malicious domain names could be
to generate domain names by using the same distribution of alphanumerics as commonly seen for legitimate domains. Hence, in our next metric, we consider distribution of bi-grams, i.e., two consecutive characters. We argue that it would be harder for an algorithm to generate domain names that exactly preserve a bigram distribution similar to legit-imate domains since the algorithm would need to consider the previous character already generated while generating the current character. The choices for the current character will be hence more restrictive than when choosing charac-ters based on unigram distributions. Thus, the probability of a bigram matching a non-malicious distribution becomes smaller.
Analogous to the case above, given a group of domains, we extract the set of bigrams present in it to form a bigram dis-tribution. Note that for the set of alphanumeric characters that we consider [a-z,0-9], the total number of bigrams pos-sible are 36x36, i.e., 1,296. Our improved hypothesis now involves validating a given test bigram distribution against the bigram distribution of non-malicious and malicious do-main labels. We use the database of non-malicious words to determine a non-malicious probability distribution. For a sample malicious distribution, we generate bigrams ran-domly. Here as well, we use KL-divergence over the bigram distribution to determine if a test distribution is malicious or legitimate.
3.3.3
Using Jaccard Index between bigrams
We present the second metric to measure the similarity between a known set of components and a test distribution, namely theJaccard indexmeasure. The metric is defined as :
JI= A∩B
A∪B
where,AandB each represent the set of random variables. For our particular case, the set comprises of bigrams that compose a sub-domain or a hostname. Note that Jaccard index (JI) measure based on bigrams is a commonly used technique for web search engine spell-checking [22].
The core motivation behind using the JI measure is same as that for KL-divergence. We expect that bigrams occur-ring in randomized (or malicious) hostnames to be mostly
different when compared with the set of non-malicious bi-grams. To elaborate, we construct a database of bigrams which point to lists of non-malicious words, domain labels or hostnames, as the case may be. Now for each sub-domain present in a test set, we determine all non-malicious words that contain at least 75% of the bigrams present in the test word. Such a threshold helps us discard words with less similarity. However, longer test words may implicitly satisfy this criteria and may yield ambiguous JI value. As observed in section 5, the word sizes for 95% of non-malicious words do not exceed 24 characters, and hence we divide all test words into units of 24 character strings. Figure 2 presents the CDF of sub-domain sizes as observed in our DNS PTR dataset (described in section 5).
Calculating the JI measure is best explained with an example. Considering a randomized hostname such as ickoxjsov.botnet.com, we determine the JI value of the sub-domain ickoxjsov by first computing all bigrams (8 in this case). Next, we examine each bigram’s queue of non-malicious domain labels, and short list words with at least 75% of bigrams, i.e., 6 of the above 8 bigrams. Words satisfying this criteria may include thequickbrownfoxjumpsoverthelazydog. However, such a word still has a low JI value owing to the large number of bigrams in it. Therefore, the JI value is thus computed as 6/(8 + 35 - 6) = 0.16. The low value indicates that the randomized test word does not match too well with the word from non-malicious bigram database.
0 0.2 0.4 0.6 0.8 1 0 5 10 15 20 25 30 35 40 45
Cumulative fraction of total sub-domains
Number of characters in second-level sub-domain
Figure 2: CDF of domain label sizes for DNS PTR dataset.
The JI measure is thus computed for the remaining words. The test words might comprise of a large number of bigrams and therefore do not always ensure a high JI value. We compute the JI measure using the equation described above and average it for all test words belonging to a particular group being analyzed. The averaged JI value for a non-malicious domain is expected to be higher than those for malicious groups.
As observed via our experiments in Section 5, the JI mea-sure is better at determining domain based anomalies. How-ever, it is also computationally expensive as the database of non-malicious bigrams needs to be maintained in the mem-ory. Also, classifying a non-malicious hosts will take more CPU cycles as we would obtain and compare a large set of words consisting of test word’s bigrams.
3.3.4
Edit distance
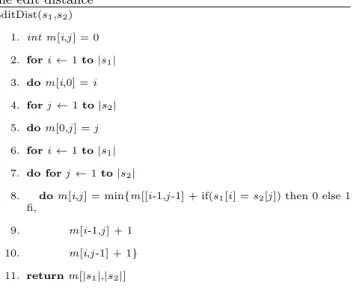
Note that the two metrics described earlier, rely on defi-nition of a “good” distribution (KL-divergence) or database (JI measure). Hence, we define a third metric, Edit distance, which classifies a group of domains as malicious or legiti-mate by only looking at the domains within the group, and is hence not reliant on definition of a good database or dis-tribution. The Edit distance between two strings represents an integral value identifying the number of transformations required to transform one string to another. It is a symmet-ric measure and provides a measure of intra-domain entropy. The type of eligible transformations are addition, deletion, and modification. For instance, to convert the wordcat to dog, the edit distance is 3 as it requires all three characters to be replaced. With reference to determining anomalous domains, we expect that all domain labels (or hostnames) which are randomized, will, on an average, have higher edit distance value. We use the Levenshtein edit distance dy-namic algorithm for determining the edit distance. The al-gorithm for computing the Levenshtein edit distance has been described in 1 [22].
Algorithm 1Dynamic programming algorithm for finding the edit distance
EditDist(s1,s2) 1. int m[i,j] = 0 2. fori←1to|s1| 3. dom[i,0] =i 4. forj ←1to|s2| 5. dom[0,j] =j 6. fori←1to|s1| 7. do forj ←1to|s2|
8. dom[i,j] = min{m[[i-1,j-1] + if(s1[i] =s2[j]) then 0 else 1 fi,
9. m[i-1,j] + 1 10. m[i,j-1] + 1} 11. returnm[|s1|,|s2|]
4.
GROUPING DOMAIN NAMES
In this section, we present ways by which we group to-gether domain names in order to compute metrics that were defined in Section 3 earlier.
4.1
Per-domain analysis
Note that botnets such as Conficker used several second-level domain names to generate algorithmic domain names, e.g.,.ws, .info, .org. Hence, one way by which we group to-gether domain names is via the second-level domain name. The intention is that if we begin seeing several algorithmi-cally generated domain names being queried such that all of them correspond to the same second-level domain, then this may be reflective of a few favorite domains being ex-ploited. Hence for all sub-domains,e.g.,abc.examplesite.org, def.examplesite.org, etc., that have the same second-level domain name examplesite.org, we compute all the metrics over the alphanumeric characters and bigrams. Since
do-main fluxing involves a botnet generating a large number of domain names, we consider only domains which contain a sufficient number of third-level domain labels,e.g., 50, 100, 200 and 500 sub-domains.
4.2
Per-IP analysis
As a second method of grouping, we consider all domains that are mapped to the same IP-address. This would be re-flective of a scenario where a botnet has registered several of the algorithmic domain names to the same IP-address of a command-and-control server. Determining if an IP address is mapped to several such malicious domains is useful as such an IP-address or its corresponding prefix can be quickly blacklisted in order to sever the traffic between a command-and-control server and its bots. We use the dataset from a Tier-1 ISP to determine all IP-addresses which have multiple hostnames mapped to it. For a large number of hostnames representing one IP address, we explore the above described metrics, and thus identify whether the IP address is mali-cious or not.
4.3
Component analysis
A few botnets have taken the idea of domain fluxing fur-ther and generate names that span multiple TLDs, e.g., Conficker-C generates domain names in 110 TLDs. At the same time domain fluxing can be combined with another technique, namely “IP fluxing” [25] where each domain name is mapped to an ever changing set of IP-addresses in an at-tempt to evade IP blacklists. Indeed, a combination of the two is even harder to detect. Hence, we propose the third method for grouping domain names into connected compo-nents.
We first construct a bipartite graphGwith IP-addresses on one side and domain names on the other. An edge is constructed between a domain name and an IP-address if that IP-address was ever returned as one of the responses in a DNS query. When multiple IP addresses are returned, we draw edges between all the returned IP addresses and the queried host name.
First, we determine the connected components of the bi-partite graphG, where a connected component is defined as one which does not have any edges with any other compo-nents. Next, we compute the various metrics (KL-divergence for unigrams and bigrams, JI measure for bigrams, Edit dis-tance) for each component by considering all the domain names within a component.
Component extraction separates the IP-domain graph into components which can be classified in to the following classes: (i) IP fan: these have one IP-address which is mapped to several domain names. Besides the case where one IP-address is mapped to several algorithmic domains, there are several legitimate scenarios possible. First, this class could include domain hosting services where one IP-address is used to provide hosting to several domains,e.g. Google Sites,etc. Other examples could be mail relay service where one mail server is used to provide mail relay for several MX domains. Another example could be when domain registrars provide domain parking services, i.e., someone can purchase a do-main name while asking the registrar to host it temporarily. (ii)Domain fan: these consist of one domain name con-nected to multiple IPs. This class will contain components belonging to the legitimate content providers such as Google, Yahoo!,etc. (iii)Many-to-many component: these are
components that have multiple IP addresses and multiple domain names,e.g., Content Distribution Networks (CDNs) such as Akamai.
4.3.1
L1-regularized Linear Regression
Note that the problem of classifying a component as mali-cious (algorithmically generated) or legitimate can be formu-lated in a supervised learning setting as a linear regression or classification problem. In particular, we label the compo-nents and train a L1-regularized Linear Regression over 10 hours out of the one day of the ISP trace we have access to. We first label all domains within the components found in the training data set by querying against domain reputation sites such as McAfee Site Advisor [2] and Web of Trust [7] as well as by searching for the URLs on search-engines [33]. Next, we label a component as good or bad depending on a simple majority count,i.e., if more than 50% of domains in a component are classified as malicious (adware, malware, spyware, etc.) by any of the reputation engines, then we label that component as malicious.
Define the set of features asF which includes the follow-ing metrics computed for each component: KL-distance on unigrams, JI measure on bigrams and Edit distance. Also define the set of Training examples asTand its size in terms of number of components as|T|. Further, define the output value for each componentyi= 1 if it was labeled malicious
or = 0 if legitimate. We model the output valueyi for any
componenti∈T as a linear weighted sum of the values at-tained by each feature where the weights are given byβjfor
each featurej∈F: yi=Pj∈Fβjxj+β0
In particular, we use the LASSO, also known as L1-regularized Linear Regression [18], where an additional constraint on each feature allows us to obtain a model with lower test prediction errors than the non-regularized linear regression since some variables can be adaptively shrunk towards lower values. We use 10-fold cross validation to choose the value of the regularization parameter λ∈[0-1] that provides the minimum training error (equation below) and then use that
λvalue in our tests:
argmin β |T| X i=1 (yi−β0− X j∈F βjxj)2+λ X j∈F |βj|. (2)
5.
RESULTS
In this section, we present results of employing various metrics across different groups, as described in section 3. We briefly describe the data set used for each experiment.
With all our experiments, we present the results based on the consideration of increasing number of domain labels. In general, we observe that using a larger test data set yields better results.
5.1
Per-domain analysis
5.1.1
Data set
The analysis in this sub-section is based only on the do-main labels belonging to a dodo-main. The non-malicious dis-tributiongmay be obtained from various sources. For our analysis, we use a database of DNS PTR records correspond-ing to all IPv4 addresses. The database contains 659 second-level domains with at least 50 third-second-level sub-domains, while there are 103 second-level domains with at least 500 third-level sub-domains. From the database, we extract all
second-level domains which have at least 50 third-second-level sub-domains. All third-level domain labels corresponding to such domains are used to generate the distribution g. For instance, a second-level domain such asuniversity.edu may have many third-level domain labelssuch asphysics,cse,humanitiesetc. We use all such labels that belong to trusted domains, for determiningg.
To generate a malicious base distributionb, we randomly generate as many characters as present in the non-malicious distribution. We use domain labels belonging to well-known malware based domains identified by Botlab, and also a pub-licly available webspam database as malicious domains [1, 9] for verification using our metrics. Botlab provides us with various domains used by Kraken, Pushdo, Storm, MegaD, and Srizbi [1]. Forper-domainanalysis, the test words used are the third-level domain labels.
Figure 1(a) shows how malicious/non-malicious distribu-tions appear for the DNS PTR dataset as well as the ISP dataset described in the following sections.
We will present the results for all the four measures de-scribed earlier for domain-based analysis. In later sections, we will only present data from one of the measures for brevity.
5.1.2
K-L divergence with unigram distribution
We measure the symmetrized K-L distance metric from the test domain to the malicious/non-malicious alphabet distributions. We classify the test domain as malicious or non-malicious based on equation (10) in Appendix A. Figure 3(a) shows the results from our experiment presented as an ROC curve.
The figure shows that the different sizes of test data sets produce relatively different results. The area under the ROC is a measure of the goodness of the metric. We observe that with 200 or 500 domain labels, we cover a relatively greater area, implying that using many domain labels helps obtain accurate results. For example, using 500 labels, we obtain 100% detection rate with only 2.5% false positive rate. Note that with a larger data set, we indeed expect higher true positive rates for small false positive rates, as larger samples will stabilize the evaluated metrics.
The number of domain labels required for accurate detec-tion corresponds to the latency of accurately classifying a previously unseen domain. The results seem to point out that a domain-fluxing domain can be accurately character-ized by the time it generates 500 names or less.
5.1.3
K-L divergence with bigram distribution
Figure 3(b) presents the results of employing K-L dis-tances over bigram distributions. We observe again that us-ing 200 or 500 domain labels does better than usus-ing smaller number of labels, with 500 labels doing the best. Experi-ments with 50/100 domain labels yield similar results.
We note that the performance with unigram distributions is slightly better than using bigram distributions. This phe-nomena is particularly evident for experiments using 50/100 labels. The improved performance of unigrams is due to higher resemblance of test words’ bigrams to the non-malicious bigram distribution. Therefore, the separation of malicious from non-malicious entities becomes less clear. The false positive rates are seen to be slightly higher for bigram dis-tributions compared to the unigram disdis-tributions.
However, when botnets employ counter measures to our techniques, the bigram distributions may provide better
de-fense compared to unigram distributions as they require more effort to match the good distribution (g).
5.1.4
Jaccard measure of bigrams
The Jaccard Index measure does significantly better in comparison to the previous metrics. From figure 4(a), it is evident that using 500 domain labels gives us a clear separa-tion for classificasepara-tion of test domains (and hence an area of 1). Using 50 or 100 labels is fairly equivalent with 200 labels doing comparatively better. The JI measure produces higher false positives for smaller number of domains (50/100/200) than K-L distance measures.
5.1.5
Edit distance of domain labels
Figure 4(b) shows the performance using edit distance as the evaluation metric. The detection rate for 50/100 test words reaches 1 only for high false positive rates, indicating that a larger test word set should be used. For 200/500 do-main labels, 100% detection rate is achieved at false positive rates of 5-7%.
5.1.6
Kwyjibo domain label analysis
Kwyjibo is a tool to generate random words which can be used as sub-domain names [12]. The generated words are seemingly closer to pronounceable words of the english language, in addition to being random. Thus many such words can be created in a short time. We anticipate that such a tool can be used by attackers to generate domain labels or domain names quickly with the aim of defeating our scheme. Therefore, we analyze Kwyjibo based words, considering them as domain labels belonging to a particular domain.
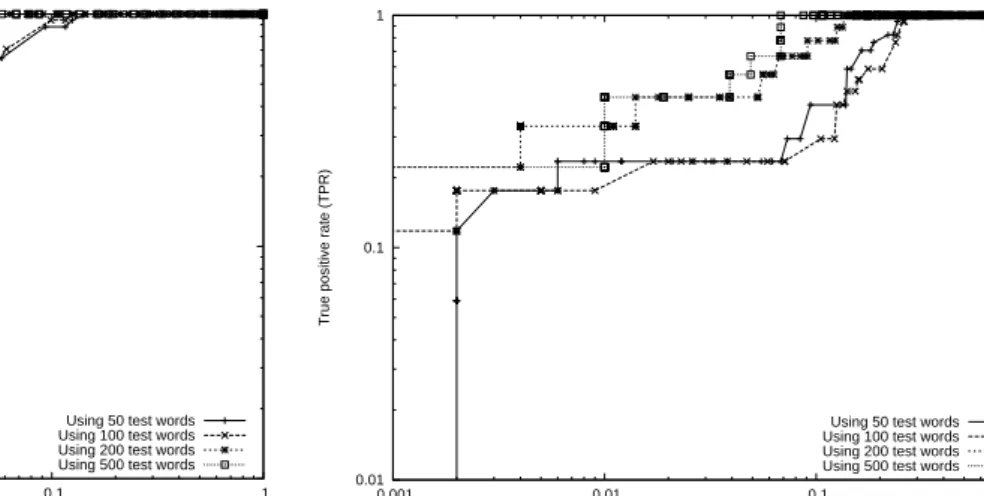
The names generated by Kwyjibo tool could be accurately characterized by our measures given sufficient names. Ex-ample results are presented in Fig. 5 with K-L distances over unigram distributions. From figure 5, we observe that verifi-cation with unigram frequency can lead to a high detection rate with very low false positive rate. Again, the perfor-mance using 500 labels is the best. We also observe a very steep rise in detection rates for all the cases. The Kwyjibo domains could be accurately characterized with false posi-tive rates of 6% or less.
0.01 0.1 1
0.001 0.01 0.1 1
True positive rate (TPR)
False positive rate (FPR)
Using 50 test words Using 100 test words Using 200 test words Using 500 test words
Figure 5: ROC curve : K-L metric with unigram distribution (Kwyjibo).
0.01 0.1 1
0.001 0.01 0.1 1
True positive rate (TPR)
False positive rate (FPR)
Using 50 test words Using 100 test words Using 200 test words Using 500 test words
K-L metric with unigram distribution (Per-domain).
0.01 0.1 1
0.001 0.01 0.1 1
True positive rate (TPR)
False positive rate (FPR)
Using 50 test words Using 100 test words Using 200 test words Using 500 test words
K-L metric with bigram distribution
Figure 3: ROC curves for Per-domain analysis
0.01 0.1 1
0.01 0.1 1
True positive rate (TPR)
False positive rate (FPR)
Using 50 test words Using 100 test words Using 200 test words Using 500 test words
Jaccard measure for bigrams
0.1 1
0.01 0.1 1
True positive rate (TPR)
False positive rate (FPR)
Using 50 test words Using 100 test words Using 200 test words Using 500 test words
Edit distance (Per-domain).
Figure 4: ROC curves for Per-domain analysis
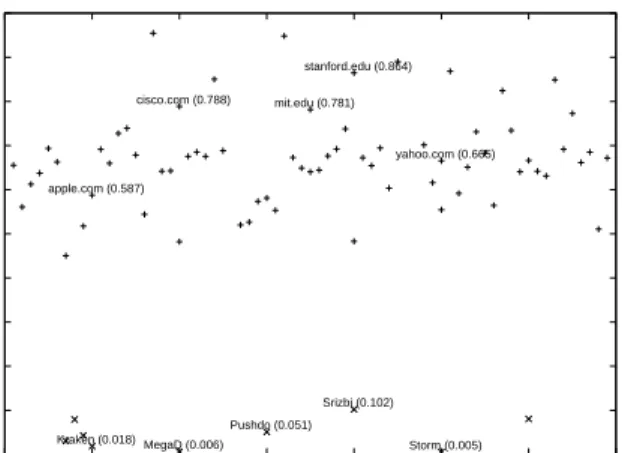
to the per-domain analysis. This is because of the pres-ence of highly probable non-malicious unigrams in Kwyjibo based domains makes detection difficult at lower false pos-itive rates. The results with other measures (K-L distance over bigram distributions, JI and edit distances) were sim-ilar: kwyjibo domains could be accurately characterized at false positive rates in the range of 10-12%, but detection rates were nearly zero at false positive rates of 10% or less. The scatter plot presented in Fig. 6 indicates the clear separation obtained between non-malicious and malicious domains. The plot represents the Jaccard measure using 500 test words. We highlight the detection of botnet based ma-licious domains such asKraken,MegaD,Pushdo,Srizbi, and Storm. A few well-known non-malicious domains such as apple.com,cisco.com,stanford.edu,mit.edu, andyahoo.com have also been indicated for comparison purposes.
5.1.7
Progressive demarcation
The earlier results have showed that very high good detec-tion rates can be obtained at low false positive rates once we have 500 or more hostnames of a test domain. As discussed
earlier, the number of hostnames required for our analysis corresponds to latency of accurately characterizing a previ-ously unseen domain. During our experiments, not all the test domains required 500 hostnames for accurate charac-terization since the distributions were either very close to the good distribution g or bad distributionb. These test domains could be characterized with a smaller latency (or smaller number of hostnames).
In order to reduce the latency for such domains, we tried an experiment at progressive demarcation or characteriza-tion of the test domains. Intuitively, the idea is to draw two thresholds above one there are clearly good domains, below the second threshold there are clearly bad domains and the domains between the two thresholds require more data (or hostnames) for accurate characterization. These thresholds are progressively brought closer (or made tighter) as more hostnames become available, allowing more domains to be accurately characterized until we get 500 or more hostnames for each domain. The results of such an experiment using the JI measure are shown in Fig. 7.
0 0.1 0.2 0.3 0.4 0.5 0.6 0.7 0.8 0.9 1 0 10 20 30 40 50 60 70 Jaccard measure Domain index Kraken (0.018) MegaD (0.006) Pushdo (0.051) Srizbi (0.102) Storm (0.005) apple.com (0.587) cisco.com (0.788) mit.edu (0.781) stanford.edu (0.864) yahoo.com (0.665)
Figure 6: Scatter plot with Jaccard Index for bi-grams (500 test words).
We establish the lower bound using the formula µb+σb
whereµbis the mean of JI values observed for bad or
ma-licious domains and σb is the standard deviation.
Sim-ilarly, the upper bound is obtained using the expression
µg−σg where the subscriptg implies good domains.
Fig-ure 7 shows the detection rate for the considered domains. We see a monotonically increasing detection rate for both good and bad domains. It is observed that 85% of bad do-mains could be so characterized accurately with only 100 hostnames while only about 23% of good domains can be so characterized with 100 hostnames. In addition, the results indicate that only a small percentage of domains require 200 or more hostnames for their characterization.
0.2 0.3 0.4 0.5 0.6 0.7 0.8 0.9 1 0 100 200 300 400 500 Detection rate
Number of test words used
Malicious domains detection rate Non-malicious domains detection rate
Figure 7: Illustrating benefits of progressive demar-cation with JI measure.
5.2
Per-IP analysis
5.2.1
Data set
Here, we present the evaluation of domain names that map to an IP address. For analyzing the per-IP group, for all hostnames mapping to an IP-address, we use the do-main labels except the top-level dodo-main TLD as the test word. For instance, for hostnames physics.university.edu
andcse.university.edumapping to an IP address, say6.6.6.6, we use physicsuniversity and cseuniversity as test words. However, we only consider IP addresses with at least 50 hostnames mapping to it. We found 341 such IP addresses, of which 53 were found to be malicious, and 288 were consid-ered non-malicious. The data is obtained from DNS traces of a Tier-1 ISP in Asia.
Many hostnames may map to the same IP address. Such a mapping holds for botnets or other malicious entities utiliz-ing a large set of hostnames mapputiliz-ing to fewer C&C(Command and Control) servers. It may also be valid for legitimate in-ternet service such as for Content Delivery Networks (CDNs). We first classify the IPs obtained into two classes of mali-cious and non-malimali-cious IPs. The classification is done based on manual checking, using blacklists, or publicly available Web of Trust information [7]. We manually confirm the pres-ence ofConfickerbased IP addresses and domain names [29]. The ground truth thus obtained may be used to verify the accuracy of classification. Figure 1 shows the distribution of non-malicious test words and the randomized distribution is generated as described previously.
We discuss the results of per-IP analysis below. For the sake of brevity, we present results based on K-L distances of bigram distributions only. Summary of results from other metrics is provided.
The ROC curve for K-L metric shows that bigram distri-bution can be effective in accurately characterizing the do-main names belonging to different IP addresses. We observe a very clear separation between malicious and non-malicious IPs with 500, and even with 200 test words. With a low false positive rate of 1%, high detection rates of 90% or more ob-tained with 100 or more test words.
The bigram analysis was found to perform better than un-igram distributions. The per-IP bun-igram analysis performed better than per-domain bigram analysis. We believe that the bigrams obtained from the ISP dataset provide a com-prehensive non-malicious distribution. The second-level do-main labels also assist in discarding false anomalies, and therefore providing better performance.
The JI measure performed very well, even for small set of test words. The area covered under the ROC curve was 1 for 200/500 test words. For the experiment with 100 test words. We achieved the detection rates of 100% with false positive rate of only 2%.
Edit distance with domains mapping to an IP, results in a good performance in general. The experiments with 100 test words results in a low false positive rate of about 10% for a 100% detection rate. However for using only 50 test words, the detection rate reaches about 80% for a high false positive rate of 20%. Thus, we conclude that for per-IP based analysis, the JI measure performs relatively better than previous measures applied to this group. However, as highlighted in section 6, the time taken to compute edit distance is large.
5.3
Per-component analysis
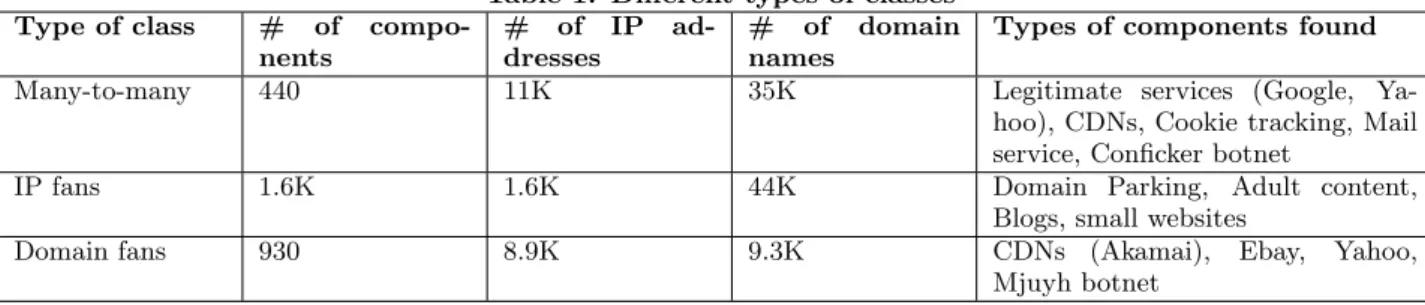
We next discuss the results from applying connected com-ponent analysis to the ISP trace. We classify the connected components in to three classes: IP fans, Domain fans and Many-to-many components, details of which are provided in Table 1.
Next, we use a supervised learning framework where we train a L1-regularized linear regression model (see
Equa-tion 2) on components labeled in a 10-hour trace interval. For labeling the components during training, we used the information from URL reputation services such as Web of Trust, McAfee Site Advisor and mark 128 components as good (these contain CDNs, mail service providers, large net-works such as Google) and we mark 1 component belonging to the Conficker botnet as malicious. For each component, we compute the features of KL-divergence, Jaccard Index measure and Edit distance. We train the regression model using glmnet tool [18] in statistical package R, and obtain the value for the regularization parameterλas 1e−4, that minimizes training error during the training phase. We then test the model on the remaining portion of the one day long trace. In this regards, our goal is to check if our regression model can not only detect Conficker botnet but whether it can also detect other malicious domain groups during the testing phase over the trace. During the testing stage, if a particular component is flagged as suspicious then we check against Web of Trust [7], McAfee Site Advisor [2] as well as via Whois queries, search engines, to ascertain the exact behavior of the component. Next, we explain the results of each of the classes individually.
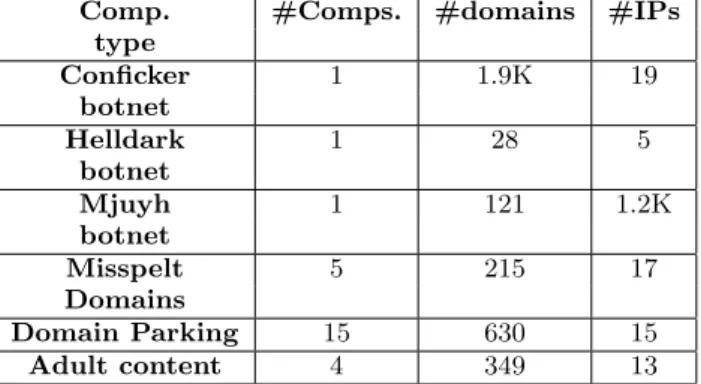
On applying our model to the rest of the trace, 29 com-ponents (out of a total of 3K comcom-ponents) are classified as malicious, and we find 27 of them to be malicious after cross checking with external sources (Web of Trust, McAfee,etc.) while 2 components (99 domains) are false positives and comprise of Google and domains belonging to news blogs. Note that here we use a broad definition of malicious do-mains as those that could be used for any nefarious purposes on the web,i.e., we do not necessarily restrict the definition to only include botnet domain generation algorithm. Out of the 27 components that were classified as malicious, one of them corresponds to the Conficker botnet, which is as ex-pected since our training incorporated features learnt from Conficker. We next provide details on the remaining 26 com-ponents that were determined as malicious (see Table 2).
Mjuyh Botnet: The most interesting discovery from our component analysis is that of another Botnet, which we call Mjuyh, since they use the domain namemjuyh.com(see Ta-ble 3). The second level name is generated randomly and is 57 characters long. Each of the 121 domain names belong-ing to this bot network return 10 different IP addresses on a DNS query for a total of 1.2K IP-addresses. Also, in some replies, there are invalid IP addresses like 0.116.157.148. All the 10 IP addresses returned for a given domain name, be-long to different network prefixes. Furthermore, there is no intersection in the network prefixes between the different domain names of the mjuyh bot. We strongly suspect that this is a case of “domain fluxing” along with “IP fast flux-ing”, where each bot generated a different randomized query which was resolved to a different set of IP-addresses.
Helldark Trojan: We discovered a component contain-ing 5 different third-level domains (a few sample domain names are as shown in Table 3) The component comprises of 28 different domain names which were all found to be spread-ing multiple Trojans. One such Trojan spread by these do-mains is Win32/Hamweq.CW that spreads via removable drives, such as USB memory sticks. They also have an IRC-based backdoor, which may be used by a remote attacker directing the affected machine to participate in Distributed Denial of Service attacks, or to download and execute arbi-trary files [8].
Mis-spelt component: There are about 5 components (comprising 220 domain names) which used tricked (mis-spelt or slightly different spelling) names of reputed domain names. For example, these components use domain names such as uahoo.co.uk to trick users trying to visit yahoo.co.uk (since the alphabet ‘u’ is next to the alphabet ‘y’, they ex-pect users to enter this domain name by mistake). Dizney-land.com is used to misdirect users trying to visit Disney-land.com (which replaces the alphabet ‘s’ with alphabet ‘z’). We still consider these components as malicious since they comprise of domains that exhibit unusual alphanumeric fea-tures.
Domain Parking: We found 15 components (630 do-main names) that were being used for dodo-main parking,i.e., a practice where users register for a domain name without actually using it, in which case the registrar’s IP-address is returned as the DNS response. In these 15 components, one belongs to GoDaddy (66 domain names), 13 of them belong to Sedo domain parking (510 domain names) and one com-ponent belongs to OpenDNS (57 domain names). Clearly these components represent something abnormal as there are many domains with widely disparate algorithmic fea-tures clustered together on account of the same IP-address they are mapped to.
Adult Content: We find four components that comprise of 349 domains primarily used for hosting adult content sites. Clearly this matches the well known fact, that in the world of adult site hosting, the same set of IP-addresses are used to host a vast number of domains, each of which in turn may use very different words in an attempt to drive traffic.
In addition, for comparison purposes, we used the lexical features of the domain names such as the length of the do-main names, number of dots and the length of the second-level domain name (for example, xyz.com) for training on the same ISP trace instead of the KL-divergence, JI mea-sure and Edit distance meamea-sures used in our study. These lexical features were found to be useful in an earlier study in identifying malicious URLs [21]. The model trained on these lexical features correctly labeled four components as malicious (Conficker bot network, three adult content com-ponents and one component containing mis-spelt domain names) during the testing phase, but it also resulted in 30 components which were legitimate as being labeled inrectly; compare this against 27 components that were cor-rectly classified as malicious and two that were false positives on using our alphanumeric features.
Table 2: Summary of interesting networks discov-ered through component analysis
Comp. #Comps. #domains #IPs
type Conficker 1 1.9K 19 botnet Helldark 1 28 5 botnet Mjuyh 1 121 1.2K botnet Misspelt 5 215 17 Domains Domain Parking 15 630 15 Adult content 4 349 13
Table 1: Different types of classes Type of class # of
compo-nents
# of IP ad-dresses
# of domain names
Types of components found
Many-to-many 440 11K 35K Legitimate services (Google, Ya-hoo), CDNs, Cookie tracking, Mail service, Conficker botnet
IP fans 1.6K 1.6K 44K Domain Parking, Adult content, Blogs, small websites
Domain fans 930 8.9K 9.3K CDNs (Akamai), Ebay, Yahoo, Mjuyh botnet
Table 3: Domain names used by bots Type of group Domain names Conficker botnet
vddxnvzqjks.ws gcvwknnxz.biz joftvvtvmx.org
Mjuyh bot 935c4fe[0-9a-z]+.6.mjuyh.com
c2d026e[0-9a-z]+.6.mjuyh.com
Helldark Trojan
may.helldark.biz X0R.ircdevils.net www.BALDMANPOWER.ORG
We also test our model on an ISP Tier-1 trace from Brazil. This trace is about 20 hours long and is collected on a smaller scale as compared to the ISP trace from Asia. The time lag between the capture of Brazil trace and the previously used ISP trace from Asia, is about 15 days. We use the same training set for the prediction model as we use for the ISP trace from Asia. In the prediction stage, we successfully detect the Conficker component with no false positives. We are not able to detect other components because the length of the trace is smaller in size as compared to the other trace. The Conficker component has 185 domain names and 10 IP addresses. Of the 10 IP addresses determined for the Conficker component of the Brazil trace, 9 are common with the Asia ISP trace’s Conficker component. We conclude that Conficker based C&C servers have relatively large TTLs. However, out of the 185 domain names only 5 domains are common from this component and the component from the ISP trace from Asia. Clearly, the Conficker botnet exhibits rapid domain fluxing.
5.4
Summary
For a larger set of test words, the relative order of efficacy of different measures decreases from JI, to edit distance to K-L distances over bigrams and unigrams. However, inter-estingly, we observe the exact opposite order when using a small set of test words. For instance, with 50 test words used for the per-domain analysis, the false positive rates at which we obtain 100% detection rates, are approximately 50% (JI), 20% (ED), 25% (K-L with bigram distribution), and 15% (K-L with unigram distribution). Even though the proof in the Appendix indicates that K-L divergence is an optimal metric for classification, in practice, it does not hold as the proof is based on the assumption that it is equally likely to draw a test distribution from a good or a bad distribution.
6.
DISCUSSION
6.1
Usefulness of component analysis
Conficker botnet, present in our ISP trace, employs do-main fluxing across TLDs, that became directly visible after IP-domain components were extracted and analyzed from the trace. The component analysis allowed the application of our detection methods across several different domains, which otherwise would have looked different from each other. In addition, component analysis allowed us to detect Con-ficker domains that would not have been detectable with our approach when applied to domain names alone since some of these domains contained fewer than 50 names needed for accurate analysis. Similarly, some of the IP addresses in the component hosted fewer than 50 names and would not have been detected with the IP address based analysis either. However, these domains will be included in the component analysis as long as the component has altogether more than 50 names.
LetDcbe the number of hostnames andIcbe the number
of IP addresses in the component. If Dd,Id are the
num-ber of hostnames and corresponding IP addresses detected through domain level analysis, we define domain level com-pleteness ratios asDd/Dcand Id/Ic. Similarly, we can
de-fine the completeness ratios for IP-based analysis asDi/Dc
and Ii/Ic, where Di and Ii correspond to the total
num-ber of hostnames and IP addresses of the conficker botnet detected by the IP-based analysis.
For the Conficker botnet, these completeness ratios for IP-based analysis were 73.68% for IP addresses and 98.56% for hostnames. This implies that we are able to detect an addi-tional 26.32% of IP addresses and a relatively small fraction of 1.44% of hostnames for those IP addresses. The complete-ness ratios for domain based analysis were found to be 100% for IP addresses and 83.87% for the hostnames. Therefore, we do 16.13% better in terms of determining the hostnames using the per-domain analysis. This shows that the com-ponent level analysis provided extra value in analyzing the trace for malicious domains.
6.2
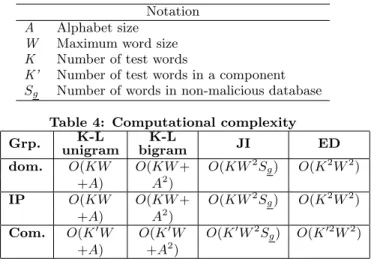
Complexity of various measures
Table 4 identifies the computational complexity for every metric, and for all groups that we use. We observe that K-L metrics analyzing unigram and bigram distributions can be computed fairly efficiently. However, for the JI measure, the size of the non-malicious database largely influences the time taken to compute the measure. A good database size results in a higher accuracy, at the cost of increased time taken for analysis. Similarly, edit distance takes longer for large word lengths, and the number of test words. However, it is
independent of any database, hence the space requirements are smaller.
Notation A Alphabet size
W Maximum word size K Number of test words
K’ Number of test words in a component
Sg Number of words in non-malicious database
Table 4: Computational complexity
9 Grp. unigramK-L bigramK-L JI ED dom. O(KW O(KW+ O(KW2S g) O(K2W2) +A) A2) IP O(KW O(KW+ O(KW2S g) O(K2W2) +A) A2) Com. O(K′W O(K′W O(K′W2Sg) O(K′2W2) +A) +A2)
We briefly describe how we determine the bounds as ex-pressed in table 4 for the per-domain group. For the K-L unigram analysis since we examine every character of every test word, the complexity is bounded byKW. We then com-pute, for every character in the alphabetA, the divergence values. Therefore, we obtain the complexity as O(KW + A). Bigram distribution based K-L divergence is calculated similarly except that the new alphabet size isA2. While
cal-culating the Jaccard index, note that the number of bigrams obtained isO(W −1). For each bigram, we examine the queues pointing to words from the non-malicious database. Thus, for each bigram, we examineO(W Sg)bigrams. Since
we do it forKtest words, we obtainO(KW2S
g). For every
test word used while obtaining the edit distance, we exam-ine it against the K - 1 test words. Therefore, the total complexity is simplyO(K2W2). The expressions forper-IP andper-component groups are obtained analogously.
It is interesting to note that A is of the size 36 (0-9,a-z characters). K used in our analysis varies as 50/100/200/500. However, the average value forK’is higher in comparison. The DNS PTR dataset considered for per-domain analysis has approximately 469,000 words used for training purposes. This helps us estimateSg. For the ISP
dataset,Sg is of the order of 11522 words. An estimate of
W for the DNS PTR dataset is obtained from figure 2.
7.
CONCLUSIONS
In this paper, we propose a methodology for detecting al-gorithmically generated domain names as used for “domain fluxing” by several recent Botnets. We propose statistical measures such as Kullback-Leibler divergence, Jaccard in-dex, and Levenshtein edit distance for classifying a group of domains as malicious (algorithmically generated) or not. We perform a comprehensive analysis on several data sets including a set of legitimate domain names obtained via a crawl of IPv4 address space as well as DNS traffic from a Tier-1 ISP in Asia. One of our key contributions is the rela-tive performance characterization of each metric in different scenarios. In general, the Jaccard measure performs the best, followed by the Edit distance measure, and finally the
KL divergence. Furthermore, we show how our methodol-ogy when applied to the Tier-1 ISP’s trace was able to detect Conficker as well as a botnet yet unknown and unclassified, which we call as Mjuyh. In this regards, our methodology can be used as a first alarm to indicate the presence of do-main fluxing in a network, and thereafter a network security analyst can perform additional forensics to infer the exact algorithm being used to generate the domain names. As future work, we plan to generalize our metrics to work on
n-grams for values ofn >2.
8.
ACKNOWLEDGMENTS
This work is supported in part by a Qatar National Re-search Foundation grant, Qatar Telecom, and NSF grants 0702012 and 0621410. We thank Prof. K.R.Narayanan, Department of Electrical and Computer Engineering, Texas A&M University, for helping us with the proof as provided in the appendix.
9.
REFERENCES
[1] Botlab.http://botlab.cs.washington.edu/. [2] Mcafee site advisor.http://www.siteadvisor.com. [3] On kraken and bobax botnets.http://www.damballa.
com/downloads/r_pubs/Kraken_Response.pdf. [4] On the kraken and bobax botnets.
http://www.damballa.com/downloads/r_pubs/ Kraken_Response.pdf.
[5] Pc tools experts crack new kraken.
http://www.pctools.com/news/view/id/202/. [6] Twitter api still attracts hackers.
http://blog.unmaskparasites.com/2009/12/09/ twitter-api-still-attracts-hackers/. [7] Web of trust.http://mywot.com.
[8] Win32/hamewq.http:
//www.microsoft.com/security/portal/Threat/ Encyclopedia/Entry.aspx?Name=Win32/Hamweq. [9] Yahoo webspam database.http://barcelona.
research.yahoo.net/webspam/datasets/uk2007/. [10] A. Bratko, G. V. Cormack, B. Filipic, T. R. Lynam,
and B. Zupan. Spam filtering using statistical data compression models.Journal of Machine Learning Research 7, 2006.
[11] T. Cover and J. Thomas. Elements of information theory.Wiley, 2006.
[12] H. Crawford and J. Aycock. Kwyjibo: automatic domain name generation. InSoftware Practice and Experience, John Wiley & Sons, Ltd., 2008. [13] S. Gianvecchio, M. Xie, Z. Wu, and H. Wang.
Measurement and classification of humans and bots in internet chat.In Proceedings of the 17th USENIX Security Symposium (Security ’08), 2008.
[14] G. Gu, R. Perdisci, J. Zhang, and W. Lee. BotMiner: Clustering analysis of network traffic for protocol- and structure-independent botnet detection.Proceedings of the 17th USENIX Security Symposium (Security’08), 2008.
[15] G. Gu, J. Zhang, and W. Lee. BotSniffer: Detecting botnet command and control channels in network traffic.Proc. of the 15th Annual Network and Distributed System Security Symposium (NDSS’08), Feb. 2008.
[16] T. Holz, M. Steiner, F. Dahl, E. W. Biersack, and F. Freiling. Measurements and mitigation of peer-to-peer-based botnets: A case study on storm worm.In First Usenix Workshop on Large-scale Exploits and Emergent Threats (LEET), April 2008. [17] S. S. J. Ma, L.K. Saul and G. Voelker. Beyond
blacklists: Learning to detect malicious web sites from suspicious URLs.Proc. of ACM KDD, July 2009. [18] R. T. Jerome Friedman, Trevor Hastie. glmnet: Lasso
and elastic-net regularized generalized linear models. Technical report.
[19] J. P. John, A. MoshChuck, S. D. Gribble, and A. Krishnamurthy. Studying spamming botnets using botlab.Proc. of NSDI, 2009.
[20] M. Konte, N. Feamster, and J. Jung. Dynamics of online scam hosting infrastructure.Passive and Active Measurement Conference, 2009.
[21] J. Ma, L. K. Saul, S. Savage, and G. M. Voelker. Beyond blacklists: Learning to detect malicious web sites from suspicious urls. InACM SIGKDD, jun 2009. [22] C. D. Manning, P. Raghavan, and H. Schutze. An
information to information retrieval.Cambridge University Press, 2009.
[23] D. K. McGrath and M. Gupta. Behind phishing: An examination of phisher modi operandi.Proc. of USENIX workshop on Large-scale Exploits and Emergent Threats (LEET), Apr. 2008.
[24] E. Passerini, R. Paleari, L. Martignoni, and D. Bruschi. Fluxor : Detecting and monitoring fast-flux service networks.Detection of Intrusions and Malware, and Vulnerability Assessment, 2008. [25] R. Perdisci, I. Corona, D. Dagon, and W. Lee.
Detecting malicious flux service networks through passive analysis of recursive dns traces. InAnnual Computer Society Security Applications Conference (ACSAC), dec 2009.
[26] R. Perdisci, G. Gu, and W. Lee. Using an ensemble of one-class svm classifiers to harden payload-based anomaly detection systems.In Proceedings of the IEEE International Conference on Data Mining (ICDM ’06), 2006.
[27] P. Porras, H.Saidi, and V. Yegneswaran. Conflicker c p2p protocol and implementation.SRI International Tech. Report, Sep. 2009.
[28] P. Porras, H. Saidi, and V. Yegneswaran. An analysis of conficker’s logic and rendezvous points. Technical report, mar 2009.
[29] P. Porras, H. Saidi, and V. Yegneswaran. Conficker c analysis. Technical report, apr 2009.
[30] J. Stewart. Inside the storm: Protocols and encryption of the storm botnet.Black Hat Technical Security Conference, USA, 2008.
[31] B. Stone-Gross, M. Cova, L. Cavallaro, B. Gilbert, M. Szydlowski, R. Kemmerer, C. Kruegel, and G. Vigna. Your botnet is my botnet: Analysis of a botnet takeover. InACM Conference on Computer and Communications Security (CCS), nov 2009. [32] H. L. V. Trees. Detection, estimation and modulation
theory.Wiley, 2001.
[33] I. Trestian, S. Ranjan, A. Kuzmanovic, and A. Nucci.
Unconstrained endpoint profiling: Googling the internet. InACM SIGCOMM, aug 2008.
[34] Y. Xie, F. Yu, K. Achan, R. Panigrahy, G. Hulten, and I. Osipkov. Spamming botnets: Signatures and characteristics.ACM SIGCOMM Computer Communication Review, 2008.
[35] Y. Zhao, Y. Xie, F. Yu, Q. Ke, Y. Yu, Y. Chen, and E. Gillum. Botgraph: Large scale spamming botnet detection.USENIX Symposium on Networked Systems and Design Implementation (NSDI ’09), 2009.
APPENDIX
Let A = {a1, a2, . . . , aM} denote M the letters of the
al-phabet from which the domain names are chosen (in our case, this is English alphabet with spaces and special char-acters). Let g= [g1, g2, . . . , gM] and b= [b1, b2, . . . , bM] be
the distribution of the letters in the good and bad domains, respectively. Let x be the actual domain name of length
N, that has to be classified as being good or bad. Let the letter ai appear ni times in xsuch that Pini =N. Let
q = [q1, q2, . . . , qM] be the distribution of the different
let-ters inx, i.e.,qi=ni/N.
Under the assumption that a priori, x can belong to a good or bad domain with equal probability, the classifier that minimizes the probability of error (wrong classification) is given by the maximum-likelihood classifier which classifies
xaccording to
P(x|g)≷g b
P(x|b) (3) Intuitively,xis classified as good, if it is more likely to have resulted from the good distribution than from the bad dis-tribution. The above classifier can be specified in terms of the likelihood ratio given by
λ(x) =P(x|g) P(x|b) g ≷ b 1 (4)
As we will see later, it is easier to work with an equivalent quantity N1 logλ(x). The classifier is then given according to 1 Nlogλ(x) = 1 N log P(x|g) P(x|b) g ≷ b 0 (5)
Under the assumption that the letters inxhave been gen-erated independently from the same distribution,P(x|g) is given by P(x|g) = N Y k=1 P(xk|g) = M Y i=1 P(ai|g)ni= M Y i=1 gni i = M Y i=1 gqiN i . (6) The second equality follows by grouping all the occurrences of the letters ai together and recall that there are ni such
occurrences. Similarly, P(x|b) = N Y k=1 P(xk|b) = M Y i=1 P(ai|b)ni = M Y i=1 bni i = M Y i=1 bqiN i . (7) Using (6) and (7) in (5), the log-likelihood ratio can be seen to be 1 N logλ(x) = 1 N log P(x|g) P(x|b) = log QM i=1g qi i QM i=1b qi i (8)
Dividing the numerator and the denominator byQ iqi qi, we get 1 Nlogλ(x) = log QM i=1 gi qi qi QM i=1 bi qi qi (9) = X i qiloggi qi −X i qilogbi qi (10) = D(q|b)−D(q|g) (11) where D(q|b) is the Kullback-Liebler (KL) distance be-tween the two distributions []. Thus, the optimal classifier given in (5) is equivalent to D(q|b)−D(q|g) g ≷ b 0 (12)
This result is intuitively pleasing since the classifier essen-tially computes the KL “distance” between q and the two distributions and chooses the one that is ‘closer’.