ORIGINAL ARTICLE
Initial combination of linagliptin and metformin compared with
linagliptin monotherapy in patients with newly diagnosed type 2
diabetes and marked hyperglycaemia: a randomized, double-blind,
active-controlled, parallel group, multinational clinical trial
S. A. Ross
1, A. E. Caballero
2, S. Del Prato
3, B. Gallwitz
4, D. Lewis-D’Agostino
5, Z. Bailes
6, S. Thiemann
7,
S. Patel
6, H.-J. Woerle
7& M. von Eynatten
71University of Calgary, LMC Endocrinology Centres, Calgary, Alberta, Canada 2Joslin Diabetes Center, Harvard Medical School, Boston, MA, USA
3Department of Endocrinology and Metabolism, Section of Diabetes, University of Pisa, Pisa, Italy 4Department of Medicine IV, Universitätsklinikum Tübingen, Tübingen, Germany
5Boehringer Ingelheim Pharmaceuticals Inc., Ridgefield, CT, USA 6Boehringer Ingelheim Ltd, Bracknell, UK
7Boehringer Ingelheim Pharma GmbH & Co. KG, Ingelheim, Germany
Aims:To evaluate glucose-lowering treatment strategies with linagliptin and metformin in people with newly diagnosed type 2 diabetes and marked hyperglycaemia, a prevalent population for which few dedicated studies of oral antidiabetes drugs have been conducted.
Methods:A total of 316 patients, with type 2 diabetes diagnosed for≤12 months and with glycated haemoglobin (HbA1c) concentration in the range 8.5–12.0%, were randomized 1:1 to double-blind, free-combination treatment with linagliptin 5 mg once daily and metformin twice daily (uptitrated to 2000 mg/day maximum) or to linagliptin monotherapy. The primary endpoint was change in HbA1c concentration from baseline at week 24 (per-protocol completers’ cohort: n=245).
Results:The mean (standard deviation) age and HbA1c at baseline were 48.8 (11.0) years and 9.8 (1.1)%, respectively. At week 24, the mean±standard error (s.e.) HbA1c decreased from baseline by –2.8±0.1% with linagliptin/metformin and –2.0±0.1% with linagliptin; a treatment difference of –0.8% (95% confidence interval –1.1 to –0.5; p<0.0001). Similar results were observed in a sensitivity analysis based on intent-to-treat principles: adjusted mean±s.e. changes in HbA1c of –2.7±0.1% and –1.8±0.1%, respectively; treatment difference of –0.9% (95% CI –1.3 to –0.6; p<0.0001). A treatment response of HbA1c<7.0% was achieved by 61 and 40% of patients in the linagliptin/metformin and linagliptin groups, respectively. Few patients experienced drug-related adverse events (8.8 and 5.7% of patients in the linagliptin/metformin and linagliptin groups, respectively). Hypoglycaemia occurred in 1.9 and 3.2% of patients in the linagliptin/metformin and linagliptin groups, respectively (no severe episodes). Body weight decreased significantly with the combination therapy (–1.3 kg between-group difference; p=0.0033).
Conclusions:Linagliptin in initial combination with metformin in patients with newly diagnosed type 2 diabetes and marked hyperglycaemia, an understudied group, elicited significant improvements in glycaemic control with a low incidence of hypoglycaemia, weight gain or other adverse effects. These results support early combination treatment strategies and suggest that newly diagnosed patients with marked hyperglycaemia may be effectively managed with oral, non-insulin therapy.
Keywords: antidiabetes drug, clinical trial, metformin, DPP-4 inhibitor, type 2 diabetes
Date submitted 22 July 2014; date of first decision 19 August 2014; date of final acceptance 30 September 2014
Introduction
Early achievement of glycaemic control in patients newly diagnosed with type 2 diabetes has been shown to improve long-term clinical outcomes. In the landmark UK Prospective Diabetes Study (UKPDS), initiating glucose-lowering pharma-cotherapy soon after diagnosis significantly reduced the risk Correspondence to: Prof. Stuart A. Ross, MB ChB, University of Calgary, LMC Endocrinology Centres, 102-5940 MacLeod Trail SW, Calgary, Alberta T2H 2G4, Canada.
E-mail: [email protected]
This is an open access article under the terms of the Creative Commons Attribution-NonCommercial-NoDerivs License, which permits use and distribution in any medium, provided the original work is properly cited, the use is non-commercial and no modifications or adaptations are made.
of microvascular complications after 10 years [1]; furthermore, a significantly lower risk of myocardial infarction and death emerged several years after the end of treatment [2].
Oral monotherapy in newly diagnosed patients, however, may be unlikely to achieve glycaemic control, particularly in individuals with marked hyperglycaemia. Furthermore, those with mild or moderate hyperglycaemia who initially achieve glycaemic control with monotherapy do not usually maintain long-term control, as shown by the UKPDS [3] and ADOPT studies [4]. Consequently, patients may benefit from an ini-tial combination strategy of glucose-lowering drugs at the time of diagnosis [5–7]. A position statement from the American
Diabetes Association and the European Association for the Study of Diabetes suggests initial combination for patients with glycated haemoglobin (HbA1c) levels ≥9.0% [8], while the American Association of Clinical Endocrinologists and the Canadian Diabetes Association recommend initial com-bination when HbA1c levels are ≥7.5% [9] or ≥8.5% [10], respectively.
All main guidelines also suggest considering initial insulin treatment for patients with poor glycaemic control at diagnosis, particularly if symptoms of hyperglycaemia are present [8–10]. Insulin can rapidly reduce hyperglycaemia and alleviate gluco-toxicity, and has no dose limit to its efficacy; however, even for patients with severe hyperglycaemia, the risk of hypoglycaemia and weight gain may limit the extent to which insulin can be uptitrated. Furthermore, early use of insulin at diagnosis of type 2 diabetes is often met with resistance from patients and physicians because of fear of side effects, low adherence and impact on quality of life [11]. Because of these limitations, oral combination therapy may be an attractive alternative for patients presenting with marked hyperglycaemia, but which agent should be used with metformin, the usual first-line drug, is still a matter of discussion and more clinical data are needed to generate evidence-based recommendations [8]. Dipeptidyl peptidase (DPP)-4 inhibitors have a complemen-tary mechanism of action to metformin, and are generally well tolerated, weight neutral and have a low risk of hypoglycaemia. Linagliptin is a DPP-4 inhibitor that is excreted mainly by non-renal pathways and does not require dose adjustment for chronic kidney disease or any other factor [12–14].
In the present study, we tested the efficacy and tolerabil-ity of an early combination treatment strategy with metformin and linagliptin versus a DPP-4 therapy alone in patients with newly diagnosed type 2 diabetes with marked hyperglycaemia. Two oral treatment strategies were compared because the study was mainly conducted in primary care settings, in which ini-tiation of insulin is often considered challenging. Linagliptin monotherapy was chosen as the comparator rather than met-formin because the latter has already demonstrated efficacy in this population [15] and, thus, evaluation of a DPP-4 inhibitor expands the evidence base for treatment options. The primary aim was to assess whether oral glucose-lowering treatment strategies based on DPP-4 inhibitors may be appropriate for this population.
Methods
Study Design and Patients
This study was a 24-week, randomized, double-blind, double-dummy, active-controlled, parallel-group clinical trial conducted at 82 clinics in 11 countries: Canada, India, Israel, Malaysia, Mexico, the Philippines, Russia, Sri Lanka, Thailand, Ukraine and the USA (ClinicalTrials.gov number: NCT01512979).
Individuals were eligible if they were aged≥18 years, were newly diagnosed with type 2 diabetes (<12 months before the first visit), had HbA1c levels≥8.5 and≤12.0%, had not received any glucose-lowering drug in the previous 12 weeks, and had a body mass index≤45 kg/m2; the lower threshold
for HbA1c was chosen specifically to include patients with marked hyperglycaemia. The main exclusion criteria were: acute coronary syndrome, stroke or transient ischaemic attack within the previous 3 months; hepatic disease (serum level of alanine transaminase, aspartate transaminase and/or alkaline phosphatase>3 times the upper limit of normal); kidney dis-ease (creatinine clearance of<60 ml/min as calculated by the Cockcroft–Gault equation); contraindication to metformin or linagliptin; premenopausal women who were nursing, pregnant or not practising birth control; bariatric surgery within the pre-vious 2 years; history of cancer or pancreatitis; and treatment with anti-obesity drugs or systemic steroids.
All patients provided written informed consent before participation. The study protocol was approved by the inde-pendent ethics committees or institutional review boards of all participating centres. The study was carried out according to the principles of the Declaration of Helsinki, and Good Clinical Practice defined by the International Conference on Harmonisation Harmonised Tripartite Guideline.
Procedures
After screening, eligible patients received open-label treatment for 1 week with placebo tablets (matching both linagliptin and metformin), mainly to ensure compliance with study proce-dures. Patients were then randomized to receive oral treatment for 24 weeks with linagliptin 5 mg once daily and metformin twice daily in free combination or linagliptin 5 mg once daily as monotherapy. Randomization was performed using a cen-tral interactive voice/web response system to allocate patients 1 : 1 to treatments, with a block size of four and stratification by baseline HbA1c (<9.5/≥9.5%). Treatment assignment was concealed from patients and investigators using a double-blind, double-dummy design. In the combination arm, metformin was initiated at 1000 mg daily for the first week (one 500 mg tablet twice daily plus one matching placebo tablet twice daily), and was then uptitrated to 1500 mg daily for the second week (500 mg twice daily plus 500 mg once daily plus matching placebo once daily). In weeks 3–6, metformin was further upti-trated to 2000 mg daily (two 500 mg tablets twice daily) if fast-ing plasma glucose (FPG) was>6.1 mmol/l and was downti-trated to 1500 mg daily if intolerable side effects were expe-rienced with 2000 mg. Metformin dose was kept stable from weeks 6 to 24. Patients in the linagliptin monotherapy arm received two metformin-matching placebo tablets twice daily from weeks 1 to 24.
Patients received diet and exercise counselling before open-label placebo treatment and were reminded at each sub-sequent visit to follow the diet and exercise plan. Rescue med-ication [any glucose-lowering drug except a DPP-4 inhibitor, metformin or a glucagon-like peptide (GLP)-1 receptor ago-nist] was permitted for hyperglycaemia: FPG >15 mmol/l during weeks 1–6; >13.3 mmol/l during weeks 7–12; >11.1 mmol/l during weeks 13–24; confirmed by ≥2 mea-surements on different days.
Endpoints
The primary endpoint was the change from baseline in HbA1c after 24 weeks of treatment. Secondary endpoints were: change
from baseline in HbA1c by visit over time; percentage of patients achieving HbA1c reduction ≥0.5 or ≥1.0% after 24 weeks; percentage of patients achieving HbA1c<7.0% after 24 weeks; change from baseline in FPG after 24 weeks; and change from baseline in FPG by visit over time. Additional endpoints included change in body weight from baseline at week 24.
Safety endpoints were defined as the incidence and intensity of adverse events, including hypoglycaemia and prespecified adverse events of interest (defined below), the use of rescue therapy and changes from baseline in blood pressure, pulse or laboratory values. Adverse events of interest were: pancreati-tis; renal events (e.g. acute renal failure,≥2-fold increase in creatinine from baseline); hepatic events (elevations in alanine transaminase , aspartate transaminase or alkaline phosphatase >3 times upper limit of normal, hepatitis, liver injury, jaundice, Hy’s Law cases); hypersensitivity reactions; and severe cuta-neous adverse reactions. Adverse events were classified using the Medical Dictionary for Regulatory Activities version 16.0. Statistical Analyses
Two-hundred and seventy patients (135 per treatment group) were needed for 90% power to detect a between-group dif-ference of 0.6% in change in HbA1c from baseline using a two-sided test with a significance level (𝛼) of 0.05, assum-ing a standard deviation for change in HbA1c of 1.25% in both groups. The sample size calculation accounted for 20 and 40% of randomized patients in the linagliptin/metformin and linagliptin groups, respectively, to be potentially excluded from the primary efficacy analysis because of dropout, protocol vio-lations or use of rescue therapy.
The primary efficacy analysis of change in HbA1c from base-line to week 24 was performed on the per-protocol completers’ cohort (PPCC): all randomized patients who received≥1 dose of study drug, had a baseline HbA1c measurement, had no important protocol violations, completed 24 weeks of treatment without receiving glycaemic rescue, and had an HbA1c mea-surement at week 24. The PPCC was defined to assess responses to continuous, unchanged treatment for 24 weeks with the two glucose-lowering strategies tested. Because all individuals in the PPCC had week-24 HbA1c values available, no imputa-tion for missing data was needed and results are reported as observed cases. As a sensitivity analysis, the primary analysis was also conducted based on intent-to-treat principles on the full-analysis set: all randomized patients who received≥1 dose of study drug and had a baseline HbA1c measurement and≥1 on-treatment HbA1c measurement, using last observation car-ried forward (LOCF) to impute missing data. The full-analysis set is a close approximation of the intent-to-treat set (all ran-domized patients) and is commonly used in diabetes stud-ies because at least one on-treatment HbA1c measurement is needed to assess glycaemic efficacy. In both analyses, an analysis of covariance (ancova) model was used that included treat-ment as a fixed effect and baseline HbA1c as a linear covariate. An additional sensitivity analysis of the full-analysis set using observed cases employed a mixed model for repeated mea-surements (MMRM) with terms for treatment, visit, baseline HbA1c-by-visit interaction and visit-by-treatment interaction
as fixed effects, baseline HbA1c as a linear covariate and patient as a random effect. The superiority of linagliptin/metformin versus linagliptin was tested using the two-sided p value and the 95% confidence interval (CI) of the treatment difference (linagliptin/metformin minus linagliptin).
Change in FPG from baseline to week 24 was analysed for the PPCC with a similar ancova model to that described above, which contained treatment as a fixed classification effect and baseline HbA1c and baseline FPG as linear covariates. Missing data were imputed using LOCF because the PPCC definition was based on available data for HbA1c, not FPG, at week 24.
The HbA1c levels over time were analysed for the PPCC using observed cases and by summarizing data descriptively. Change in FPG over time was analysed using a similar MMRM to that described above, with additional terms for baseline FPG and baseline FPG-by-visit interaction as fixed effects.
Logistic regression models were used to calculate the odds ratios for achievement of HbA1c <7.0% and reductions in HbA1c of≥0.5% and≥1.0% in the PPCC, with missing val-ues imputed using the non-completers-considered-failure approach. These models included terms for treatment and continuous baseline HbA1c.
Change in body weight from baseline to week 24 was anal-ysed for the PPCC (observed cases) using an ancova model with terms for treatment, continuous baseline HbA1c and con-tinuous baseline body weight.
Adverse events were analysed with descriptive statistics for the treated set: all randomized patients who received≥1 dose of study medication.
Results
Baseline Characteristics and Demographics
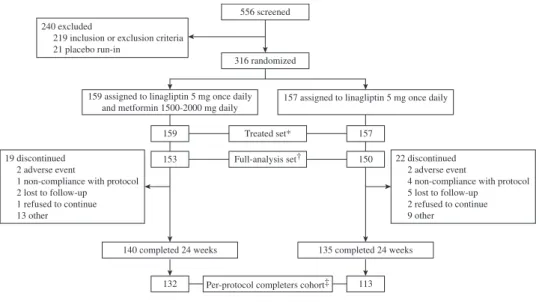
The first patient was enrolled on 24 January 2012 and the last patient visit occurred on 15 April 2013. Three-hundred and sixteen patients were randomized to linagliptin/metformin (n=159) or linagliptin (n=157), and all received ≥1 dose of study drug; these patients comprised the treated set (Figure 1). The full-analysis set consisted of 303 patients: 153 in the linagliptin/metformin group and 150 in the linagliptin group; the PPCC comprised 245 patients: 132 in the linagliptin/metformin group and 113 in the linagliptin group.
Patients in the full-analysis set not included in the PPCC were those with protocol violations (linagliptin/metformin, n=7; linagliptin, n=12), of which the most common were the unnecessary use of rescue therapy (linagliptin/metformin, n=3; linagliptin, n=8). Also excluded were those not com-pleting 24 weeks and/or not having a week-24 HbA1c value (linagliptin/metformin, n=11; linagliptin, n=15; includ-ing two patients in the linagliptin/metformin group and one in the linagliptin group who received rescue therapy); and those completing 24 weeks who received rescue therapy (linagliptin/metformin, n=3; linagliptin, n=10).
Patients were newly diagnosed, treatment naïve and poorly controlled. Demographic and clinical characteristics were sim-ilar between treatment groups at baseline (Table 1). Overall, mean (standard deviation) age, HbA1c, FPG and body mass index were 48.8 (11.0) years, 9.8% (1.1), 10.9 (3.2) mmol/l,
240 excluded
219 inclusion or exclusion criteria 21 placebo run-in
19 discontinued 2 adverse event
1 non-compliance with protocol 2 lost to follow-up
1 refused to continue 13 other
22 discontinued 2 adverse event
4 non-compliance with protocol 5 lost to follow-up 2 refused to continue 9 other 556 screened 316 randomized 159 153 157 150 Treated set* Full-analysis set†
132 Per-protocol completers cohort‡ 113 *The treated set comprised all randomized patients who received ≥1 dose of study medication
†The full-analysis set is commonly used in diabetes studies, and is a close approximation of the intent-to-treat set (all randomized patients). The full-analysis set comprised all randomized patients who received ≥1 dose of study drug and had a baseline HbA1c measurement and ≥1 on-treatment HbA1c measurement ‡The pre-protocol completers' cohort comprised all randomized patients who received ≥1 dose of study drug, had a baseline HbA1c measurement, had no important protocol violations, completed 24 weeks of treatment without receiving glycaemic rescue, and had an HbA1c measurement at week 24.
140 completed 24 weeks 135 completed 24 weeks
159 assigned to linagliptin 5 mg once daily and metformin 1500-2000 mg daily
157 assigned to linagliptin 5 mg once daily
Figure 1. Patient disposition.
and 29.7 (5.6) kg/m2, respectively. HbA1c and FPG were sim-ilar in the PPCC, and also did not differ substantially between treatment groups (data not shown). Forty-nine percent of patients were aged<50 years, most were white (57.6%) or Asian (38.3%), and 44 and 12% already had macrovascular disease and microvascular disease, respectively.
Of the linagliptin/metformin group in the treated set, 138 (86.8%) patients received 2000 mg daily of metformin during the stable-dosing period (weeks 6–24) and 20 (12.6%) received 1500 mg. One patient (0.6%) received 1000 mg during the titration period (weeks 1–6) and discontinued before onset of stable dosing.
Efficacy
After 24 weeks, the adjusted mean±standard error (s.e.) change from baseline in HbA1c was −2.81±0.12% in the linagliptin/metformin group and −2.02±0.13% in the linagliptin group, a treatment difference of –0.79% [95% CI –1.13 to –0.46; p<0.0001 (Figure 2A)]. The sensitivity anal-ysis of the full-analanal-ysis set (MMRM) was consistent with the primary analysis: adjusted mean±s.e. change from baseline in HbA1c was −2.72±0.12% with linagliptin/metformin and −1.80±0.12% with linagliptin, a treatment difference of−0.91% [95% CI−1.25 to−0.58; p<0.0001 (Figure S1A, Supporting Information)]. The USA Food and Drug Admin-istration (FDA) conducted a separate MMRM analysis of the HbA1c changes in the present study, as part of its standard review process for supplemental new drug applications; in their analysis, adjusted mean±s.e. change from baseline in HbA1c was found to be−2.9% with linagliptin/metformin and
−2.0% with linagliptin, a treatment difference of−0.84% (95% CI −1.23 to −0.45; p<0.0001) [16]. The minor differences
between results from the two MMRM analyses are proba-bly attributable to the slightly different set of covariates in the FDA’s analysis, which included terms for baseline renal impairment-by-treatment interaction and baseline renal impairment-by-treatment-by-visit interaction. The addi-tional sensitivity analysis of the full-analysis set (LOCF) was also consistent with the primary analysis (Figure S1B). Change in HbA1c over time is shown in Figure 2B. The adjusted mean change from baseline in FPG after 24 weeks was
−2.61±0.21 mmol/l in the linagliptin/metformin group and
−1.68±0.23 mmol/l in the linagliptin group, a treatment dif-ference of−0.94 mmol/l (95% CI−1.55 to−0.32; p=0.0032). FPG levels were almost maximally reduced no more than 6 weeks after treatment initiation (Figure 2C).
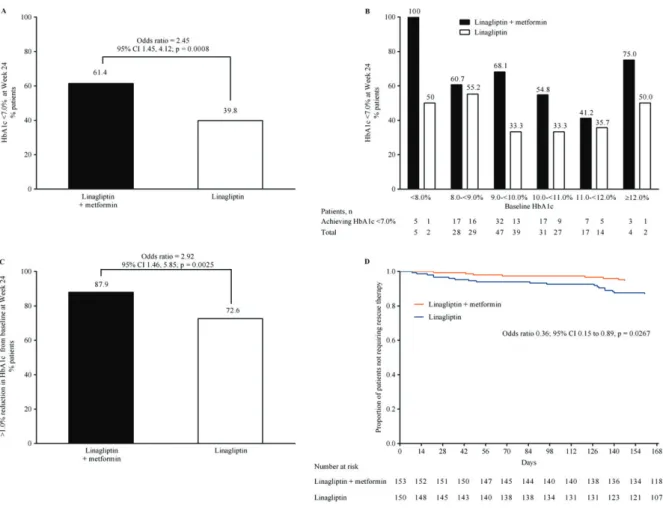
An HbA1c concentration of<7.0% at week 24 was achieved by 61 and 40% of patients in the linagliptin/metformin and linagliptin groups, respectively (Figure 3A); in general, patients with lower baseline HbA1c achieved an HbA1c of <7.0% more than those with higher baseline HbA1c (Figure 3B). The large majority of patients in the linagliptin/metformin group (88%) achieved HbA1c reductions from baseline of ≥1.0% after 24 weeks, as did a high proportion of patients receiving linagliptin monotherapy (73%; Figure 3C). An HbA1c reduc-tion of≥0.5% after 24 weeks was achieved by 93.9 and 81.4% of patients receiving linagliptin/metformin and linagliptin, respectively. Notably, the overall need for rescue therapy was low in both arms (Figure 3D): 8 (5.2%) patients in the linagliptin/metformin group and 19 (12.7%) in the linagliptin group.
The adjusted mean change in body weight from baseline to week 24 was −1.07±0.30 kg with linagliptin/metformin and 0.24±0.32 kg with linagliptin; a treatment difference of
Table 1.Baseline demographic and clinical characteristics. Linagliptin and metformin group Linagliptin group Mean±s.d. age, years 49.0±10.9 48.6±11.2 Age group, n (%) <35 years 16 (10.1) 17 (10.8) 35 to<50 years 59 (37.1) 63 (40.1) 50 to<65 years 76 (47.8) 67 (42.7) ≥65 years 8 (5.0) 10 (6.4) Male, n (%) 69 (43.4) 77 (49.0) Race, n (%) White 97 (61.0) 85 (54.1) Asian 57 (35.8) 64 (40.8) Black 5 (3.1) 6 (3.8) Native American/Alaskan 0 2 (1.3) Diabetes duration, n (%) <1 year 159 (100.0) 155 (98.7)* Mean±s.d. HbA1c†, % 9.79±1.19 9.88±1.10 HbA1c†, n (%) <7.0% 1 (0.7)‡ 0 7.0 to<8.0% 5 (3.3)‡ 2 (1.3)‡ 8.0 to<9.0% 32 (20.9) 34 (22.7) ≥9.0% 115 (75.2) 114 (76.0)
Mean±s.d. fasting plasma glucose†, mmol/l 10.87±3.02 10.98±3.37 Number of antidiabetes drugs at screening, n (%)
0 159 (100.0) 157 (100.0)
Mean±s.d. fasting plasma C-peptide†, pmol/l 514±276 510±232 Mean±s.d. proinsulin:insulin ratio† 0.45±0.29 0.44±0.29 Mean±s.d. HOMA-IR†, mU/l×mmol/l 7.73±7.06 7.60±5.17 Mean±s.d. HOMA-%𝛽†, mU/mmol 53.24±54.75 55.21±68.29 Mean±s.d. body mass index, kg/m2 29.84±5.82 29.63±5.43
Renal function (eGFR), according to MDRD, n (%)
Normal (≥90 ml/min/1.73 m2) 87 (54.7) 90 (57.3)
Mild impairment (60 to<90 ml/min/1.73 m2) 69 (43.4) 64 (40.8)
Moderate impairment (30 to<60 ml/min/1.73 m2) 3 (1.9) 3 (1.9)
Severe impairment (<30 ml/min/1.73 m2) 0 0
Microvascular disease, n (%) 20 (12.6) 18 (11.5)
Retinopathy 7 (4.4) 6 (3.8)
Nephropathy 2 (1.3) 2 (1.3)
Neuropathy 14 (8.8) 13 (8.3)
Macrovascular disease, n (%) 67 (42.1) 72 (45.9)
Coronary artery disease 10 (6.3) 13 (8.3)
Peripheral artery disease 7 (4.4) 1 (0.6)
Cerebrovascular disease 7 (4.4) 9 (5.7) Hypertension 65 (40.9) 69 (43.9) Concomitant medication, n (%) 99 (62.3) 108 (68.8) Aspirin 22 (13.8) 20 (12.7) Antihypertensive drugs 65 (40.9) 65 (41.4) Lipid-lowering drugs 30 (18.9) 33 (21.0)
Data are for the treated set of patients (linagliptin and metformin: n=159; linagliptin: n=157) unless otherwise indicated.
s.d., standard deviation; eGFR, estimated glomerular filtration rate; HbA1c, glycated haemoglobin; HOMA-IR, homeostasis model assessment of insulin resis-tance; HOMA-%𝛽, homeostasis model assessment of𝛽-cell function; MDRD, Modi-fication of Diet in Renal Disease Equation.
*For two linagliptin patients, the time since diagnosis of type 2 diabetes was ≥12 months at screening.
†Full-analysis set (linagliptin and metformin: n=153; linagliptin: n=150). ‡These patients had an HbA1c level≥8.5–≤12.0% at screening and therefore were eligible for inclusion.
Figure 2.(A) Adjusted mean change in glycated haemoglobin (HbA1c) at week 24 in the per-protocol completers’ cohort (PPCC; observed cases). (B) HbA1c over time in the PPCC (observed cases). (C) Adjusted mean change in fasting plasma glucose (FPG) over time in the PPCC (observed cases). s.e., standard error; FAS, full-analysis set.
Tolerability
Adverse events were reported by 56 and 61% of patients in the linagliptin/metformin and linagliptin groups, respectively, but few were deemed by investigators to be related to the study drug (8.8 and 5.7%, respectively) and very few led to discontinuation (1.3% in each group; Table 2). Serious adverse events occurred
Figure 3. (A) Percentage of patients achieving glycated haemoglobin (HbA1c)<7.0% [per-protocol completers’ cohort (PPCC),
non-completers-considered-failure approach). (B) Percentage of patients achieving HbA1c<7.0% (PPCC, non-completers-considered-failure approach) by baseline HbA1c.
(C) Reduction from baseline in HbA1c of>1.0% at week 24 (PPCC, non-completers-considered-failure approach). (D) Kaplan–Meier estimates of time to
start of first rescue therapy (full-analysis set).
in<2% of patients in each group and none were attributed to the study drug.
No individual adverse event occurred in>10% of patients in the linagliptin/metformin group (Table 2). Hyperglycaemia, as judged by investigators, occurred in fewer patients receiv-ing linagliptin/metformin than linagliptin alone (3.1 and 12.7%, respectively). Gastrointestinal disorders occurred in similar proportions of patients in the linagliptin/metformin and linagliptin groups (14.5 and 13.4%, respectively), and led to discontinuation of the study drug in two patients (1.3%) in the linagliptin/metformin group (nausea, small intestinal obstruction) and one patient (0.6%) in the linagliptin group (abdominal distension). Diarrhoea was the only type of gas-trointestinal disturbance to occur in substantially more patients in the linagliptin/metformin group than in the linagliptin group (5.7 vs. 1.9% respectively), albeit only in a small number of individuals. Hypoglycaemia occurred in three (1.9%) and five (3.2%) patients in the linagliptin/metformin and linagliptin groups, respectively; no episodes were severe (requiring assistance from another person to administer carbohydrate or other resuscitative action). There were no deaths and no cases of pancreatitis, pancreatic cancer or heart failure during treatment.
Discussion
Newly diagnosed type 2 diabetes patients with marked hyper-glycaemia present a clinical challenge for physicians, as there are limited data available for making informed treatment deci-sions in this population. Although almost every international guideline suggests considering insulin therapy in these patients, several barriers limit this approach in clinical practice [11]. Patients may resist initiating insulin because of the need for multiple injections and effects on their quality of life, while physicians may be reluctant because of limited time to educate patients and the risks of severe hypoglycaemia and weight gain. In this randomized controlled study, the oral initial combi-nation of linagliptin and metformin elicited clinically relevant improvements in glycaemic control (mean HbA1c reduction of−2.8%) in patients with newly diagnosed type 2 diabetes with marked hyperglycaemia (mean baseline HbA1c 9.7%). Linagliptin monotherapy also elicited a significant reduction in HbA1c (−2.0%). Reductions in hyperglycaemia were rapid, as shown by near-maximum decreases in FPG after only 6 weeks and substantial HbA1c reductions by this time; a rapid antihyperglycaemic effect is considered important to pre-vent or alleviate acute symptoms of marked hyperglycaemia.
Table 2.Adverse events over 24 weeks. Linagliptin and metformin group (n=159) Linagliptin group (n=157) Overall (%)
Any adverse event 56.0 61.1
Drug-related adverse event 8.8 5.7
Serious adverse event 1.9 1.3
Death 0.0 0.0
Requiring hospitalisation 1.9 1.3
Drug-related 0.0 0.0
Adverse event leading to discontinuation 1.3 1.3
Severe adverse event 1.3 1.9
Adverse event of special interest* 3.1 3.8
Gastrointestinal disorders† 14.5 13.4
Adverse events with an incidence>2.0%‡
Dyslipidaemia 8.8 14.0
Urinary tract infection 6.3 8.9
Headache 6.3 4.5
Diarrhoea 5.7 1.9
Back pain 3.8 2.5
Hyperglycaemia 3.1 12.7
Upper respiratory tract infection 2.5 3.2
Dizziness 2.5 1.9
Nausea 2.5 1.9
Pain in extremity 2.5 1.9
Hypertension 2.5 0.6
Hypertriglyceridaemia 2.5 0.6
Alanine aminotransferase increased 2.5 0.0
Hypoglycaemia 1.9 3.2
Gastritis 0.6 2.5
Arthralgia 0.0 3.8
Data are percentage of the treated set of patients.
*Pancreatitis, renal adverse event, hepatic adverse event, hypersensitivity reaction, severe cutaneous reaction.
†System organ class from the Medical Dictionary for Regulatory Activities,
version 16.0 (MedDRA).
‡Preferred terms from MedDRA.
Importantly, there was a low rate of drug-related adverse events. Almost none of the patients experienced an episode of hypoglycaemia, and none experienced severe hypogly-caemia, suggesting that linagliptin with metformin may offer clinical advantages over insulin or metformin/sulphonylurea combinations, as those treatments are commonly associ-ated with an increased risk of hypoglycaemia. Tolerability of treatment is particularly important in drug-naïve patients, in order to permit quick relief of symptoms and improve adherence. With regard to the latter, while the present study evaluated linagliptin and metformin administered in free combination, a fixed-dose combination tablet is available in the USA and other countries. Compared with pills administered separately, single-pill combinations of oral glucose-lowering drugs may increase adherence, improve glycaemic con-trol, increase patient satisfaction and reduce direct medical costs [17–19].
Notably, there was a clinically relevant rate of achievement of HbA1c<7.0% with the initial combination of linagliptin and metformin (∼60%) and even with linagliptin monotherapy (∼40%), despite marked hyperglycaemia at baseline. This is
noteworthy as the UKPDS showed that early initiation of glucose-lowering pharmacotherapy in newly diagnosed type 2 diabetes (achieving a mean HbA1c of 7.0%) was associated with a significantly lower risk of microvascular complications [1]. Additionally, a so-called legacy effect occurred, whereby 10 years after the end of randomized treatment, patients who had received early pharmacotherapy had a significantly lower risk of macro- and microvascular complications, despite mean HbA1c levels in the two groups converging soon after treatment end [2]. Consequently, the importance of early man-agement of type 2 diabetes is emphasized by guidelines [8–10]; however, clinical inertia often results in patients having inad-equate glycaemic control with monotherapy for several years before additional glucose-lowering drugs are prescribed [20]. This provides another rationale for initial combination treatment.
It is generally agreed that people with marked hypergly-caemia would benefit from initiating combination treatment, although the HbA1c level for which this is recommended differs between guidelines [8–10]. The present study sup-ports this approach by showing that the majority of newly diagnosed patients with marked hyperglycaemia can achieve larger HbA1c reductions with initial combination therapy than with monotherapy. Few other randomized clinical trials have compared initial combination therapy with monotherapy exclusively in patients with newly diagnosed type 2 dia-betes and marked hyperglycaemia [21]. The GRADE study (NCT01794143) is comparing long-term control with sulpho-nylureas, DPP-4 inhibitors, GLP-1 receptor agonists or insulin in patients inadequately controlled with metformin; how-ever, it is neither restricted to newly diagnosed patients nor employs initial combination therapy [22]. The VERIFY study (NCT01528254) is comparing the glycaemic durability of an initial combination of metformin and vildagliptin (not mar-keted in the USA) with metformin monotherapy in patients diagnosed for ≤24 months, but only those with HbA1c of 6.5–7.5% [23].
The large reductions in HbA1c in the present study suggest that newly diagnosed patients may respond well to oral treat-ment, particularly when key pathophysiological features are addressed in a complementary manner, with linagliptin target-ing impaired𝛽-cell function and excessive glucagon secretion and metformin improving hepatic insulin resistance. There may also be additive effects: metformin appears to increase plasma levels of GLP-1, enhance islet-cell gene expression of the receptors for GLP-1 and glucose-dependent insulinotropic polypeptide and sensitize𝛽cells to the insulinotropic effects of GLP-1 and glucose-dependent insulinotropic polypeptide [24]. The glycaemic efficacy compares well with previous data for non-insulin glucose-lowering drugs, in general [25,26], and for initial combinations of metformin with other oral glucose-lowering drugs including DPP-4 inhibitors [21,27–34]. Specifically, initial combination of linagliptin, sitagliptin, saxagliptin, vildagliptin or alogliptin with metformin elicited mean HbA1c reductions ranging from −1.6 to −2.5% from mean baseline HbA1c levels of 8.5–9.9% [28–34]; in those studies including a DPP-4 monotherapy arm, mean HbA1c reductions with monotherapy ranged from to−0.6 to−1.7%
[28,31–34]. The high baseline HbA1c in the present study could account for some differences in response, as the magnitude of HbA1c decreases with glucose-lowering drugs is proportional to the initial level; however, this effect is usually modest, for example, a 0.3% greater absolute reduction per 1% higher baseline HbA1c level after 24 weeks of treatment [35], and baseline HbA1c in some of the above studies was as high as in the present study. Perhaps of more relevance is that none of the above trials exclusively recruited newly diagnosed patients with marked hyperglycaemia. A short duration of diabetes and high baseline HbA1c were previously found to be independent predictors of larger HbA1c reductions with an initial combi-nation of DPP-4 inhibitor and metformin [36]. Furthermore, severe hyperglycaemia has been shown to increase DPP-4 expression [37]. Taken together, these data could indicate a milieu in patients with newly diagnosed type 2 diabetes and marked hyperglycaemia that may be particularly responsive to DPP-4 inhibition.
Few randomized clinical studies have compared oral treat-ments with insulin therapy in newly diagnosed patients with marked hyperglycaemia. In an observational study, newly diag-nosed patients (n=24) with severe hyperglycaemia (baseline HbA1c≥12.0%) achieved a similar mean reduction in HbA1c with non-insulin treatment (−6.4%, n=19) compared with insulin treatment (−5.9%, n=5) [38]. Interestingly, newly diagnosed patients had significantly better HbA1c reductions and achievement of target HbA1c than previously diagnosed patients, despite a much lower rate of insulin use. Together with the unexpectedly large HbA1c reductions seen in the present study, one interpretation of these data is that newly diagnosed patients may be a distinct population to those with longer-standing disease, who might have already received oral treatment; for the latter, initiating insulin therapy may be an appropriate strategy, while oral combinations of agents with complementary, pathophysiologically directed mechanisms and few side effects may be more suitable for the former. This concept warrants further research as current guideline recom-mendations for initiating insulin treatment in patients with marked hyperglycaemia do not generally distinguish between newly diagnosed patients and those with longer-standing disease.
A limitation of the present study is that most patients were white or Asian and results may not necessarily apply to other demographics. Additionally, a metformin monotherapy arm was not included and, for ethical reasons, there was no inactive comparator to determine if lifestyle modification contributed to the glycaemic improvements; however, its effect was prob-ably minimal as there were no substantial reductions in body weight in either group. Furthermore, the durability of glycaemic response could not be assessed in a study lasting 24 weeks, a duration that is typical of studies investigating glycaemic efficacy.
In conclusion, the present study could aid treatment decisions for newly diagnosed patients with marked hyper-glycaemia. The results suggest that oral treatment with the initial combination of linagliptin and metformin can elicit rapid and clinically relevant improvements in glycaemic con-trol in this population, potentially enabling many patients
to achieve an HbA1c level of <7% without hypoglycaemia or other adverse effects, including weight gain. The response to linagliptin monotherapy was also notable. The present data support the early combination approach to treating patients with type 2 diabetes [5–7], particularly the newly diagnosed with marked hyperglycaemia, and suggest that such individuals may be successfully managed with non-insulin therapy.
Acknowledgements
This study was sponsored by Boehringer Ingelheim, the man-ufacturer of linagliptin. The authors thank the patients and staff involved in this study. Data from this study have previ-ously been presented at the 22nd World Diabetes Congress, Melbourne, Australia, 2–6 December 2013 (Abstract ME-2726). Medical writing assistance, supported financially by Boehringer Ingelheim, was provided by Giles Brooke, PhD, CMPP, of Envision Scientific Solutions during the preparation of this manuscript.
Conflict of Interest
S. A. R. has received honoraria for lectures, received research grants and served on advisory boards for Boehringer Ingel-heim, AstraZeneca, Bristol-Myers Squibb, Eli Lilly, Novo Nordisk, Merck and Sanofi. A. E. C. has received honoraria for participation in scientific advisory boards organized by Boehringer Ingelheim. S. D. P. has received honoraria for attending meetings, consultancy fees, speaker fees and/or travel grants from Boehringer Ingelheim. B. G. is a member of advisory boards for AstraZeneca, Bristol-Myers Squibb, Boehringer Ingelheim, Eli Lilly, Novartis, Novo Nordisk, Merck, Roche, Sanofi and Takeda and has also received hono-raria from these companies for giving lectures. D. L.-D., Z. B., S. T., S. P., H.-J. W., and M. v. E. are employees of Boehringer Ingelheim.
S. A. R., A. E. C., S. D. P. and B. G. participated in the design of the study, conduct of the study, collection and interpretation of data and preparation of the manuscript. D. L.-D. participated in conduct of the study, interpretation of data and preparation of the manuscript. Z. B. participated in conduct of the study, performed the statistical analysis and participated in interpre-tation of data and preparation of the manuscript. S. P., H.-J. W. and M. v. E. participated in design of the study, conduct of the study, interpretation of data and preparation of the manuscript. S. T. participated in interpretation of data and preparation of the manuscript. All authors approved the final version of the manuscript.
Supporting Information
Additional Supporting Information may be found in the online version of this article:
Figure S1.(A) Adjusted mean change in HbA1c at week 24 in the FAS (observed cases) employing a mixed model for repeated measurements. (B) Adjusted mean change in HbA1c at week 24 in the FAS (LOCF).
References
1. UK Prospective Diabetes Study (UKPDS) Group. Intensive blood-glucose control with sulphonylureas or insulin compared with conventional treatment and risk of complications in patients with type 2 diabetes (UKPDS 33). Lancet 1998;352: 837–853.
2. Holman RR, Paul SK, Bethel MA, Matthews DR, Neil HA. 10-year follow-up of intensive glucose control in type 2 diabetes. N Engl J Med 2008;359: 1577–1589.
3. Turner RC, Cull CA, Frighi V, Holman RR. UK Prospective Diabetes Study (UKPDS) Group. Glycemic control with diet, sulfonylurea, metformin, or insulin in patients with type 2 diabetes mellitus: progressive requirement for multiple therapies (UKPDS 49). JAMA 1999;281: 2005–2012.
4. Kahn SE, Haffner SM, Heise MA et al. Glycemic durability of rosiglita-zone, metformin, or glyburide monotherapy. N Engl J Med 2006; 355: 2427–2443.
5. Del Prato S, Penno G, Miccoli R. Changing the treatment paradigm for type 2 diabetes. Diabetes Care 2009;32(Suppl. 2): S217–S222.
6. DeFronzo RA, Eldor R, Abdul-Ghani M. Pathophysiologic approach to therapy in patients with newly diagnosed type 2 diabetes. Diabetes Care 2013;36(Suppl. 2): S127–S138.
7. Raz I. Guideline approach to therapy in patients with newly diagnosed type 2 diabetes. Diabetes Care 2013;36(Suppl. 2): S139–S144.
8. Inzucchi SE, Bergenstal RM, Buse JB et al. Management of hyperglycemia in type 2 diabetes: a patient-centered approach: position statement of the American Diabetes Association (ADA) and the European Association for the Study of Diabetes (EASD). Diabetes Care 2012;35: 1364–1379.
9. Garber AJ, Abrahamson MJ, Barzilay JI et al. AACE comprehensive diabetes management algorithm 2013. Endocr Pract 2013;19: 327–336.
10. Harper W, Clement M, Goldenberg R et al. Canadian Diabetes Association 2013 Clinical Practice Guidelines for the Prevention and Management of Diabetes in Canada: pharmacologic management of type 2 diabetes. Can J Diabetes 2013; 37: S61–S68.
11. Ross SA, Tildesley HD, Ashkenas J. Barriers to effective insulin treatment: the persistence of poor glycemic control in type 2 diabetes. Curr Med Res Opin 2011;27(Suppl. 3): 13–20.
12. Tradjenta (linagliptin) prescribing information. Ridgefield, CT: Boehringer Ingel-heim Pharmaceuticals Inc., 2013.
13. Trajenta (linagliptin). Summary of product characteristics. Ingelheim, Germany: Boehringer Ingelheim International GmbH & Co. KG. 2013.
14. Graefe-Mody U, Retlich S, Friedrich C. Clinical pharmacokinetics and pharma-codynamics of linagliptin. Clin Pharmacokinet 2012;51: 411–427.
15. Weng J, Li Y, Xu W et al. Effect of intensive insulin therapy on beta-cell function and glycaemic control in patients with newly diagnosed type 2 diabetes: a multicentre randomised parallel-group trial. Lancet 2008;371: 1753–1760.
16. Jentadueto (linagliptin and metformin hydrochloride) prescribing information. Ridgefield, CT: Boehringer Ingelheim Pharmaceuticals Inc., 2014.
17. Han S, Iglay K, Davies MJ, Zhang Q, Radican L. Glycemic effectiveness and medication adherence with fixed-dose combination or coadministered dual therapy of antihyperglycemic regimens: a meta-analysis. Curr Med Res Opin 2012;28: 969–977.
18. Blonde L, San Juan ZT. Fixed-dose combinations for treatment of type 2 diabetes mellitus. Adv Ther 2012;29: 1–13.
19. Hutchins V, Zhang B, Fleurence RL, Krishnarajah G, Graham J. A systematic review of adherence, treatment satisfaction and costs, in fixed-dose combi-nation regimens in type 2 diabetes. Curr Med Res Opin 2011;27: 1157–1168. 20. Khunti K, Wolden ML, Thorsted BL, Andersen M, Davies MJ. Clinical inertia in
people with type 2 diabetes: a retrospective cohort study of more than 80,000 people. Diabetes Care 2013;36: 3411–3417.
21. Phung OJ, Sobieraj DM, Engel SS, Rajpathak SN. Early combination therapy for the treatment of type 2 diabetes mellitus: systematic review and meta-analysis. Diabetes Obes Metab 2014;16: 410–417.
22. Nathan DM, Buse JB, Kahn SE et al. Rationale and design of the glycemia reduction approaches in diabetes: a comparative effectiveness study (GRADE). Diabetes Care 2013;36: 2254–2261.
23. Del Prato S, Foley JE, Kothny W et al. Study to determine the durability of gly-caemic control with early treatment with a vildagliptin-metformin combination regimen vs. standard-of-care metformin monotherapy-the VERIFY trial: a ran-domized double-blind trial. Diabet Med 2014;31: 1178–1184.
24. Cho YM, Kieffer TJ. New aspects of an old drug: metformin as a glucagon-like peptide 1 (GLP-1) enhancer and sensitiser. Diabetologia 2011; 54: 219–222.
25. Bennett WL, Maruthur NM, Singh S et al. Comparative effectiveness and safety of medications for type 2 diabetes: an update including new drugs and 2-drug combinations. Ann Intern Med 2011;154: 602–613.
26. Phung OJ, Scholle JM, Talwar M, Coleman CI. Effect of noninsulin antidiabetic drugs added to metformin therapy on glycemic control, weight gain, and hypoglycemia in type 2 diabetes. JAMA 2010;303: 1410–1418.
27. Wu D, Li L, Liu C. Efficacy and safety of dipeptidyl peptidase-4 inhibitors and metformin as initial combination therapy and as monotherapy in patients with type 2 diabetes mellitus: a meta-analysis. Diabetes Obes Metab 2014;16: 30–37.
28. Goldstein BJ, Feinglos MN, Lunceford JK, Johnson J, Williams-Herman DE. Effect of initial combination therapy with sitagliptin, a dipeptidyl peptidase-4 inhibitor, and metformin on glycemic control in patients with type 2 diabetes. Diabetes Care 2007;30: 1979–1987.
29. Reasner C, Olansky L, Seck TL et al. The effect of initial therapy with the fixed-dose combination of sitagliptin and metformin compared with metformin monotherapy in patients with type 2 diabetes mellitus. Diabetes Obes Metab 2011;13: 644–652.
30. Wainstein J, Katz L, Engel SS et al. Initial therapy with the fixed-dose combina-tion of sitagliptin and metformin results in greater improvement in glycaemic control compared with pioglitazone monotherapy in patients with type 2 dia-betes. Diabetes Obes Metab 2012;14: 409–418.
31. Bosi E, Dotta F, Jia Y, Goodman M. Vildagliptin plus metformin combination therapy provides superior glycaemic control to individual monotherapy in treatment-naive patients with type 2 diabetes mellitus. Diabetes Obes Metab 2009;11: 506–515.
32. Jadzinsky M, Pfutzner A, Paz-Pacheco E, Xu Z, Allen E, Chen R. Saxagliptin given in combination with metformin as initial therapy improves glycaemic control in patients with type 2 diabetes compared with either monotherapy: a randomized controlled trial. Diabetes Obes Metab 2009;11: 611–622.
33. Pratley RE, Fleck P, Wilson C. Efficacy and safety of initial combination therapy with alogliptin plus metformin versus either as monotherapy in drug-naive patients with type 2 diabetes: a randomized, double-blind, 6-month study. Diabetes Obes Metab 2014;16: 613–621.
34. Haak T, Meinicke T, Jones R, Weber S, von Eynatten M, Woerle HJ. Initial combination of linagliptin and metformin improves glycaemic control in type 2 diabetes: a randomized, double-blind, placebo-controlled study. Diabetes Obes Metab 2012;14: 565–574.
35. Sherifali D, Nerenberg K, Pullenayegum E, Cheng JE, Gerstein HC. The effect of oral antidiabetic agents on A1C levels: a systematic review and meta-analysis. Diabetes Care 2010;33: 1859–1864.
36. Lim S, An JH, Shin H et al. Factors predicting therapeutic efficacy of combination treatment with sitagliptin and metformin in type 2 diabetic patients: the COSMETIC study. Clin Endocrinol (Oxf) 2012;77: 215–223.
37. Mannucci E, Pala L, Ciani S et al. Hyperglycaemia increases dipeptidyl peptidase IV activity in diabetes mellitus. Diabetologia 2005;48: 1168–1172.
38. King WM 4th, McDermott MT, Trujillo JM. Initial management of severe hyper-glycemia in patients with type 2 diabetes: an observational study. Diabetes Ther 2013;4: 375–384.