Supporting Information
Fabrication of Fluoropolymer Microtubes via RAFT
Copolymerization of
N
,
N
’
-Methylene Bisacrylamide Gel Fibers and
Fluoromonomer
Qi Li,
[a, b]Yi Wang,
[a]and Liming Tang*
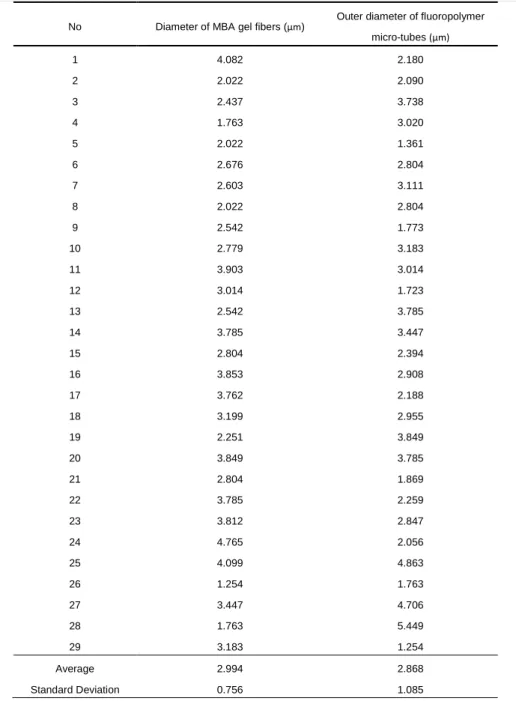
[a]1. Calculation the diameters of MBA gel fibers and outer diameters of fluoropolymer micro-tubes The diameters of MBA gel fibers and the outer diameters of polymer tubes based on Figure 2(a) and 2(c) were measured (see Table S1). The average diameter of MBA xerogel fibers is calculated to be 2.994 μm with the standard deviation at 0.756. The average outer diameter of the tubes is calculated to be 2.868 μm with the standard deviation at 1.085.
Table S1. Diameters of MBA gel fibers and outer diameters of fluoropolymer micro-tubes
No Diameter of MBA gel fibers (μm) Outer diameter of fluoropolymer micro-tubes (μm) 1 4.082 2.180 2 2.022 2.090 3 2.437 3.738 4 1.763 3.020 5 2.022 1.361 6 2.676 2.804 7 2.603 3.111 8 2.022 2.804 9 2.542 1.773 10 2.779 3.183 11 3.903 3.014 12 3.014 1.723 13 2.542 3.785 14 3.785 3.447 15 2.804 2.394 16 3.853 2.908 17 3.762 2.188 18 3.199 2.955 19 2.251 3.849 20 3.849 3.785 21 2.804 1.869 22 3.785 2.259 23 3.812 2.847 24 4.765 2.056 25 4.099 4.863 26 1.254 1.763 27 3.447 4.706 28 1.763 5.449 29 3.183 1.254 Average 2.994 2.868 Standard Deviation 0.756 1.085
2. Yields of products at different amount of PET4A
Yields of products at different amount of PET4A (sample 1-7) are shown in Figure S1. The yield is only 61.7% without PET4A (sample 1), increases to 73.1% at 0.0006 g PET4A and changes slightly as increasing the amount of PET4A.
Figure S1. Yields of polymer micro-tubes obtained at different amount of R-3420.
3. SEM images of polymer micro-tubes
Single polymer micro-tubes at different amount of PET4A are shown in Figure S2. The tube surfaces become rougher as more PET4A being used.
Figure S2. SEM images of single polymer micro-tubes obtained at different amount of PET4A. (a) 0.0006 g; (b) 0.0012 g; (c) 0.0025 g; (d) 0.0050 g; (e) 0.0075g; (f) 0.01 g.
A lower resolution SEM image (250 times) of sample 3 is shown in Figure S3, it shows that only polymer micro-tubes have been resulted, with most of them having smooth surfaces and few of them having particles on the tube surfaces.
Figure S3. A lower resolution SEM image of sample 3.
4. The yields of products obtained at different amount of R-3420
The yields of products obtained at different amount of R-3420 (sample 3 and 8-12) are shown in Figure S4. The yields of the products all ranged between 58.3% and 71.4%.
Figure S4. Yields of polymer micro-tubes obtained at different amount of R-3420.
5. Calculation of the weight percentage of the components from XPS data.
The weight percentage of the monomer units, RAFT reagent and AIBN in the sample could be calculated based on the elemental contents of XPS measurement. The XPS data gives the percent of atomic number of five elements (n %) on the surface of polymer micro-tubes shown in Table S2, according to which the weight percentage of different elements could be calculated by equation 1 (taking C as an example) and shown in Table S2. In equation 1, nC%, nN%,
nO%, nF% and nS% stand for the percent of atomic number of C, N, O, F and S, respectively. MC, MN, MO, MF and MS
stand for the molar mass of C, N, O, F and S, respectively. The wtC% stands for the weight percent of C in polymer
micro-tubes. S S F F O O N N C C C
M
n
M
n
M
n
M
n
M
M
n
wt
%
%
%
%
%
n
%
%
C………
(1)
Table S2. Atomic number and weight percent of five elements on the surface of polymer micro-tubes from XPS data.
Element n % wt % C 56.11 46.734 N 8.65 8.405 O 12.29 13.648 F 21.9 28.880 S 1.05 2.332
The polymer micro-tubes were consisted of five segments: MBA, PET4A, R-3420, DBTTC and AIBN. According to the contents of C, N, O, F and S in the five segments, five equations could be listed below (equation 2-6). In the equations, a, b, c, d and e stand for the weight percentage of AIBN, DBTTC, MBA, PET4A and R-3420, respectively. With the five equations, the weight percent of five segments could be calculated and listed in Table 2 in the main text.
%
332
.
2
%
11
.
33
%
880
.
28
%
77
.
56
%
648
.
13
%
69
.
8
%
33
.
36
%
76
.
20
%
405
.
8
%
17
.
18
%
12
.
34
%
734
.
46
%
62
.
32
%
95
.
57
%
54
.
54
%
03
.
62
%
52
.
58
b
e
e
d
c
c
a
e
d
c
b
a
………
(2)-(6)
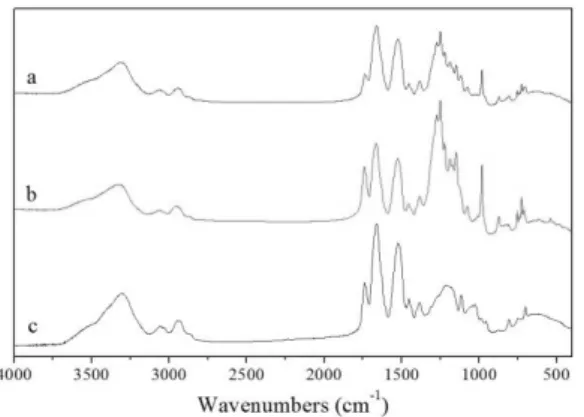
6. The FT-IR spectra of samples 1, 3 and 8
Figure S5. FT-IR spectra of sample 1 (a), sample 3 (b) and sample 8 (c).
7. Adsorption capability of sample 8 in two phase system
A suitable amount of sample 8 was added in toluene and water two phase system (the weight of toluene is about 10 times of the weight of sample 8, lower than the swelling ratio (20.3) of sample 8 in toluene (see Figure 9)). After reaching the saturated state, the absorbing sample 8 was weighted. The weight of the saturated sample was much greater than the total weight of sample 8 and all the toluene in the two phase system, indicated that sample 8 could adsorb both toluene and water. Therefore, sample 8 is unable to separate toluene from water. Figure S6 shows the adsorbing sample immersed in toluene and water two phase system.